
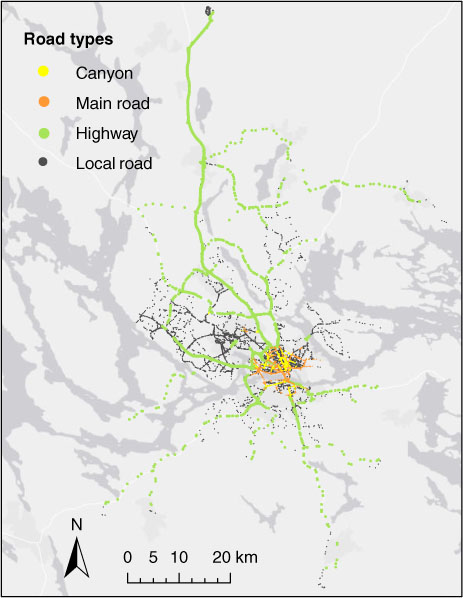
Fig. 1
Map of the roads sampled in the Stockholm metropolitan region.
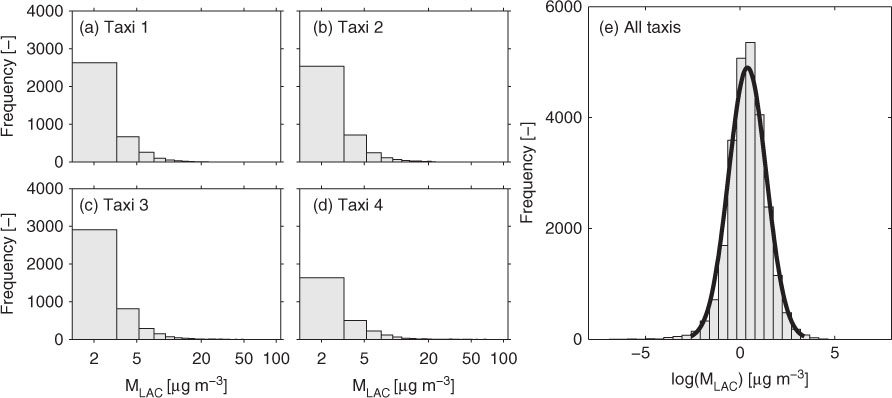
Fig. 2
Frequency-of-occurrence histograms of 1-min MLAC measurements conducted on-board four taxis (individual plots a–d, composite plot e) in the period 7–17 November 2011. The normal density function is also displayed in the composite plot (black line).
Table 1. MLAC descriptive statistics for every taxi and all data together (1-min values), along with fixed site values (hourly data) in the period 7–17 November 2011
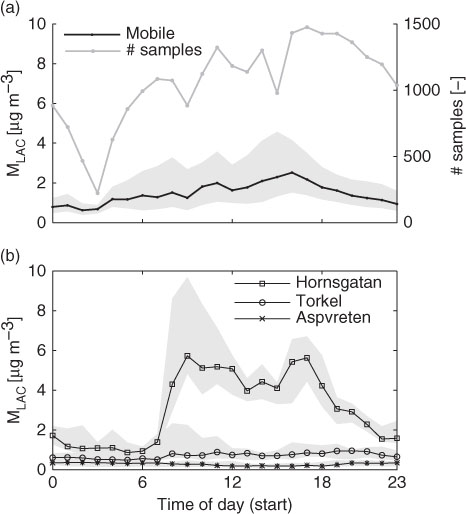
Fig. 3
Diurnal variation of MLAC concentrations (median: solid line, interquartile range: grey area) for all mobile measurements (a), and for three fixed stations (b) in the period 7–17 November 2011. Number of 1-min mobile samples included per hour for the diurnal calculation is also displayed.
Table 2. Vehicle speed descriptive statistics using 1-min median measurements for every taxi and all data together in the period 7–17 Nov 2011
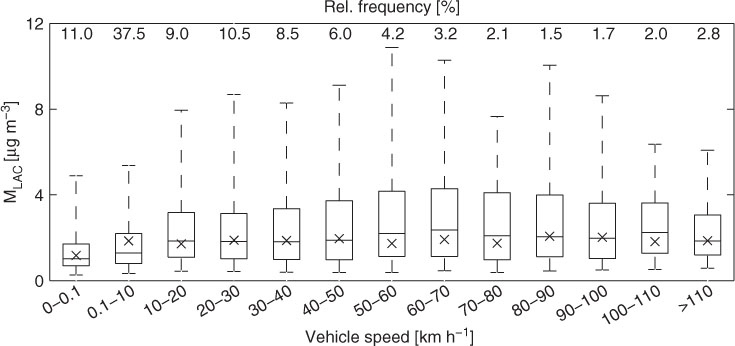
Fig. 4
Box plots of MLAC concentrations (temporally adjusted) classified by the corresponding vehicle speed in the period 7–17 November 2011. Box represents interquartile range and whiskers are lines that extend from the 5th to 95th percentile. Median is indicated by the line across the box and the cross marks the mean value. Percentages in the top line indicate the relative frequency of occurrence for each category.
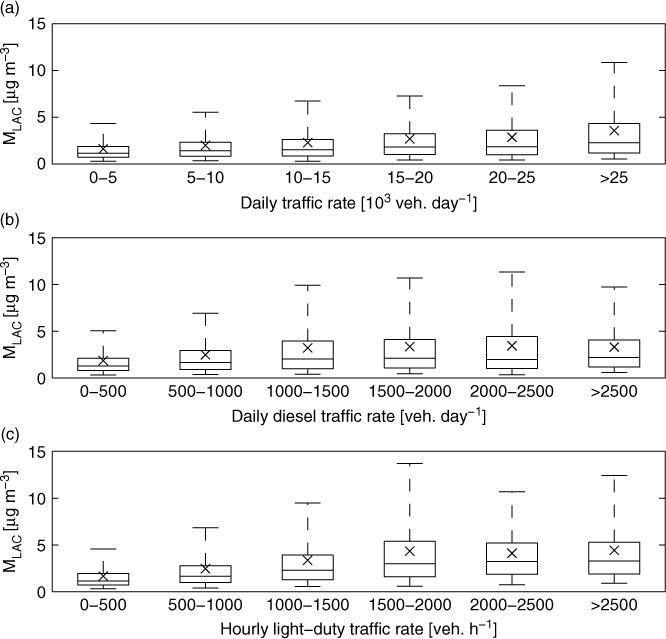
Fig. 5
MLAC concentrations as a function of traffic rates: (a) daily, all vehicles, (b) daily, diesel vehicles, and (c) hourly, gasoline vehicles in the period 7–17 November 2011. Represented are 5th, 25th, 50th, 75th, and 95 percentiles, and mean (x) values.
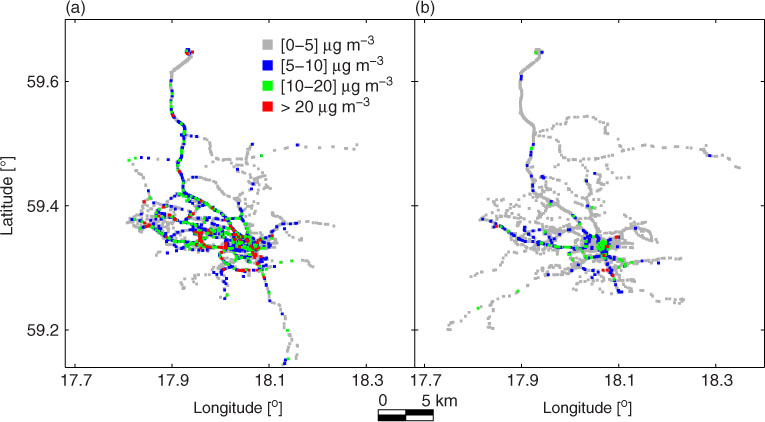
Fig. 6
Spatial distribution of temporally adjusted MLAC concentration in the Stockholm metropolitan area for (a) daytime (06:00–18:00), and (b) night-time (18:00–06:00) in the period 7–17 November 2011.
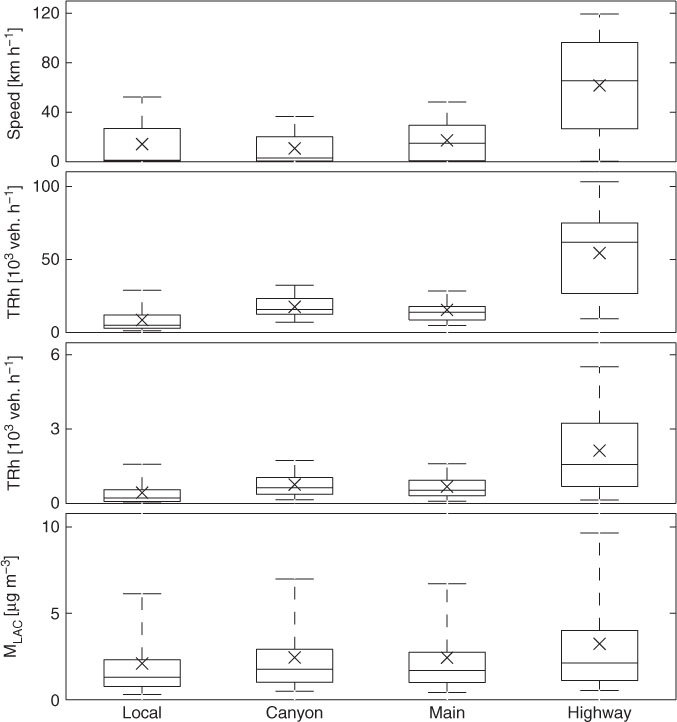
Fig. 7
Boxplot of 1-min vehicle speed, daily (TR) and hourly (TRh) traffic rate, and 1-min MLAC concentrations classified into four categories: local roads, street canyon, main roads, and highways in the period 7–17 November 2011. Represented are 5th, 25th, 50th, 75th, and 95 percentiles, and mean (x) values.
Table 3. Descriptive statistics (1-min values) of temporally adjusted MLAC concentrations for five road types in the period 7–17 Nov 2011
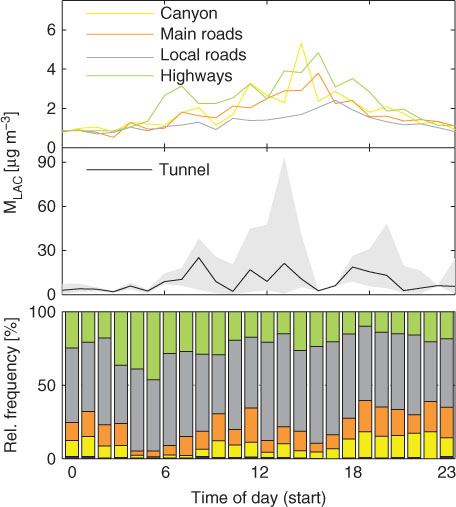
Fig. 8
Upper panel: Diurnal variation of MLAC concentrations (median values) for four roadway groups (canyon, main roads, local roads, and highways) in the period 7–17 November 2011. Middle panel: Median (black line) and 5th to 95th percentile (grey area) MLAC concentrations for tunnels in the same period. Bottom panel: Relative frequency per hour for each roadway group.
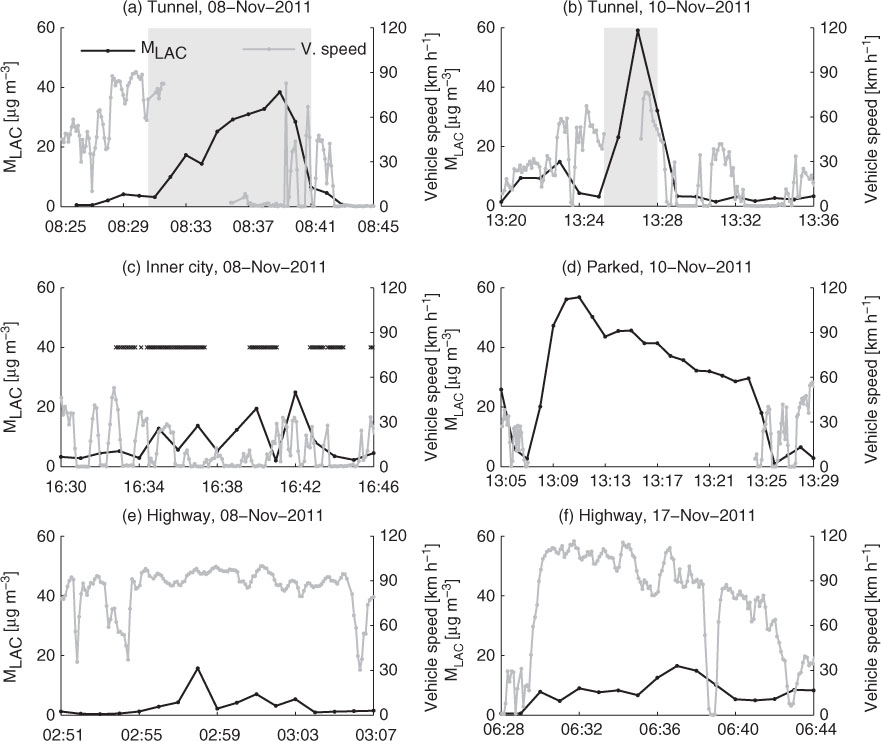
Fig. 9
Case studies: 1-min MLAC time series measured on board taxis together with vehicle speed: (a) Long driving inside Södra Länken tunnel (grey area). (b) Short driving inside Söderledstunneln tunnel (grey area). (c) Stop-and-go driving on Sveavägen street (inner city) due to traffic lights at several intersections, x indicates canyon structure. (d) Taxi parked on a local road very close to a hamburger grill. (e) High speed driving on E20 highway. (f) High speed driving on E4 highway.
Table 4. Correlation matrix between mobile MLAC and numerical independent variables, with r>0.60 displayed in bold