
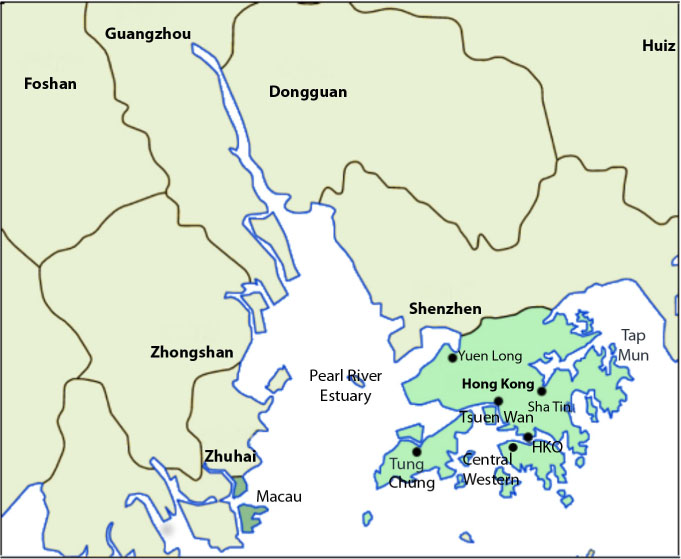
Fig. 1
Map of Hong Kong and the Pearl River Delta region of South China (HKO: Hong Kong Observatory), based on Croquant, 2007 (http://commons.wikimedia.org./wiki/File:Pearl_River_Delta_Area.png).
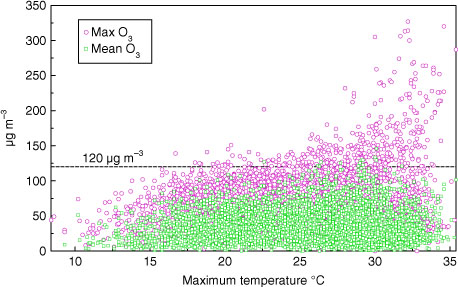
Fig. 2
Daily maximum and mean ozone concentrations versus daily maximum temperature in Hong Kong (Central Western) 1994–2008.
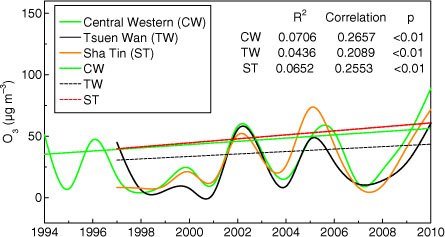
Fig. 3
Mean ozone concentrations in Hong Kong (Central Western, Tsuen Wan and Sha Tin) in autumn 1994/1997–2010.
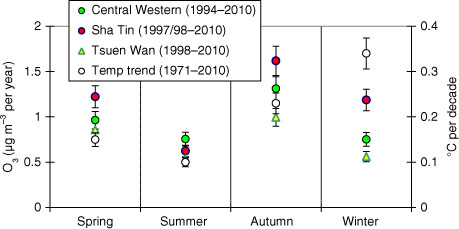
Fig. 4
Seasonal increase of ozone (mid/late 1990s to 2010) and air temperature trend (1971–2010) in Hong Kong (10% error bars).
Table 1. Observed ozone trend in Hong Kong 1994/97/98–2010 (µg m−3 change per year)
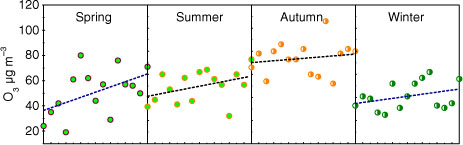
Fig. 5
Seasonal ozone concentrations in Guangzhou in the Pearl River Delta, 2006–2010 showing linear curve fit and upward trends.
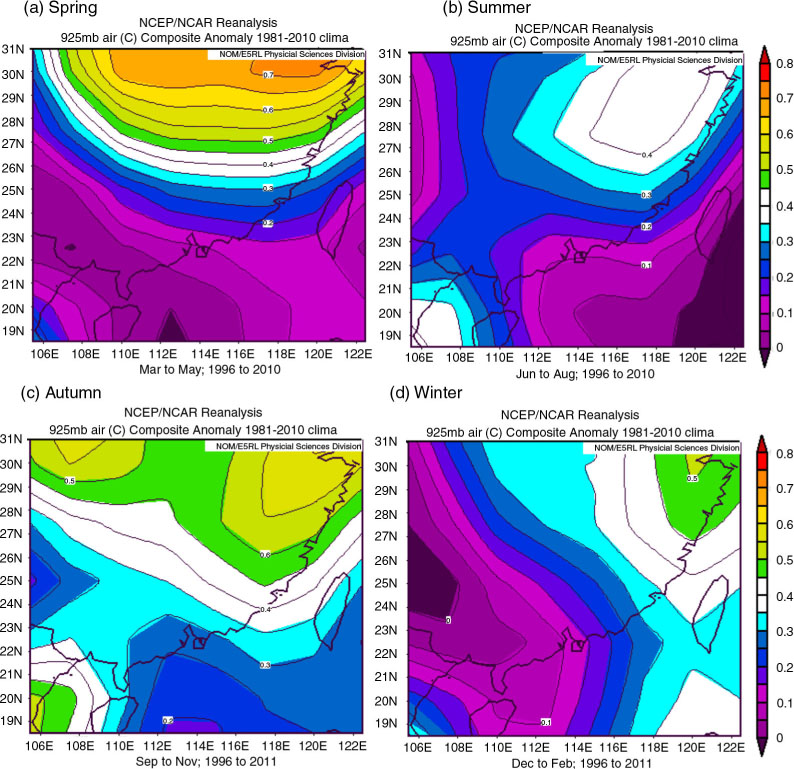
Fig. 6
Temperature anomaly (at 925 hPa) in (a) spring (b) summer (c) autumn and (d) winter in South China 1996–2010.
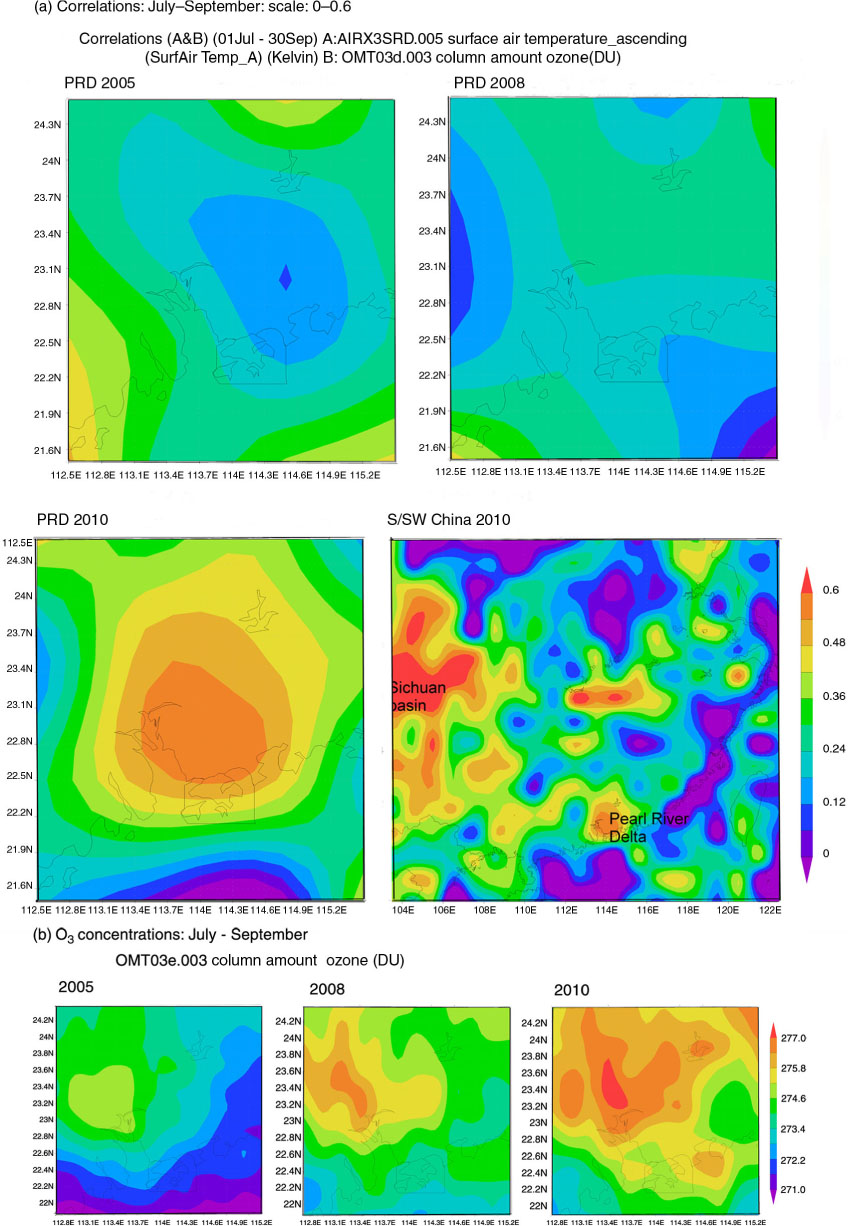
Fig. 7
(a) Correlation between OMI column amount ozone (DU) and AIRS surface air temperature (Kelvin), NEESPI, for the period of 1 July–30 September of 2005, 2008 and 2010 for the Pearl River Delta and 2010 for South/SW China. (b) Column amount ozone for the same period and years: PRD.
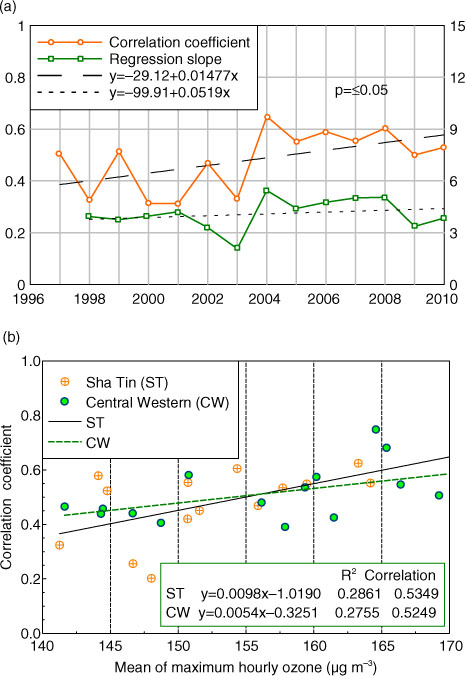
Fig. 8
(a) Trend of ozone sensitivity (correlation coefficients/slopes of regression) to temperature in Hong Kong (Sha Tin) 1997–2010 (b) Relationship between temperature sensitivity and maximum ozone in Hong Kong (spring, summer and autumn) (Sha Tin and Central Western) 1996/1998–2010.
Table 2. Trends of ozone precursors and temperature sensitivity, Hong Kong/Pearl River Delta (PRD)
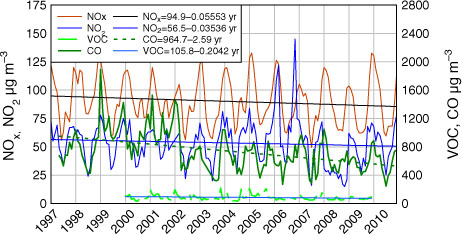
Fig. 9
NOx, NO2 and VOC (total) (Central Western) and CO concentrations (Tsuen Wan) in Hong Kong 1997–2010. Notes: (a) VOC measurement commenced in 2000. (b) No CO data are available from Central Western.
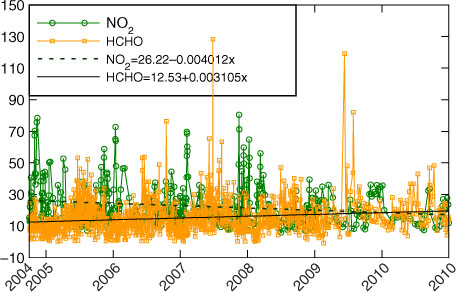
Fig. 10
NO2 OMI tropospheric column amount (clear, 0–30% cloud) and HCHO column amount, Guangzhou (PRD), Oct 2004–Dec 2010 (1015 molecules/cm2).
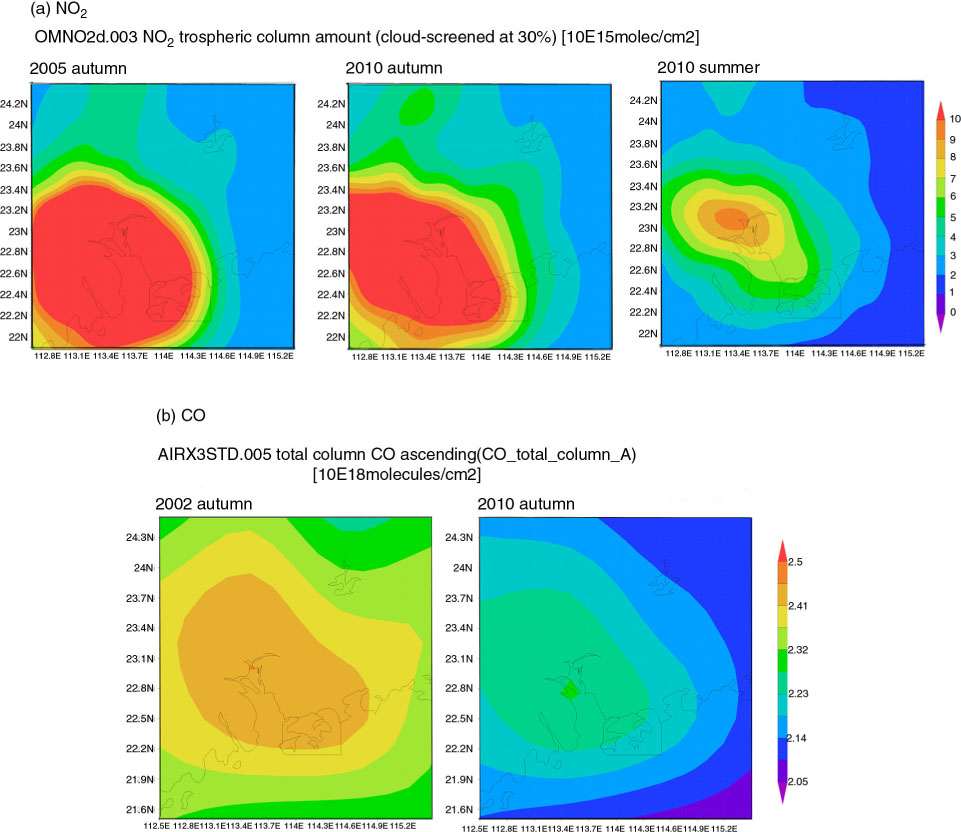
Fig. 11
(a) OMI NO2 tropospheric column amount in the Pearl River Delta/South China Region, autumn 2005 and 2010 and summer 2010 (b) AIRS total column concentration of carbon monoxide (CO) (1018 molecules/cm2) in 2002 and 2010 autumn.
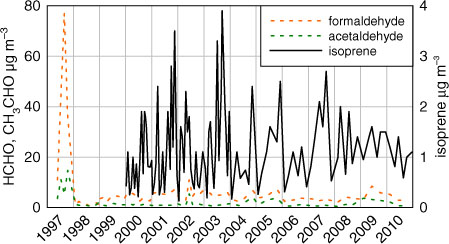
Fig. 12
Reactive VOCs: formaldehyde, acetaldehyde and isoprene in Hong Kong (Central Western), to 2010 in summer.
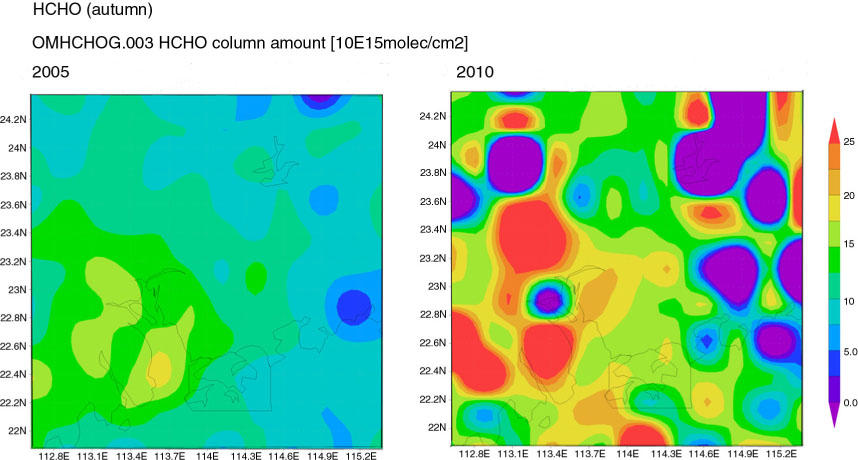
Fig. 13
OMI Formaldehyde column amount in autumn of 2004–2010 in the Pearl River Delta/South China region.
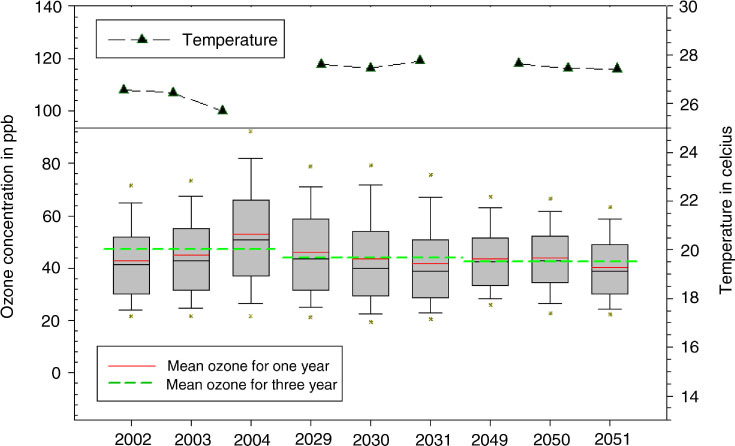
Fig. 14
Ozone trend (July–November) 2002–2051 by CESM (under RCP 4.5).