
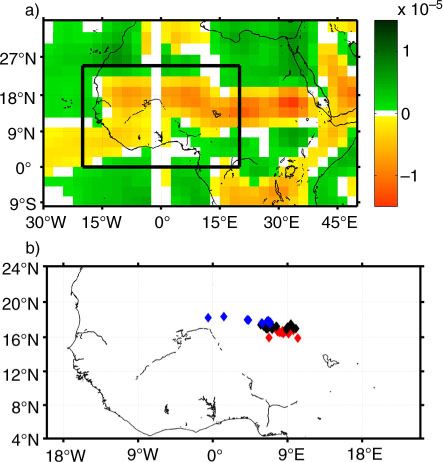
Fig. 1
(a) Mean summer (JJAS) divergence (s−1) at 925 hPa as computed from NCEP Reanalysis winds. The box over which the WACZ COA is computed is outlined in black. (b) Location of seasonal summer (JJAS) mean of WACZ COA over the period 1965–2003. Blue diamonds represent the northern phase of WACZ COA, red diamonds represent southern phase of WACZ COA. The lowest quartile of seasonal data is identified as the ‘south phase’, which corresponds to the seasons when the WACZ was in a southerly position. The highest quartile of seasonal data is identified as the ‘north phase’, which corresponds to the seasons when the WACZ was in a northerly position. Black diamonds represent the middle 50% of seasons of WACZ COA.
{ label needed for table-wrap[@id='UT0001'] }
Table 1. Years that were used to generate seasonal mean composite images of wind, AOT, precipitation and PDSI based on W φ
[i] The lowest quartile (q25) of seasonal data is identified as the ‘south phase’, which corresponds to the seasons when the WACZ was in a southerly position. The highest quartile (q75) of seasonal data is identified as the ‘north phase’, which corresponds to the seasons when the WACZ was in a northerly position. Each season mean was calculated using the average of four individual months of data; June, July, August and September.
{ label needed for table-wrap[@id='UT0002'] }
Table 2. Years that were used to generate seasonal mean composite images of wind, AOT and precipitation on based on W i
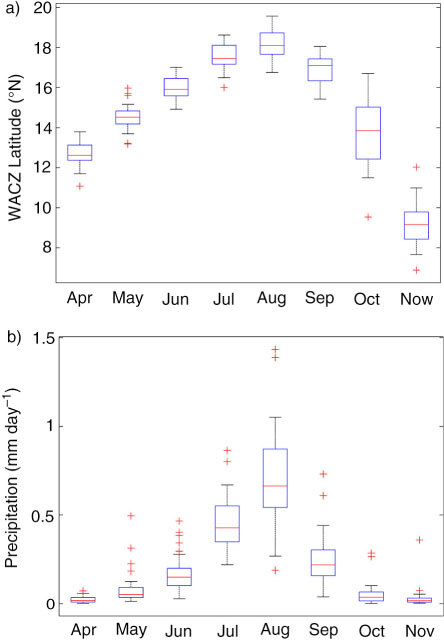
Fig. 2
(a) Box-plot of monthly WACZ Latitude index (W φ ) and (b) precipitation over the Sahel (15°N to 25°N and 0° to 25°E) from GPCP for the summer season of June, July, August, September and adjacent months over the period of 1979–2010. Median value indicated by a horizontal red bar, edges of the central box represent the 25th and 75th percentiles. Whiskers denote the spread of all non-outlying data. Outliers are indicated with red crosses.
Table 3. Pearson product moment correlation coefficients between mean JJAS mineral dust concentrations at Barbados and climatic indices for JJAS season 1965–2003
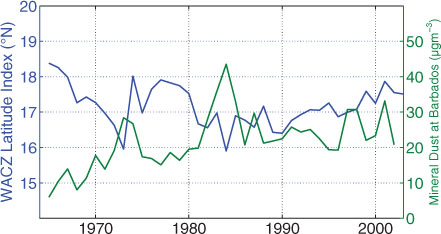
Fig. 3
Time-series of JJAS seasonal WACZ Latitude index (W φ , blue) and mineral dust concentration at Barbados (green) over the period 1965-2003. Seasons in which a month or more of data is missing are excluded from the analysis.
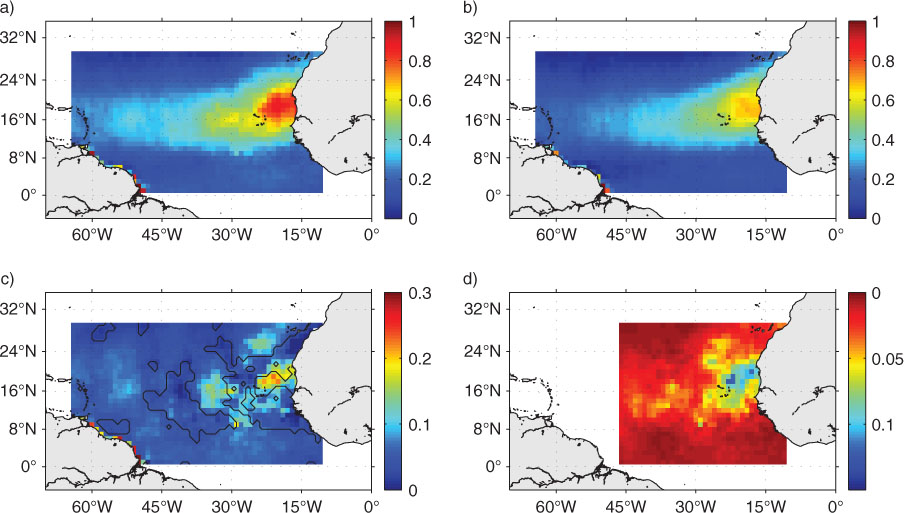
Fig. 4
(a) Composite mean of Evan AOT for the southern phase of summer (JJAS) seasons (q25) of the WACZ. (b) As in (a) but for the northern phase of WACZ latitude (q75). (c) The difference of (a) minus (b), that is, conditions of the WACZ latitude index for which dust load is maximised at Barbados. (d) First EOF mode of Evan AOT summer means, which explains 36% of total variance in the Evan AOT record. All composites and principle components are calculated over the period 1982 to 2010.
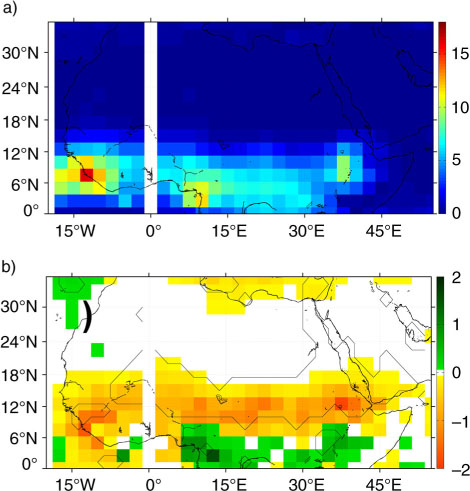
Fig. 5
(a) Composite mean JJAS precipitation during the southernmost latitude years of the WACZ (q25). (b) Difference in composite mean of GPCP precipitation. Differences are calculated by subtracting the seasonal summer mean (JJAS) of the northern most WACZ seasons (q75) from the seasonal summer mean (JJAS) of southern most WACZ seasons (q25). The difference represents the conditions of the WACZ latitude index for which dust load is maximised at Barbados. Units are mmday−1 from GPCP. All composites calculated over the period 1979–2003, black contour represent a significant difference at 10%.
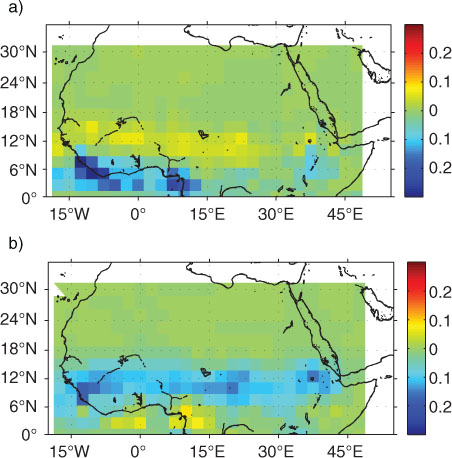
Fig. 6
(a) First EOF mode of GPCP seasonal JJAS precipitation over the period 1979–2010, mode one explains 42% of total GPCP variance. (b) As in (a) but for second mode of GPCP precipitation, which explains 12% of total GPCP variance.
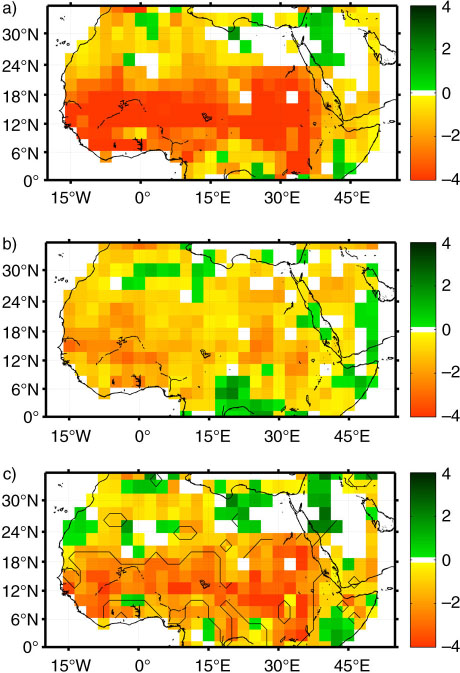
Fig. 7
(a) Composite mean of Palmer Drought Severity Index for south mode of WACZ (q25). (b) As in (a) but for north mode of WACZ (q75). (c) Composite difference of south mode minus the north mode. Differences are calculated by subtracting the seasonal summer mean (JJAS) of the northern most WACZ seasons (q75) from the seasonal summer mean (JJAS) of southern most WACZ seasons (q25). The Palmer Drought Severity Index is negative during drought conditions. The difference represents the conditions of the WACZ latitude index for which dust load is maximised at Barbados. All composites calculated over the period 1965–2003. Black contour represent a significant difference at 10%.
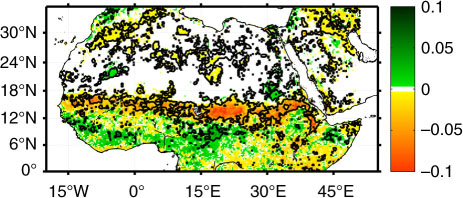
Fig. 8
Difference in composite mean of GIMMS Normalized Difference Vegetation Index (NDVI). Differences are calculated by subtracting the seasonal JJAS mean of the northern most WACZ seasons (q75) from the seasonal JJAS mean southernmost WACZ seasons (q25). The difference represents the conditions of the WACZ latitude index for which dust load is maximised at Barbados. The NDVI is positive when more vegetation is present than the long-term mean and negative when there is less vegetation than the long-term mean. Composite difference calculated over the period 1982–2002. Black contour represent a significant difference at 10%.
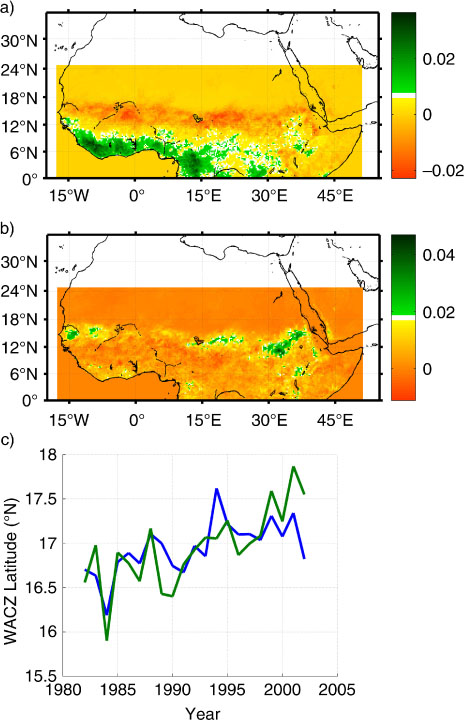
Fig. 9
(a) First EOF mode of NDVI seasonal JJAS mean over the period 1981–2002, mode one explains 39% of total NDVI variance. (b) As in (a) but for second mode of NDVI, which explains 12% of total NDVI variance. (c) Linear regression of the principle component of the first two modes (green line) onto the WACZ latitude index (W φ , blue line).
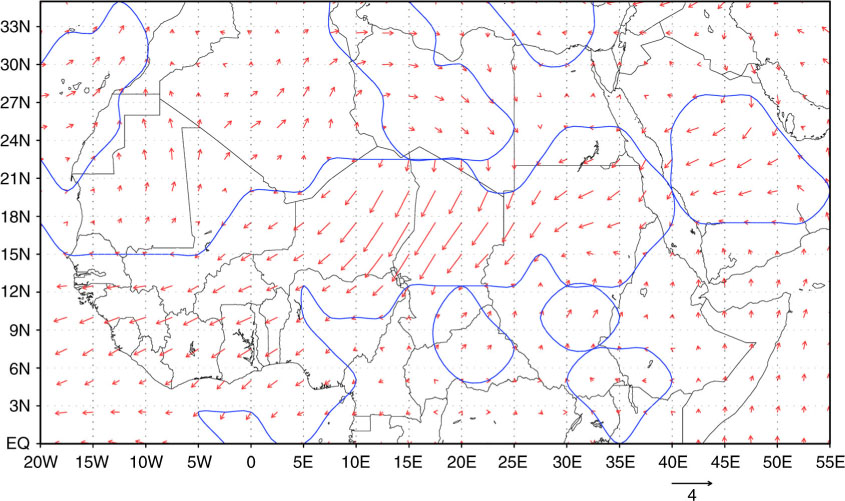
Fig. 10
Difference in composite mean of NCEP Reanalysis winds (ms−1) at 925 hPa. Differences are calculated by subtracting the seasonal summer mean (JJAS) of the northern most WACZ seasons (q75) from the seasonal summer mean (JJAS) of southern most WACZ seasons (q25). The difference represents the conditions of the WACZ latitude index for which dust load is maximised at Barbados. All composites are calculated over the period 1965–2003; blue contour represent a significant difference at 10%.
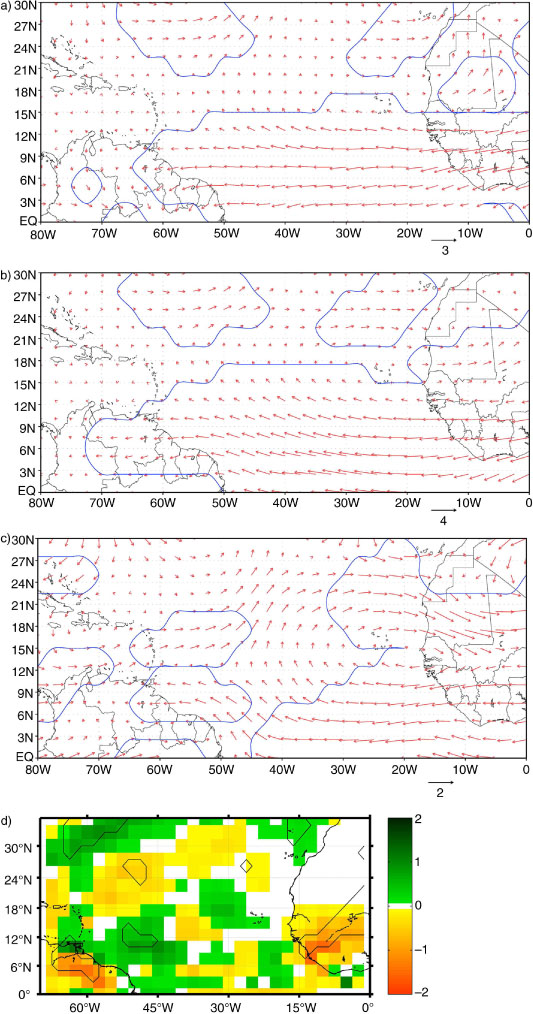
Fig. 11
Difference in composite mean of NCEP Reanalysis winds at (a) 850 hPa, (b) 700 hPa and (c) 500 hPa. Differences are calculated by subtracting the seasonal summer mean (JJAS) of the northern most WACZ seasons (q75) from the seasonal summer mean (JJAS) of southern most WACZ seasons (q25). The difference represents the conditions of the WACZ latitude index for which dust load is maximised at Barbados. Wind composites are calculated over the period 1965–2003; blue contour represent a significant difference at 10%; units are ms−1. (d) Difference in composite mean of GPCP precipitation. Differences are calculated by subtracting the seasonal summer mean (JJAS) of the northern most WACZ seasons (q75) from the seasonal summer mean (JJAS) of southern most WACZ seasons (q25). Units are mmday−1from GPCP. Precipitation composites calculated over the period 1979–2003.
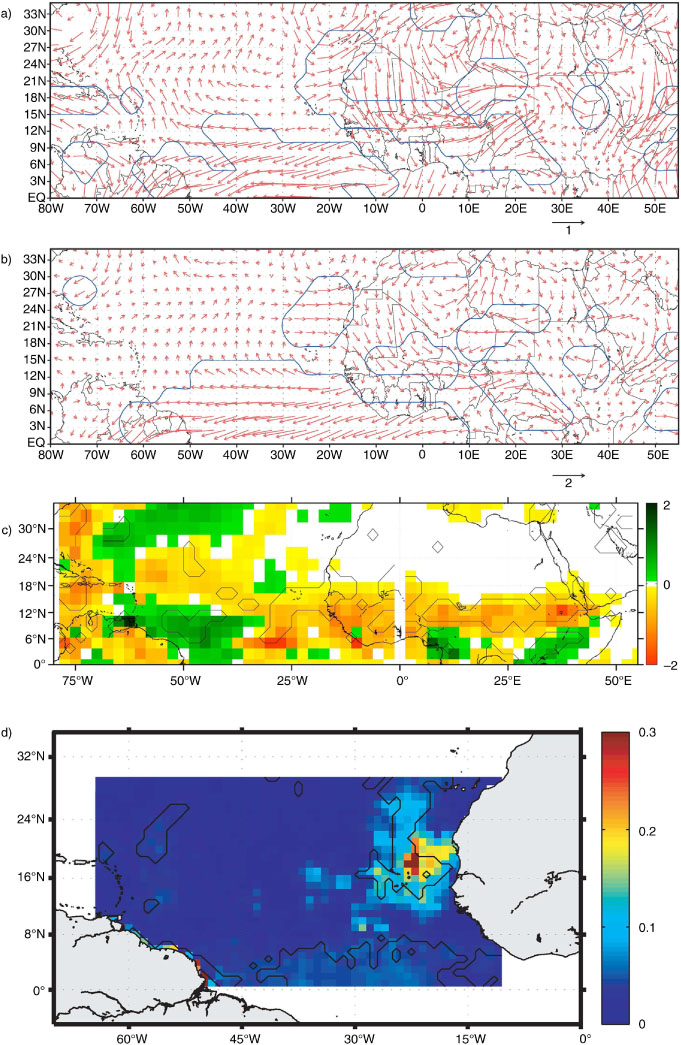
Fig. 12
Composite mean of difference of JJAS seasonal means from weak intensity (q25) WACZ seasons minus strong intensity (q75) WACZ seasons. Difference in wind (ms−1) (a) 925 hPa and (b) 850 hPa over the period 1965–2003. (c) Difference in precipitation (mmday−1) from 1979 to 2003. (d) Difference in AVHRR AOT over the period 1982–2003.
Table 4. Summary of factors impacting emission and transport for changes in phase of W φ and W i