
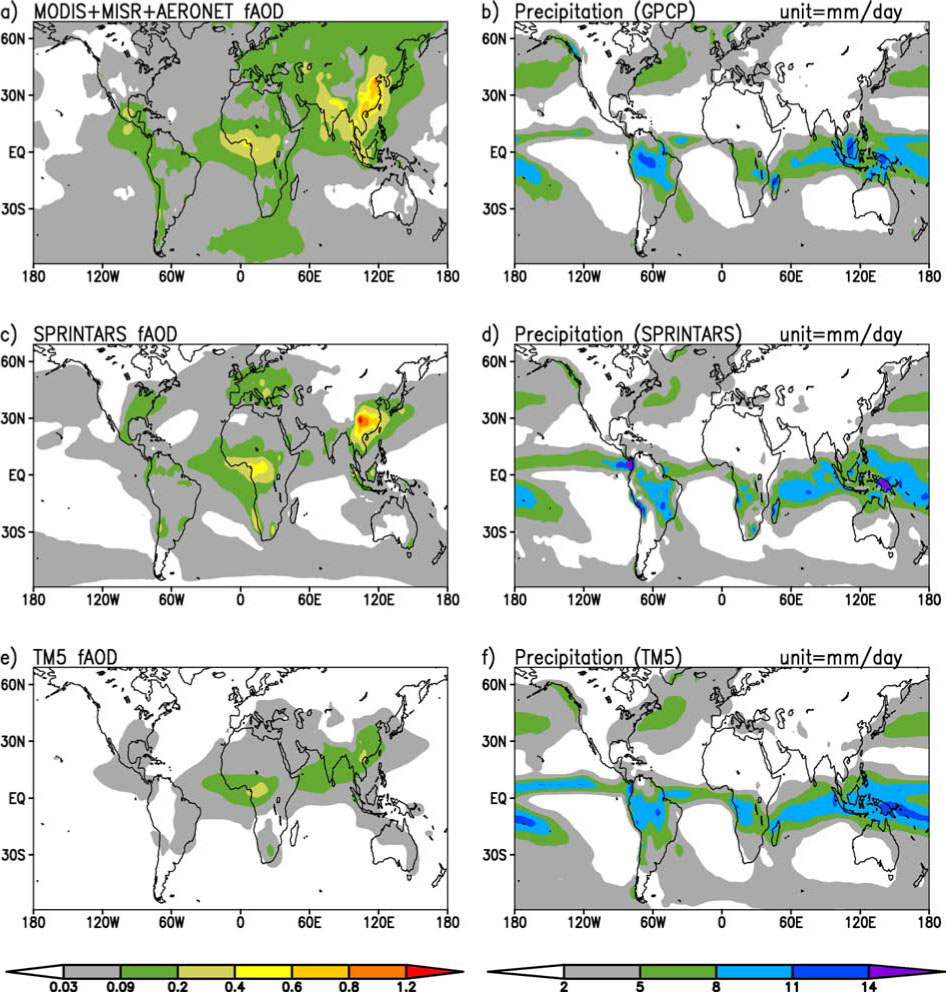
Fig. 1
2001–2008 average fAOD (fine-mode AOD) and precipitation for the DJF (December, January, February) season.
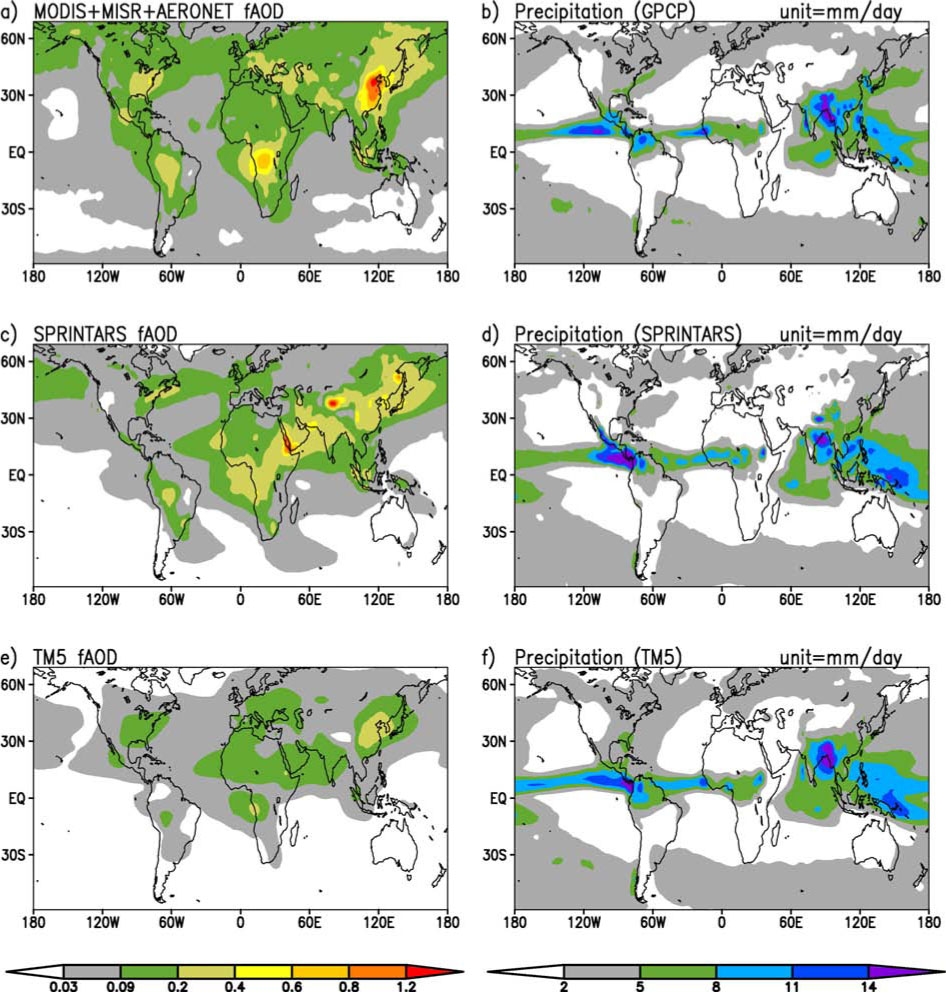
Fig. 2
Same as Fig. 1 except for the JJA (June, July, August) season.
Table 1. Global average of SD (standard deviation)
[i] Note that the MODIS + MISR + AERONET data are the standard observation we use here and is from Lee and Chung (2013). To compute interannual variation SD, we use the 2001–2010 period for detrended MODIS, MISR, AERONET and GPCP data, the 1980–2008 period for detrended SPRINTARS data, and the 2000–2009 period for detrended TM5 data. In computing the global average SD, the data corresponding to the MODIS AOD gaps are removed. Instead of showing SD itself, we show the normalised values in percentage by dividing SD by mean, which is referred to as RSD (relative SD).
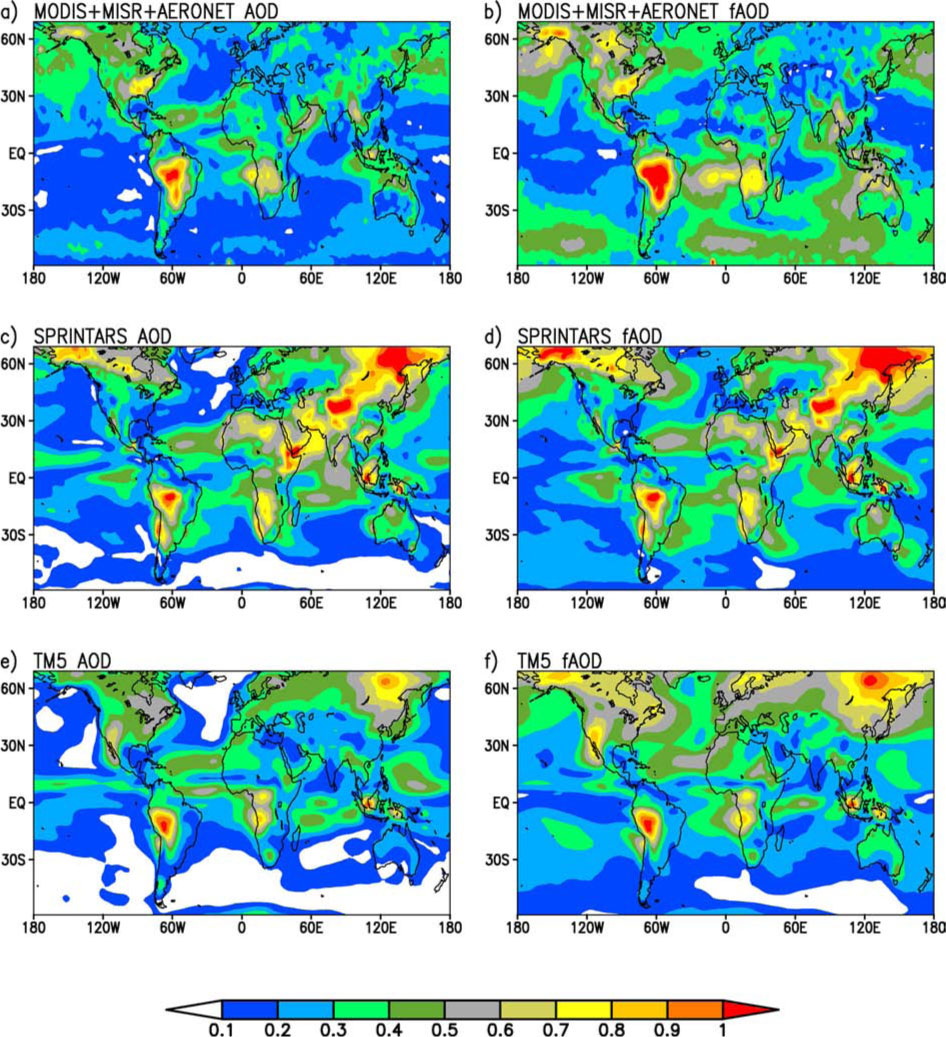
Fig. 3
RSD (Relative standard deviation) of climatological (2001–2008) seasonal variation.
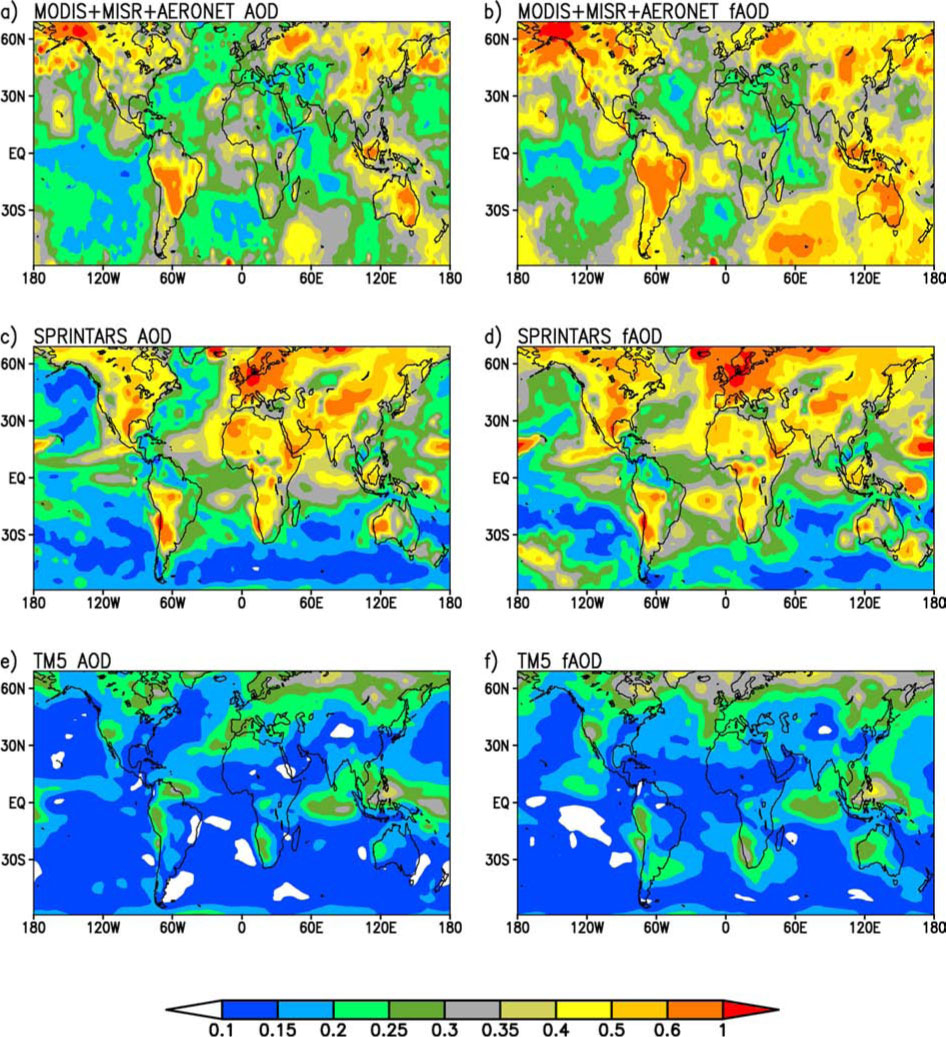
Fig. 4
RSD of interannual variation. See Table 1 for the period used for each dataset.
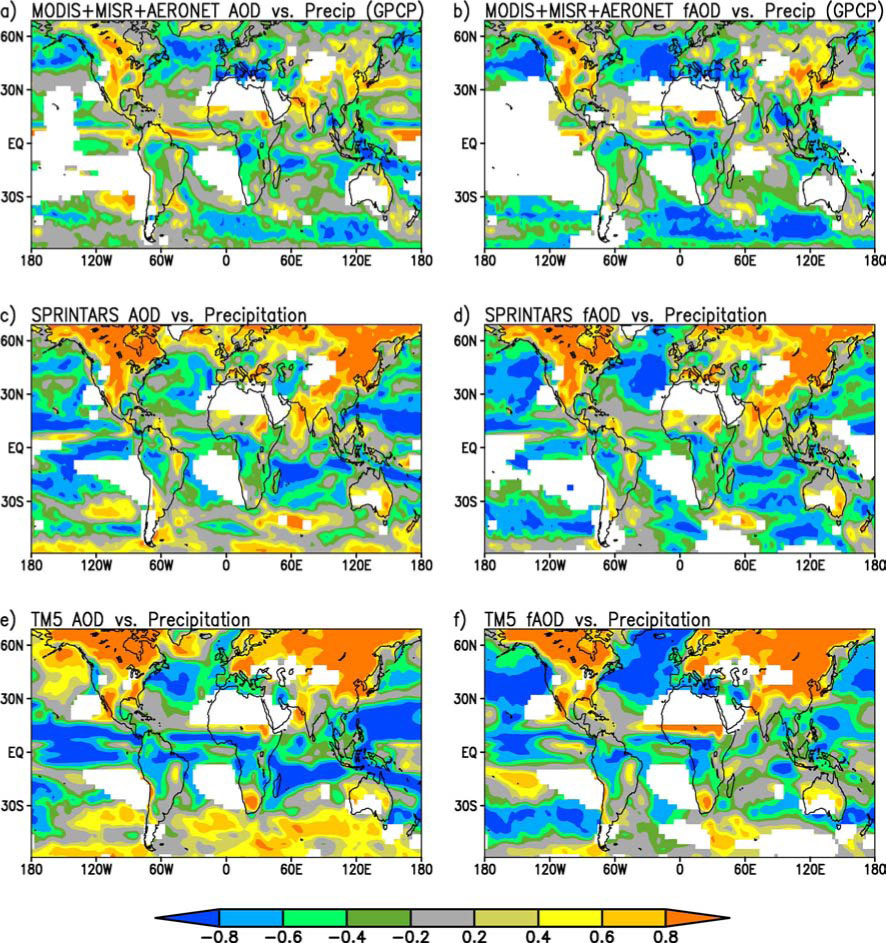
Fig. 5
Seasonal correlation between AOD (or fAOD) and precipitation. Correlation is computed using the 2001–2008 climatological seasonal variation. For consistency, precipitation used for SPRINTARS (or TM5) is used with SPRINTARS (or TM5) AOD. Regions with low AOD (or fAOD) or precipitation variance are masked out. The mask-out threshold values are: 1e-04 (MODIS + MISR + AERONET AOD), 1e-05 (SPRINTARS AOD), 1e-08 (TM5 AOD), 1e-04 (MODIS + MISR + AERONET fAOD), 1e-05 (SPRINTARS fAOD), 1e-06 (TM5 fAOD) and 0.05 (mm/day) (precipitation).
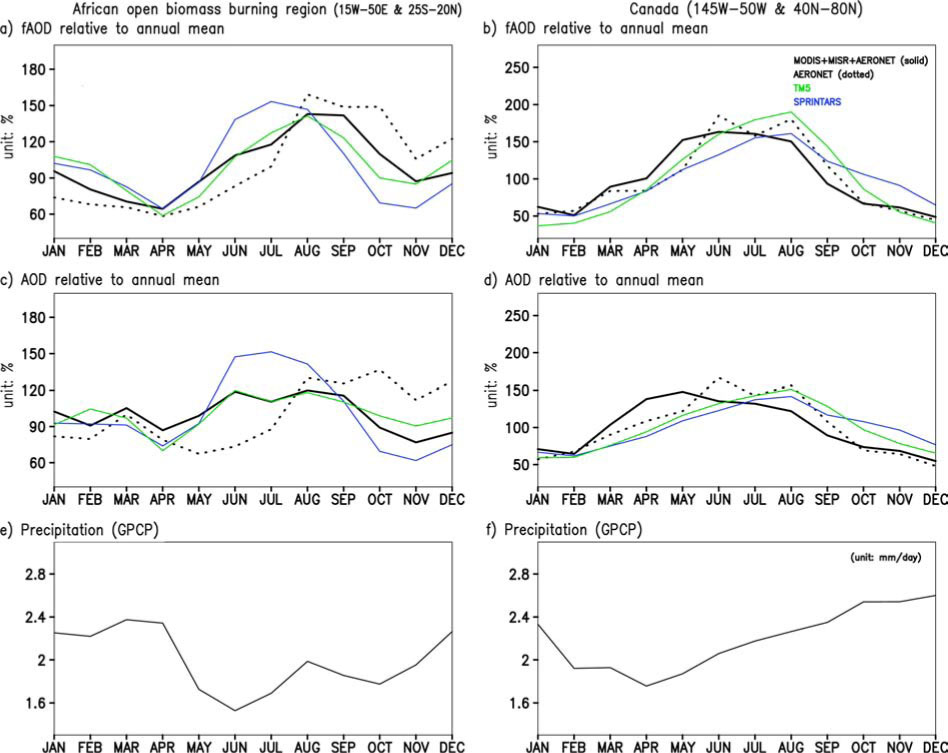
Fig. 6
2001–2008 climatological seasonal variation of fAOD, AOD and precipitation averaged over the African open biomass burning region (defined here as 15°W–50°E & 25S°–20°N) and Canada (145°–50°W & 40°–80°N).
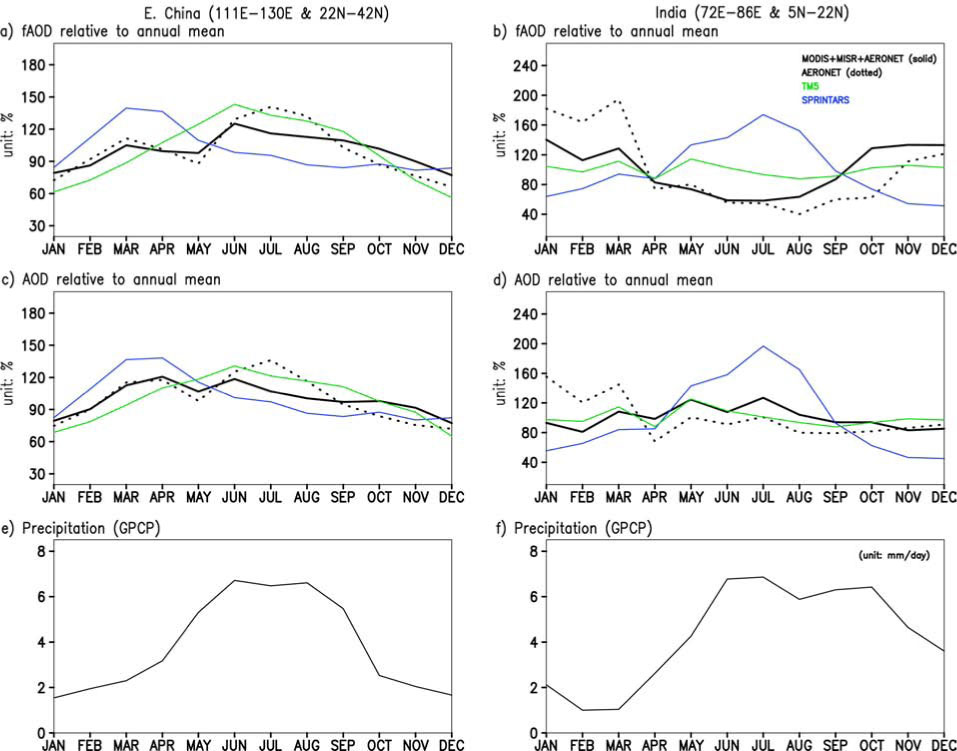
Fig. 7
2001–2008 climatological seasonal variation of fAOD, AOD and precipitation averaged over the eastern part of China (defined here as 111°–130°E & 22°–42°N) and India (72°–86°E & 5°–22°N).
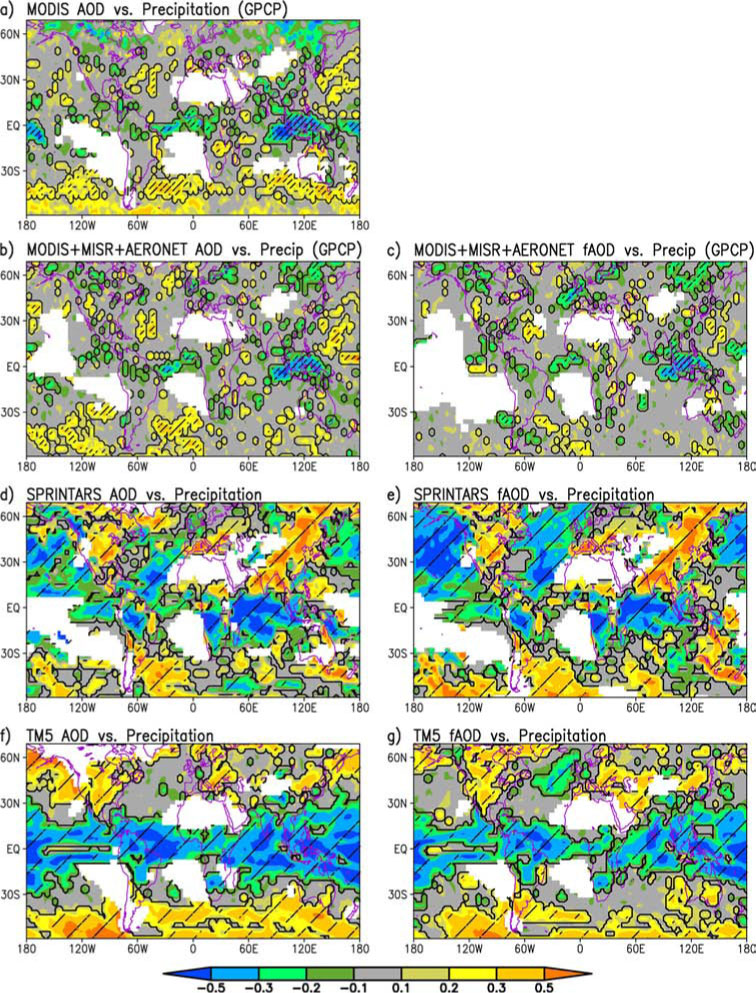
Fig. 8
Interannual correlation between AOD (or fAOD) and precipitation. Here, interannual correlation refers to the correlation with the variability other than climatological seasonal variation. Detrended data are used for the analysis. See Table 1 for the period used for each dataset. The mask-out threshold values are: 2e-04 (MODIS AOD), 2e-04 (MODIS + MISR + AERONET AOD), 5e-05 (SPRINTARS AOD), 2e-05 (TM5 AOD), 1e-04 (MODIS + MISR + AERONET fAOD), 1e-05 (SPRINTARS fAOD), 1e-06 (TM5 fAOD) and 0.05 (mm/day) (precipitation). Data corresponding to MODIS data gaps are also masked out. Correlation values in the hatched area are considered statistically significant at the 95% level, using the Effective Sample Size t-test.
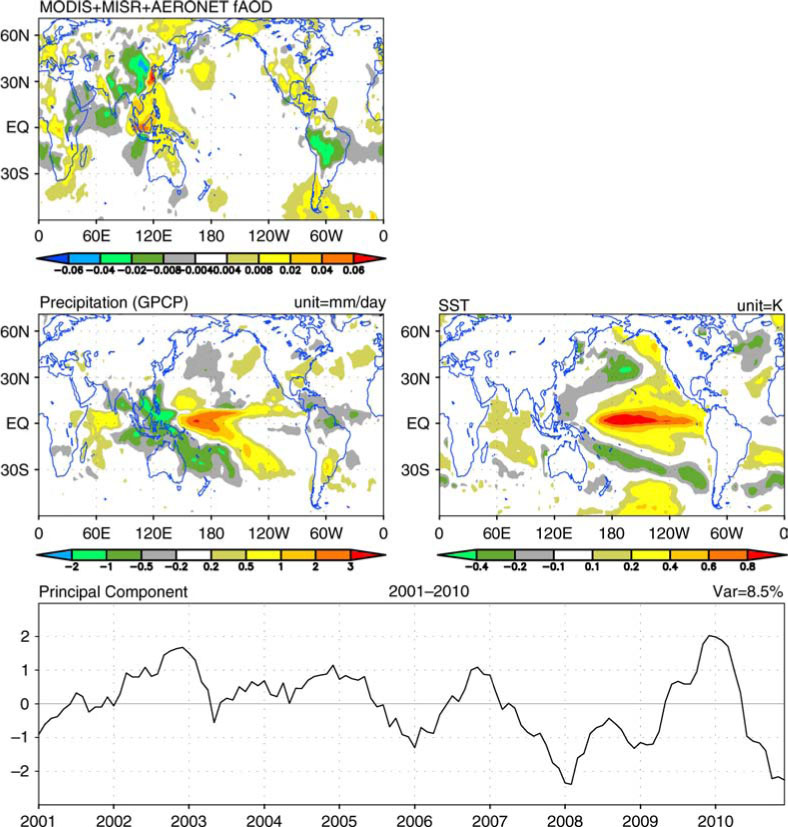
Fig. 9
Combined rotated principle component analysis (RPCA) of observed fAOD, GPCP precipitation and NOAA OI SST. Shown is the first mode.
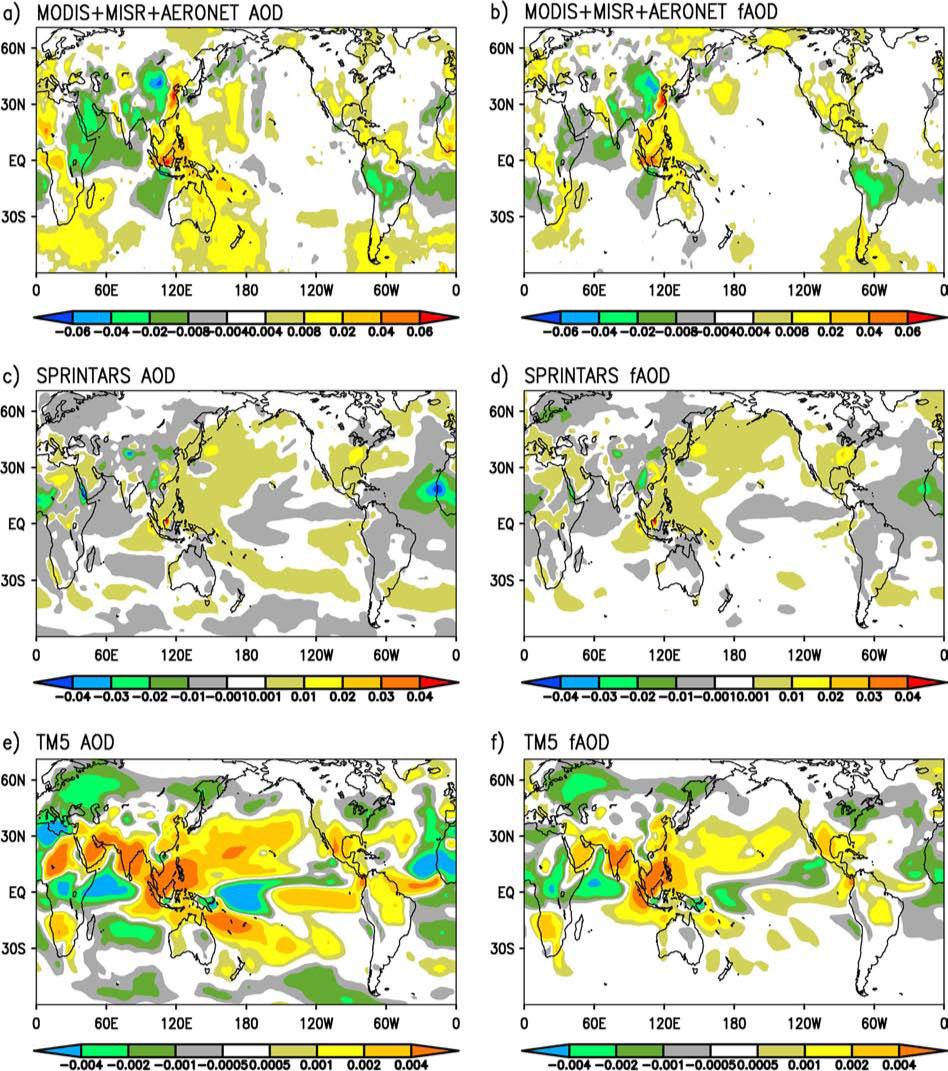
Fig. 10
ENSO mode (i.e. 1st mode) from a combined RPCA of fAOD, precipitation and SST. ENSO mode explains 7.9% of the total variance in SPRINTARS and 8.8% in TM5. AOD ENSO mode is obtained by linear regression with the 1st mode's principal component. Please note different colour schemes for different panels.