
Table 1. Full summary of land biogeochemistry models used by ESMs
CanESM 2.2CTEM/CLASS2.85°×2.77°NYNYCCSM4.2CLM 4.01.25°×0.94°NYYYIPSL-CM5A-LRORCHIDEE3.75°×1.89°NYNYIPSL-CM5B-LRMIROC-ESMMATSIRO/SEIB-DGVM2.81°×2.79°YNNYMIROC-ESM-CHEMNorESM1-MCLM 4.02.5°×1.89°NYYYNorESM1-ME
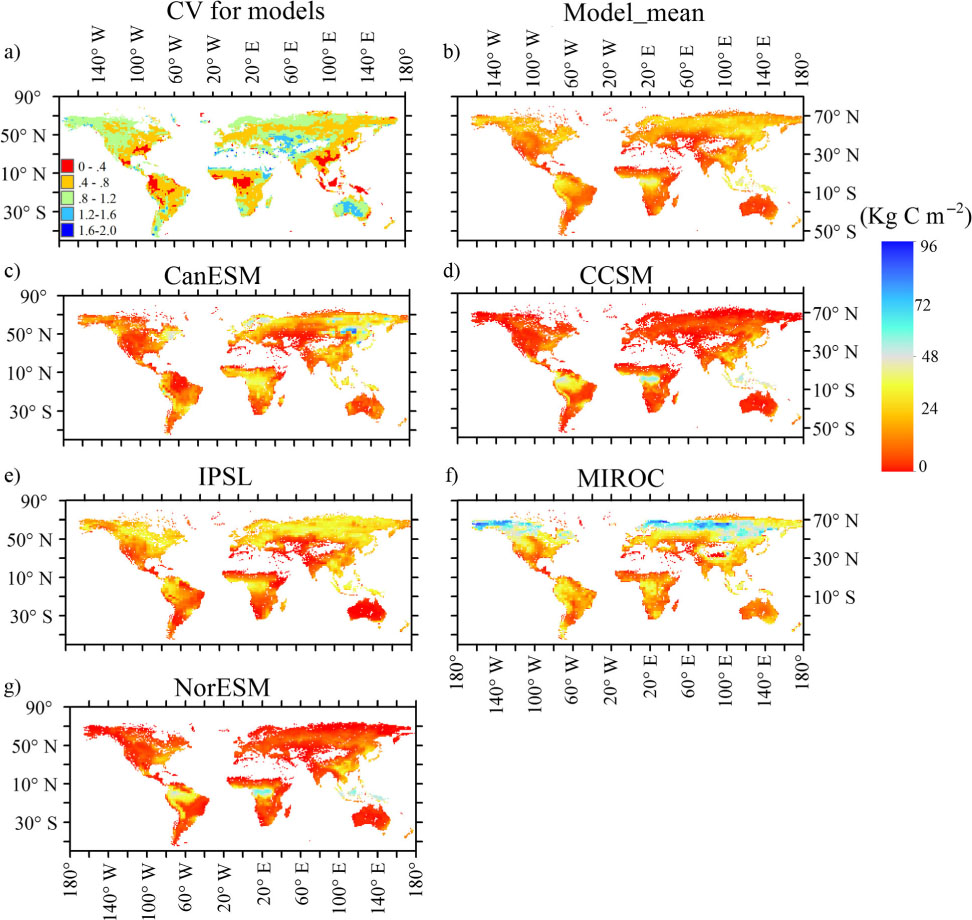
Fig. 1
The spatial pattern of ecosystem C storage capacity (NPP*MRTcor, kg C m−2) for the five models (modelled time: 1850–1860). Coefficient of variation (CV) was calculated for each grid cell using five models’ results.
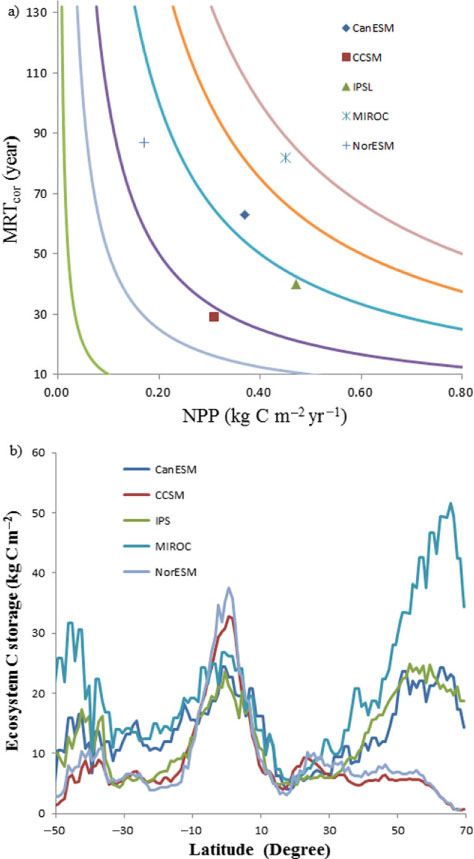
Fig. 2
The relationship between mean residence time (MRT, years) and net primary production (NPP, kg C m−2 yr−1) and the latitude pattern of ecosystem C storage capacity (NPP*MRTcor) for five models (modelled time: 1850–1860).
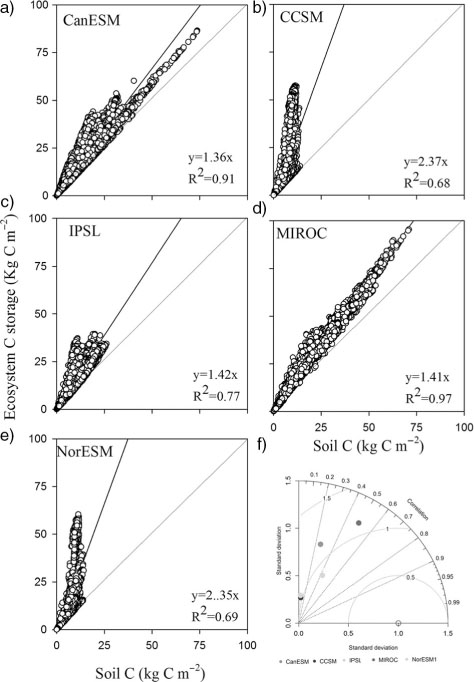
Fig. 3
The relationship between ecosystem C storage and soil C across models (a, b, c, d, e) and Taylor diagram for soil C storage at grid scale (f).
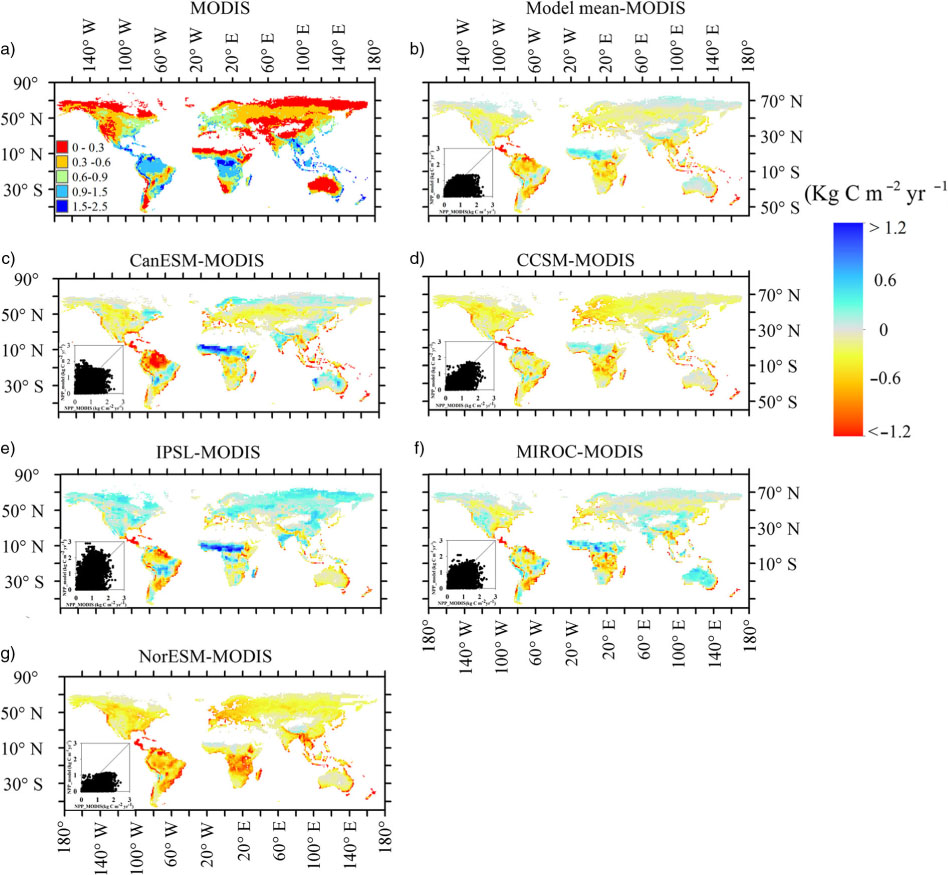
Fig. 4
Spatial pattern of net primary production (NPP, kg C m−2 yr−1) estimated from MODIS and the difference between five models and MODIS (modelled time: 1995–2005).

Fig. 5
Spatial pattern of the NPP/GPP ratio estimated from MODIS and the difference between five models and MODIS (modelled time: 1995–2005).
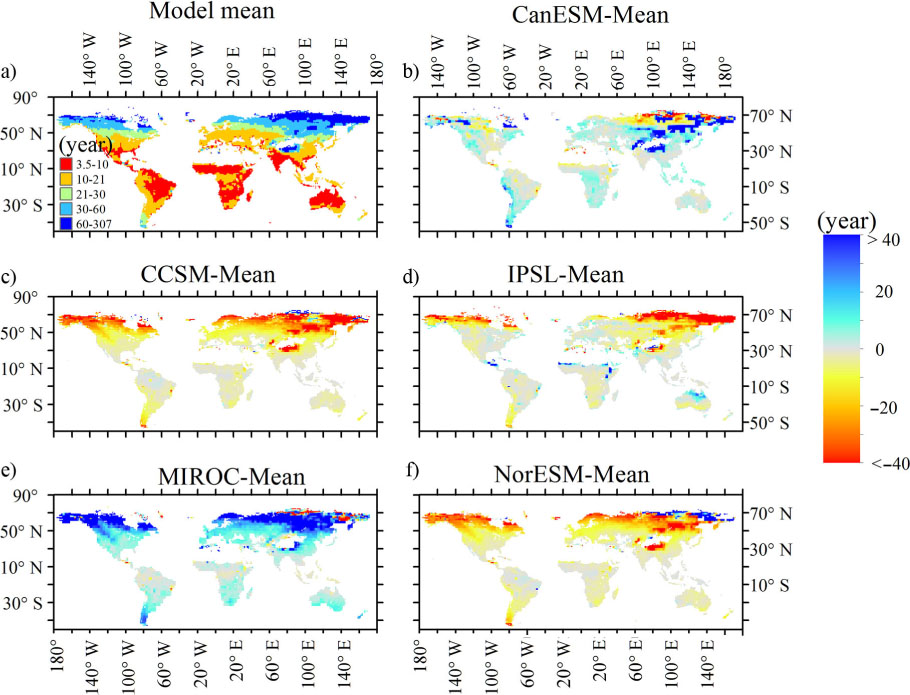
Fig. 6
Spatial pattern of average mean residence time (MRT, years) of ecosystem for five models and the difference between five models and the average of models (modelled time: 1850–1865).
Table 2. Effects of extreme data on ecosystem mean residence time (MRT) and the publication-based global average
CanESM36.4036.4CCSM23.020.814.5IPSL33.410.421.3MIROC132.630.544.6NorESM123.020.0718.0Based on soil respiration measurement32 Raich and Schlesinger (1992)Based on 13C measurement29Randerson et al. (1999)44Ciais et al. (1999)Models37–60Meyer et al. (1999)
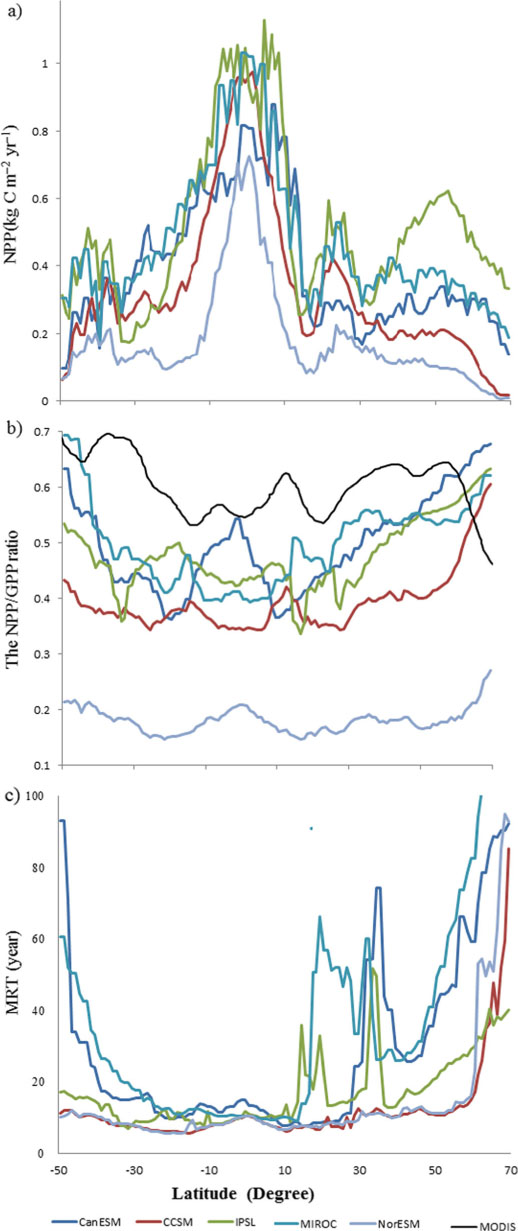
Fig. 7
The latitude pattern of NPP, the NPP/GPP ratio and mean residence time (MRT) for five models (each point representing the average over one latitudinal zone). The Data of MODIS was got from Zhang et al. (2009), which is the central tendency produced by average over 5° latitude.
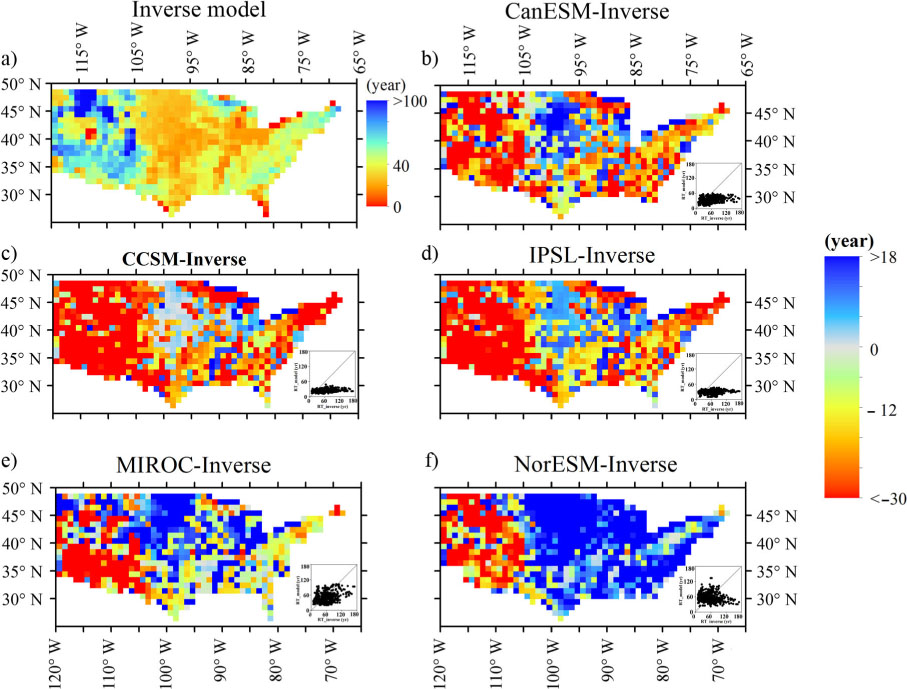
Fig. 8
Spatial pattern of mean residence time (MRT) of ecosystem in the USA from inversed models (Zhou and Luo, 2008; Zhou et al., 2012) and the difference between five models and the estimates of inverse models.
Table 3. Comparison NPP, NPP/GPP and mean residence time (MRT) in the USA and Australia between model-based and publication-based
Model1850–18601995–2005NPP/GPPMRT cor (year) (USA)MRT cor (year) (Australia)Reference
CanESM0.370.420.533426CCSM0.310.340.422418IPSL0.470.540.52299MIROC0.450.490.524930NorESM10.170.180.185540Inverse model46Zhou and Luo (2008)**Inverse model56.8±8.8 Zhou et al. (2012) VAST1.1 with genetic algorithm78 Barret (2002)**MODIS-based0.475 (±0.375) (2000–2005) Zhao and Running (2010)
MODIS-based0.55 (2000–2003)0.5 (2000–2003)Zhang et al. (2009)
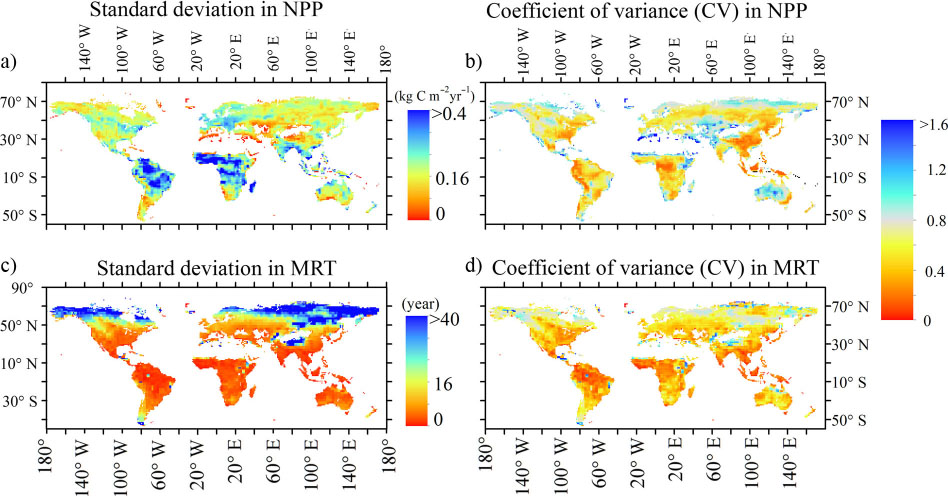
Fig. 9
Spatial pattern of coefficient of variation (CV) and standard deviation (SD) of NPP and MRT for all five models (modelled time: 1850–1860).