

Fig. 1
Locations of (a) CHNIP stations and (b) GNIP stations.
Table 1. Descriptive statistics of precipitation isotope values of CHNIP stations
StationLon(°)Lat (°)Alt (m)Pa (mm)Ta (°C)δDpbMinMaxSDδ18ObMinMaxSDrδ-Trδ-PSlopeInterceptST
Northeastern region (NE)
SJ (Sanjiang)133.347.35554632.8−80.1−207.3−38.347.13−10.42−28.21−4.746.360.588**0.4257.29−6.718.79 HL (Hailun)126.9347.452364692.5−92.8−229.6−50.152.92−12.52−29.47−6.856.830.781**0.418*7.712.588.70 CB (Changbaishan)128.1142.4738.17033.8−74.7−193.8−9.735.02−8.56−22.333.105.020.542**0.265*6.40−22.048.78North China (NC)
SY (Shenyang)123.3741.52495548.5−62.7−120.4−13.024.35−8.95−17.23−0.533.530.230−0.2046.25−5.768.70 BJ (Beijing)115.4339.9612484675.3−69.6−190.5−30.640.39−9.16−24.33−4.634.920.814**0.501**7.943.928.77 YC (Yucheng)116.5736.832253613.3−54.2−150.8−6.328.78−6.36−19.07−0.513.710.1100.0187.53−6.568.54 CW (Changwu)107.6835.24120045710.3−55.9−91.717.631.04−7.35−11.683.454.620.137−0.2916.50−6.688.67 FQ (Fengqiu)114.3335.0167.551514.0−57.3−103.4−9.924.74−7.37−14.381.053.78−0.280−0.4426.24−9.198.50Southern China (SC)
CS (Changshu)120.4231.333.194417.0−45.0−75.0−10.617.78−6.75−9.58−3.011.89−0.623**−0.2958.7713.968.48 TY (Taoyuan)111.4428.93106138217.3−34.7−86.81.822.99−5.93−11.87−2.122.56−0.045−0.609**8.6317.108.55 YT (Yingtan)116.5628.1245173618.4−45.0−103.5−6.720.98−5.59−12.90−1.325.60−0.148−0.0986.41−8.258.41 HT (Huitong)109.6126.8554196816.7−36.9−93.314.825.31−5.88−11.86−1.142.96−0.212−0.650**8.0811.478.55 QY (Qianyanzhou)115.0326.4476.4138317.9−35.4−74.4−1.120.04−4.54−8.350.382.48−0.299−0.1717.34−1.988.50 HJ (Huanjiang)108.3324.74400141719.3−38.7−81.416.132.43−6.16−11.42−0.583.63−0.679*−0.3658.8917.318.43 DH (Dinghushan)112.5523.1690180522.2−25.9−65.836.728.84−2.75−9.567.334.25−0.523*−0.558*6.53−8.358.39 YG (Yanting)105.4631.2742084116.6−42.6−91.045.440.55−5.55−12.369.155.68−0.360−0.3506.77−2.308.50 AL (Ailaoshan)101.0324.552481148411.6−86.9−123.34.140.11−12.19−16.41−0.024.93−0.620**−0.632**8.0911.948.37 BN (Xishuangbanna)101.2621.93560137122.4−45.0−68.4−21.816.74−6.94−9.74−3.442.27−0.367−0.1367.827.008.25Northwestern China (NW)
FK (Fukang)87.9344.294601677.5−67.6−183.4−15.154.07−9.87−24.64−2.066.790.891**0.310*7.838.868.70 CL (Cele)80.7337.0213065112.9−4.2−87.427.340.37−1.47−12.202.805.310.674*0.2577.546.878.97 LZ (Linze)100.1339.3513751279.0−36.1−175.81.863.15−6.21−24.421.608.150.910**0.3467.512.768.90 SP (Shapotou)10537.28135012610.9−52.6−90.721.828.18−7.16−12.843.324.040.397*−0.3307.11−1.168.67 AS (Ansai)109.3236.86108346010.1−58.2−106.825.227.42−8.11−14.814.413.730.202−0.307*7.06−0.628.66 ED (Erdos)80.7337.0213062796.9−43.8−85.522.029.54−6.06−10.873.814.050.353−0.4107.12−0.238.92 NM (Naiman)120.742.9337.282897.1−67.1−213.0−34.539.39−8.65−26.04−4.255.030.772**0.3627.71−1.288.71Tibetan Plateau (TP)
LS (Lhasa)91.2129.4136884078.5−110.9−169.938.553.20−15.02−22.650.266.52−0.287−0.2548.0410.868.30 HB (Haibei)101.3137.563280458−0.1−56.2−133.3−6.935.38−8.10−17.20−1.404.520.430*0.2097.624.659.12 MX (Maoxian)103.931.718267199.7−49.5−83.38.524.37−7.77−11.980.313.16−0.088−0.2017.568.198.76 GG (Gonggashan)10229.58295017045.1−76.5−147.81.430.86−10.82−19.50−2.353.73−0.496**−0.424**8.1012.568.73

Fig. 2
Distributions of (δs–δw) values. The δs and δw denote the un-weighted means of the summer (May–Oct.) and winter months (Nov.–Apr.), respectively. Group I, II and III all belong to the inner continental climate, indicating a major temperature contribution to the δ18O variation. Group IV and V are generally located in the middle and southeastern parts of China, and both the precipitation and temperature may contribute to the small (δs–δw) values. Group VI and VII distribute to latitude <30°N, and with a precipitation contribution.
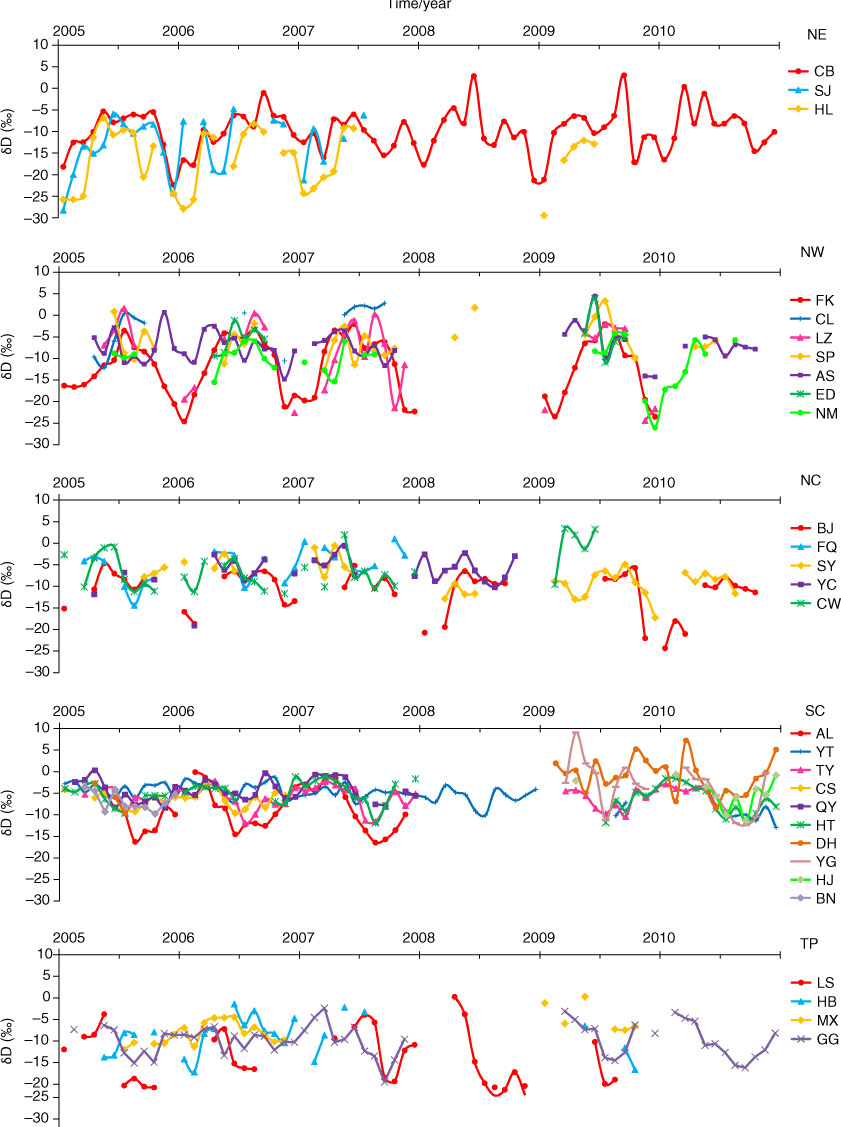
Fig. 3
Temporal variations of δ18O during 2005–2010. Large, small and mediate seasonal fluctuations of δ18O are found in the northern (NW and NE), southern (SC) and NC regions, respectively. A ‘V’-shaped δ18O pattern is found at SC, while a reverse ‘V’-shaped pattern is found at NE and NW.
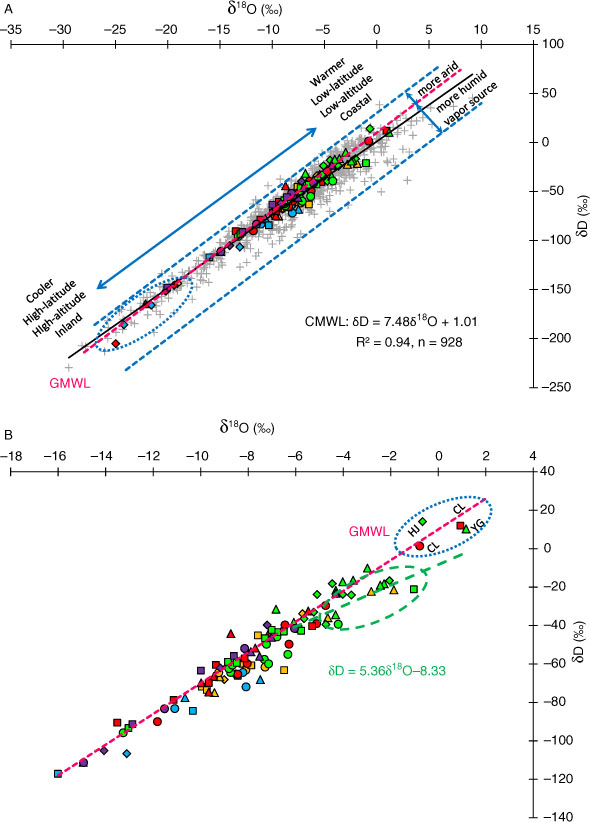
Fig. 4
Linear δD–δ18O relationships (CMWL) based on all the CHNIP precipitation measurements from 2005 to 2010 (grey crosses). Seasonal amount weighted δ-values (triangle–spring, circle–summer, rectangle–autumn and diamond–winter) of different regions (blue–NE, yellow–NC, green–SC, red–NW and purple–TP) are also given for reference. The arrows indicate potential vapour source conditions (McGuire and McDonnell, 2007).
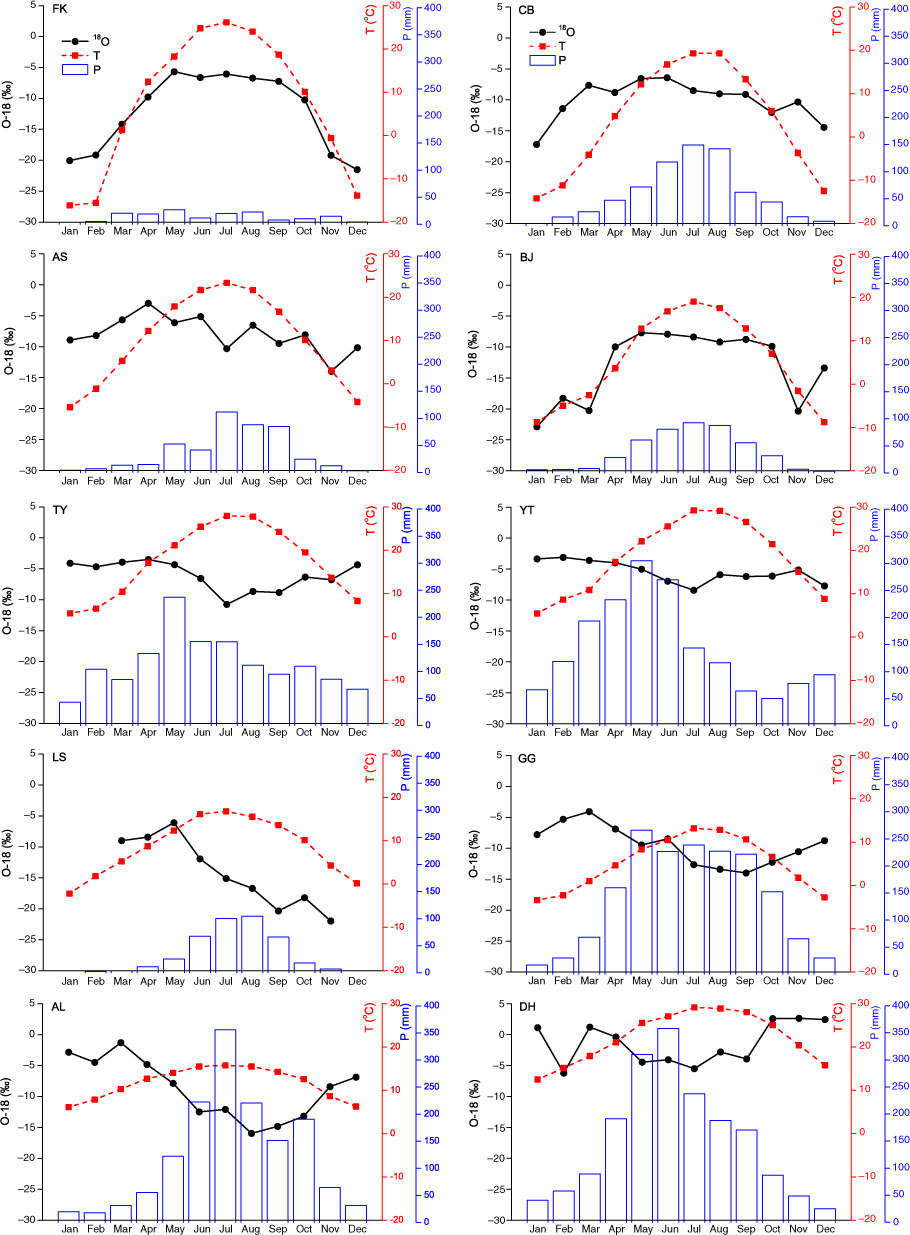
Fig. 5
Seasonal variations of δ18O (precipitation amount weighted), temperature and precipitation amount (averages during the respective observation period) for the 10 selected CHNIP stations. The seasonal effect is more pronounced for continental sites with strong temperature variations.
Table 2. Stepwise regression models for CHNIP stations
NESJδ18O=−13.379+0.239T0.3110.005HLδ18O=−16.876+0.331T0.5960.000CBδ18O=−7.559+0.469T−0.549Wp0.3490.006NCSYδ18O=−99.930−0.003Wd2+0.986Wd0.2100.015BJδ18O=−10.417+0.747T−0.025Wp2−0.035S0.7070.050YCδ18O=−20.479+0.084Wd0.2310.007CWδ18O=253.076−0.002RH2−0.285Vp0.5300.029FQδ18O=2.552−0.001RH20.1830.055SCCSδ18O=−7.564−0.006T2+0.023S0.5860.011TYδ18O=2045.727−681.929logVp−0.013Wp20.5860.001YTδ18O=−4.138−0.018S+1.963Ws2−0.008P0.1580.027HTδ18O=1848.366−0.015Wp2−620.738logVp0.5410.028QYδ18O=3170.993−0.015Wp2−1055.79logVp0.2880.012HJδ18O=2.783−0.059S0.5190.017DHδ18O=−3629.392+1209.223logVp0.3520.002YGδ18O=−3.218+0.06T2−0.065Wp20.4190.025ALδ18O=−12.074−0.518Wp+0.035Wd+0.031S0.7510.040BNδ18O=−11.788+0.0002Wd20.3450.043NWFKδ18O=−8.805+0.220T−0.001RH20.8100.016CLδ18O=−1252.324+0.037T2+1.436Vp−(9.133×10−5)Wd20.8950.016LZδ18O=−16.841+0.609T0.8220.000SPδ18O=−16.582+10.146logT−0.092P0.3280.014ASδ18O=−1.991−0.033P+0.226T−0.107RH0.4250.013NMδ18O=−14.175+0.303T0.5590.000TPLSδ18O=−38.857+18.078Ws0.3680.000HBδ18O=−9.355+0.243T0.1460.040MXδ18O=36.879−0.090Wd−0.455RH+0.530T−0.029Wp20.7260.010GGδ18O=23.482−0.027Wp2−0.343RH0.4030.007
Table 3. Stepwise regression models for GNIP stations
NEQiqiharδ18O=−17.138+0.418T0.6060.000Haerbinδ18O=−18.614+0.039S0.2400.004Changchunδ18O=−11.847−0.007T2+0.309T0.8290.006NCTianjinδ18O=9.449−0.02P−0.012T2+0.520T+0.004RH2−0.590RH0.6130.035Shijiazhuangδ18O=−11.3−0.015T2+0.469T+(4.41×10−5)S20.2840.048Yantaiδ18O=24.571+0.006RH2−0.873RH0.2390.038Zhengzhouδ18O=−25.117+0.504Ws2+7.312logS0.1760.035Xianδ18O=0.122−0.001RH20.1590.001SCNanjingδ18O=1266.466−0.144RH−0.007Wp2−419.209logVp0.4030.027Wuhanδ18O=4163.429−0.017T2−1384.699logVp−0.013P0.4170.007Changshaδ18O=3742.282−0.02Wp2−0.001RH2−1242.53logVp0.5300.003Fuzhouδ18O=4078.656−0.013P−0.668T−1355.431logVp0.3510.001Zunyiδ18O=4109.289−0.954Wp−1384.216logVp0.6010.000Guiyangδ18O=3901.415−0.03Wp2−1322.441logVp+1.996logWd0.5760.023Guilinδ18O=2277.891−0.015T2−758.678logVp−1.445logP0.5710.046Liuzhouδ18O=3052.851−0.017Wp2−1016.873logVp0.4690.012Chengduδ18O=4970.782−0.023Wp2−1666.96logVp0.5530.000Kunmingδ18O=5.200−0.002RH2−0.287T+1.314Ws0.6450.011Guangzhouδ18O=0.078−2.403logP0.2370.008Haikouδ18O=−2075.433+684.554logVp−0.016Wd2+0.176RH0.5340.038NWBaotouδ18O=−22.627+0.057S0.3480.000Hetianδ18O=−4842.976+0.045T2+0.036Wd2+1640.639logVp0.7930.028Lanzhouδ18O=−13.705+0.447T0.4750.000Wulumuqiδ18O=−14.101+0.428T−0.146Wd0.7370.035Yinchuanδ18O=−11.567−0.019T2+0.631T0.4700.022Zhangyeδ18O=−2419.214+0.662T+820.415logVp0.7050.042TPLhasaδ18O=886.838−0.002Vp20.2830.001
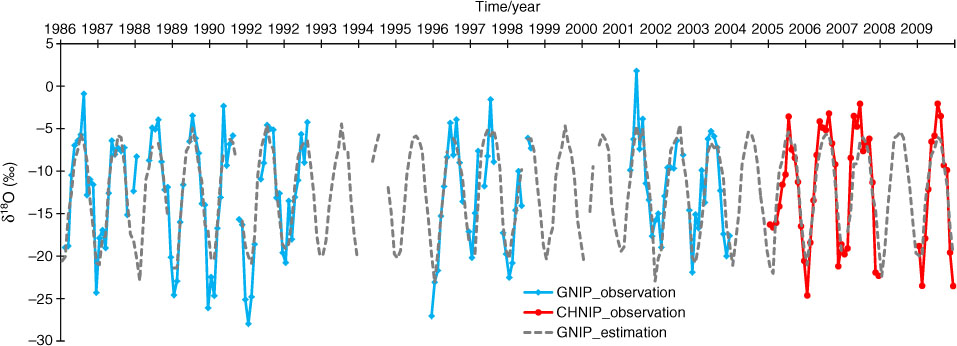
Fig. 6
Reconstruction of monthly δ18O time series for the period of 1986–2009, based on the regression model established for Wulumuqi station (δ18O=−14.101+0.428T−0.146Wd). With the exception of a few values during extreme cold and hot months, the reconstructions depict the seasonal cycle of δ18O. The calculated δ18O values for most spring and autumn seasons are very close to the observations.