
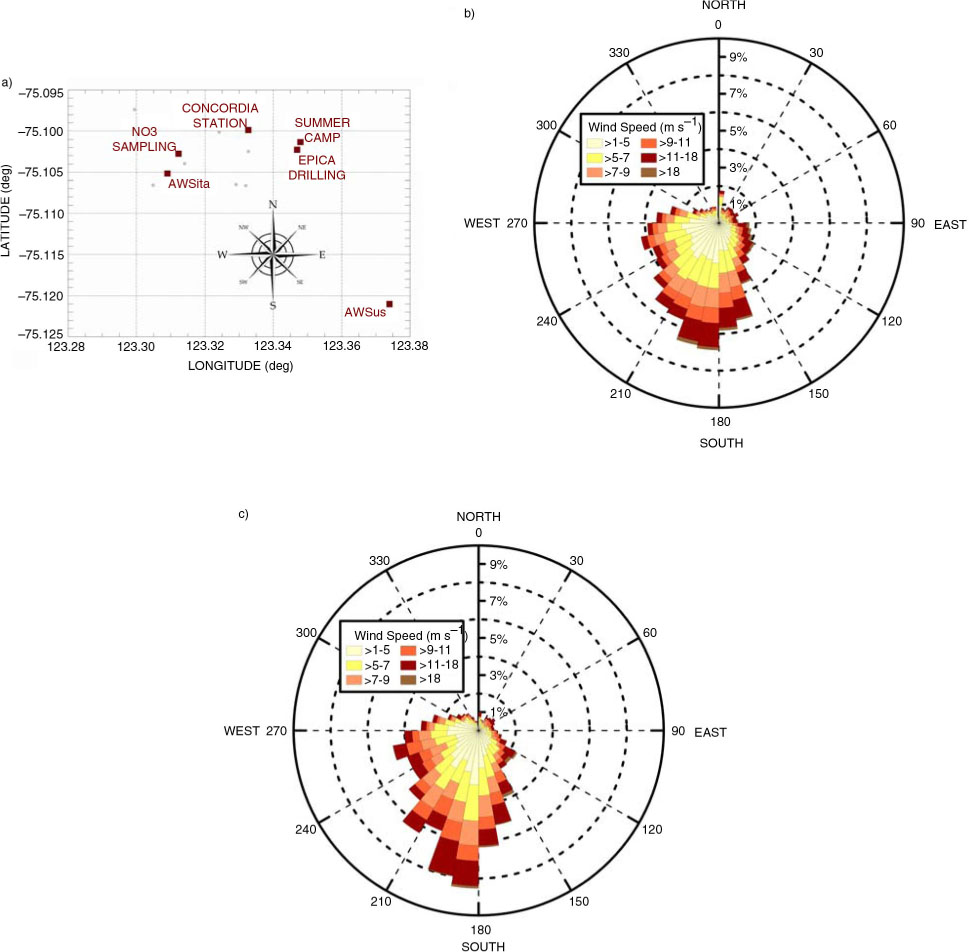
Fig. 1
(a) Map of Dome Concordia area. Large red filled squares represent: Italian Automatic Weather Station (AWSita), US–French Automatic Weather Station (AWSus), Concordia base, the Summer Camp, the EPICA drilling site and the site where the filter sampling station is placed. Small grey filled circles represent sampling sites for other disciplines near the base. (b) and (c) Wind direction rose histogram divided for 1–5, 5–7, 7–9, 9–11, 11–18 and >18 m s−1 wind speed classes, based on Italian Automatic Weather Station (AWSita) hourly data sampled for (b) all 1/1/2005–1/1/2009 time periods, (c) only during November–December months.
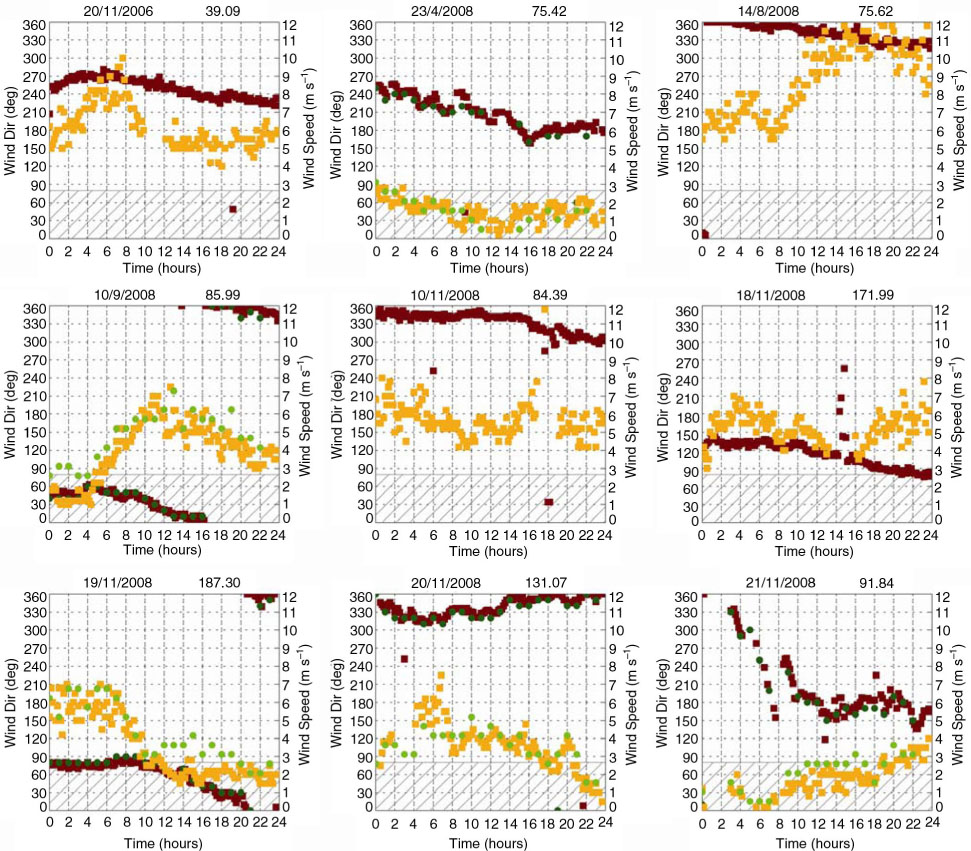
Fig. 2
Wind speed (dark red and dark green) and direction (orange and green) for AWSus (filled squares) and AWSita (filled circle) during daily time window when filter sampling is active. Each plot shows one of the eight events (the title of each plot reports time data and concentration values as ng m−3) for the 33 cases reported in the paper when AWSus measures a wind direction in the 0°–80° angle at least once (grey dashed area).
Table 1. Information on devices, sampling period, time resolution, aerosol size classes and kind of membranes used for the performed samplings
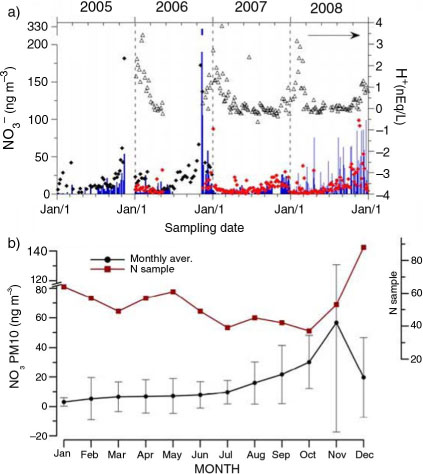
Fig. 3
Nitrate concentration in actual and reconstructed PM10 in the 2005–2008 period. Temporal profile of nitrate concentration in PM10 aerosol at Dome C in the 2005–2008 time period. (a) Original concentration values of actual PM10 (blue bars) and PM10 reconstructed by summing concentrations from 8-stage (black diamonds) and 4-stage (red diamonds) impactors, used for sampling in 2005–06 and 2007–08, respectively. (b) Monthly averages and related standard deviations of PM10 nitrate with the indication of sampling representativeness in each month (red squares).
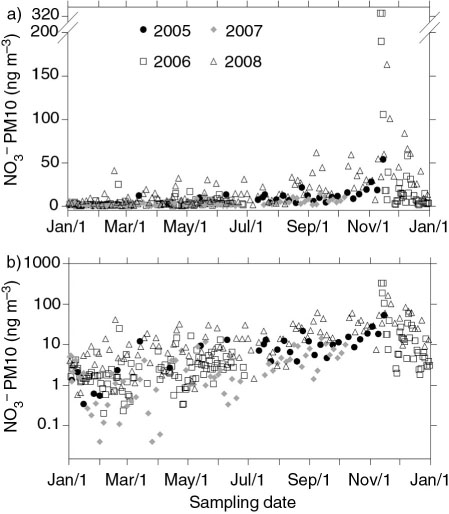
Fig. 4
Nitrate annual trend. Annual trend of PM10 nitrate superimposing all the different sampled years, with different symbols. In order to better appreciate the dynamic range of the concentration as well as the annual pattern, both a linear (a) and a logarithmic (b) scale were used.
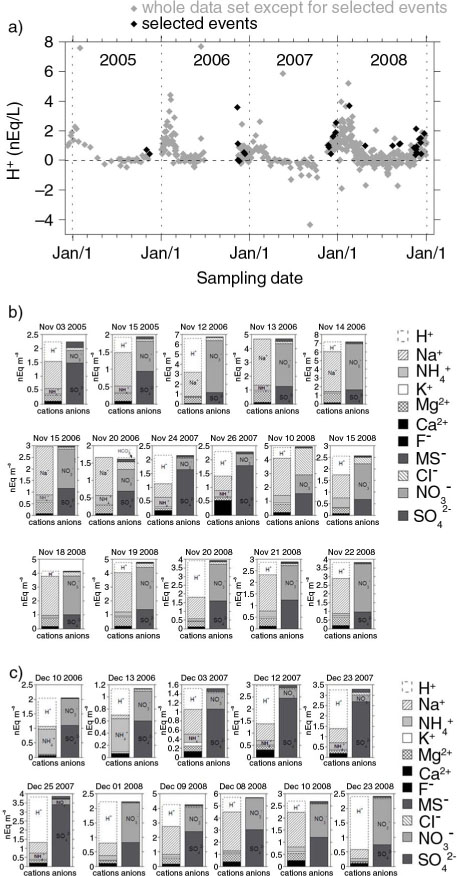
Fig. 5
Free acidity and ion balances of the selected nitrate events. (a) Temporal profile of the free acidity, expressed as nEq/L in the whole sampling period. Black filled diamonds refer to the events showing a concentration of nitrate higher than the 95th percentile while the grey filled diamonds indicate all the remaining samples. (b) Ion balances of the selected nitrate events occurring during the month of November (16 events). (c) Ion balances of the selected nitrate events occurring during the month of December (11 events).
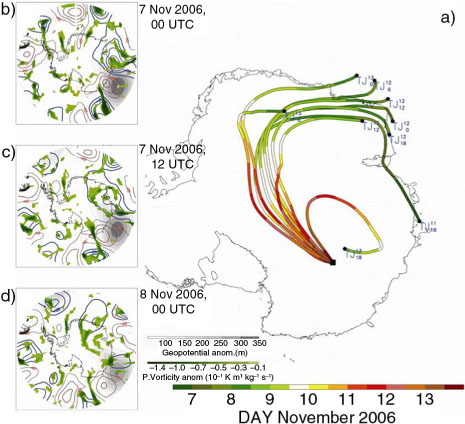
Fig. 6
Back trajectory analysis for the largest nitrate event. (a) 5-d back trajectories (TJ) starting from DC every 6 hours from 13 to 11 November 2006. Colour scale represents air mass position along the TJ's path during the same days. (b–d) Map of 5-d low pass filtered of positive anomalies of Geopotential at 500 hPa (shaded scale contour), 5-d low pass filtered of Potential Vorticity anomalies (green scale contour) and positive and negative 5-d high pass filtered of Geopotential 500 hPa (red and blue line respectively) during 7 Nov 2006 00 UTC, 7 Nov 2006 12 UTC and 8 Nov 2006 00 UTC respectively.
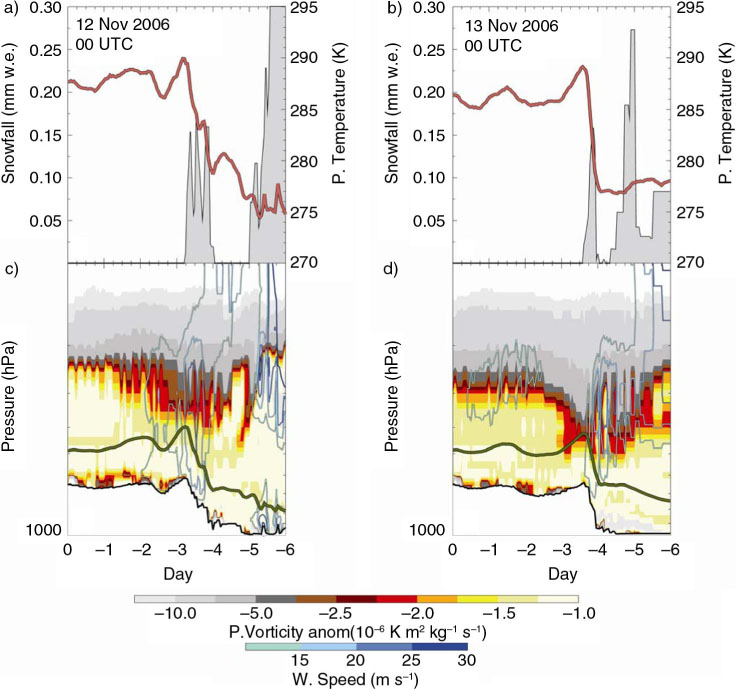
Fig. 7
Synoptical pattern analysis for the largest nitrate aerosol event. (a, b) Potential temperature (red line) and Snowfall (grey filled) values during 6 d back trajectories path starting from DC at 12 and 13 November 2006 00 UTC, respectively. (c, d) Potential vorticity (filled contour), wind speed (line contour) and surface (black line) cross-section along 6 d back trajectories path (green line) starting from DC at 12 and 13 November 2006 00 UTC, respectively.
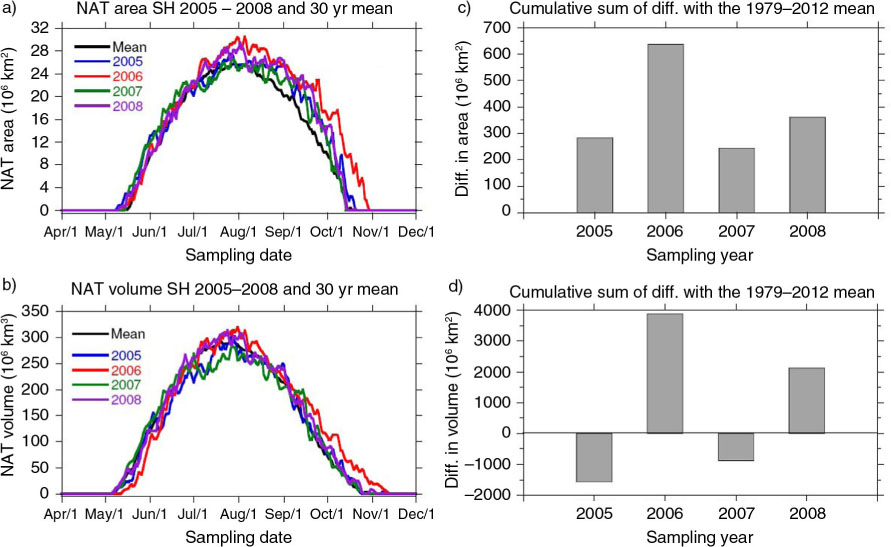
Fig. 8
NAT area and volume in the sampled years (rough data and yearly cumulative averages). Temporal profile of area (a) and volume (b) of nitric acid trihydrate (NAT) in Polar Stratospheric Clouds I (NASA Ozone Hole Watch website) in the time period covered by Dome C aerosol data (2005–2008). Different colours were used for the different single years while the same parameters, averaged in the 1979–2012, are reported in black. Cumulative difference of area (c) and volume (d) of NAT for each year with respect to the relative 33-yr mean.
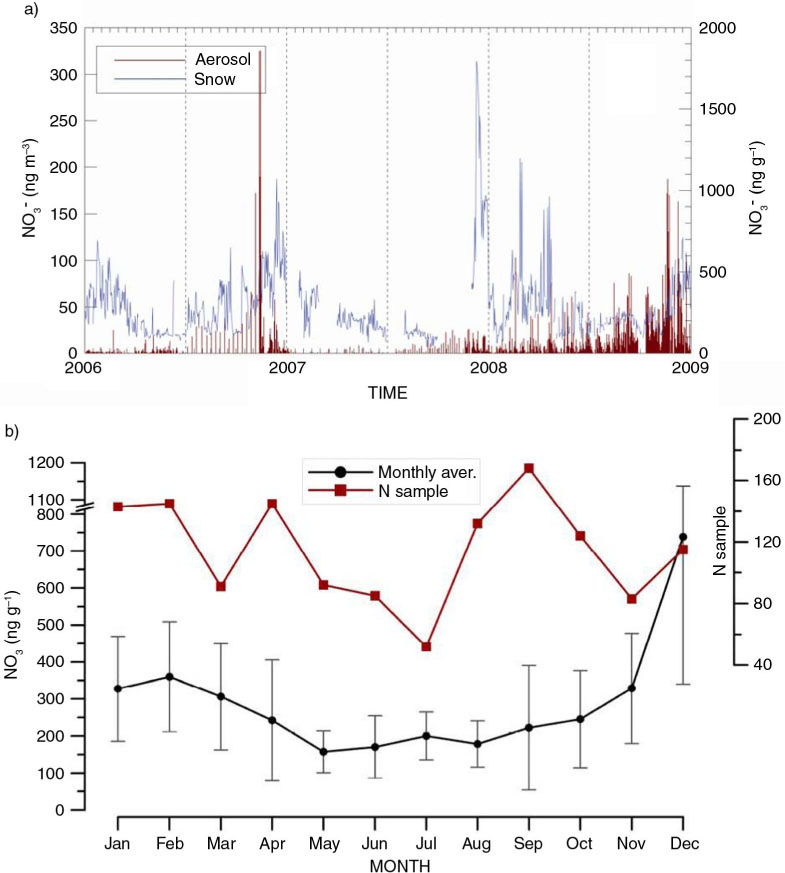
Fig. 9
Nitrate concentration in aerosol and snow. (a) Temporal profile of nitrate concentration in aerosol (red line) and surface snow (blue line) for the period covered by contemporaneous samplings (2006–09). (b) Monthly averages and related standard deviations of nitrate in surface snow with the indication of sampling representativeness in each month (red squares).