
Table 1. List of the carbon budgets and sources for each category of the fluxes (unit: GtC/yr)
SourcesCDIACGFED3Nassar et al. (2010)ECCO2-DarwinCASA/CASA-GFED3NetCarbon budget8.12.42.0−2.4−5.34.8
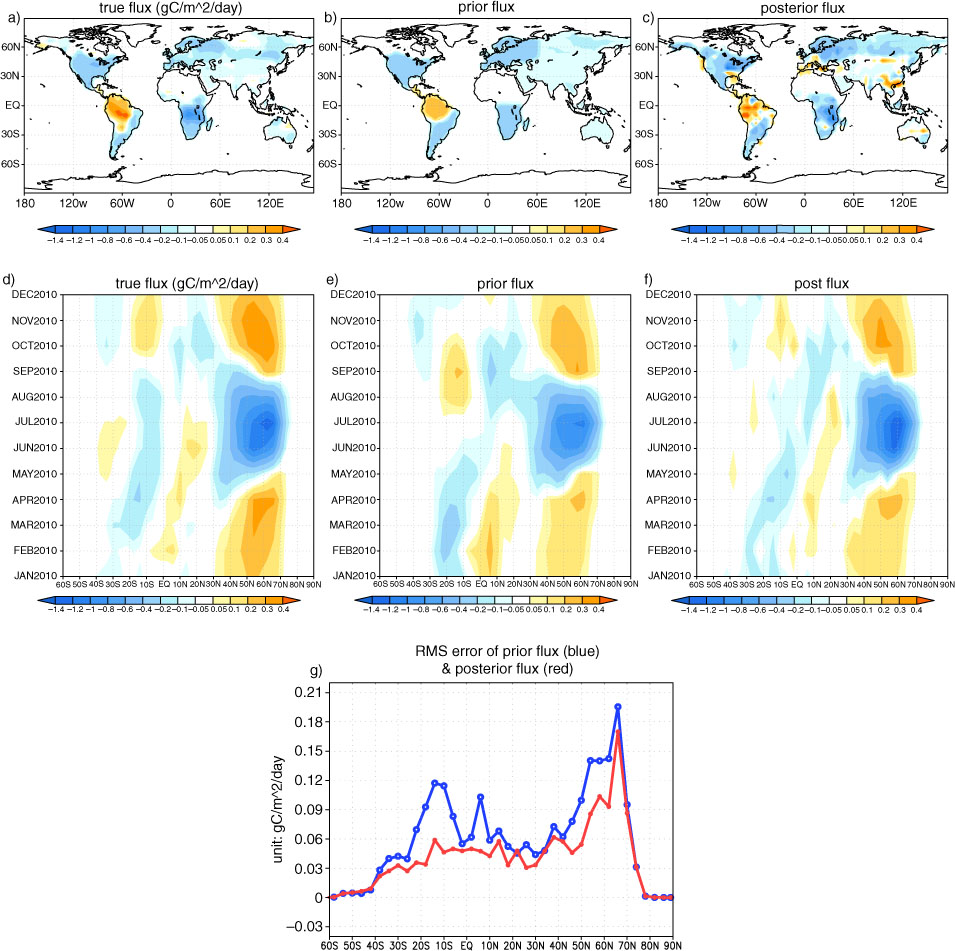
Fig. 1
The annual mean true flux (a), the prior flux (b) and the posterior flux (c) from the control inversion; the zonal mean monthly flux for the truth (d), the prior flux (e) and the posterior flux (f); RMS error of the monthly zonal mean flux for the prior (blue) and the posterior flux (g). (Unit: gC/m2/d).
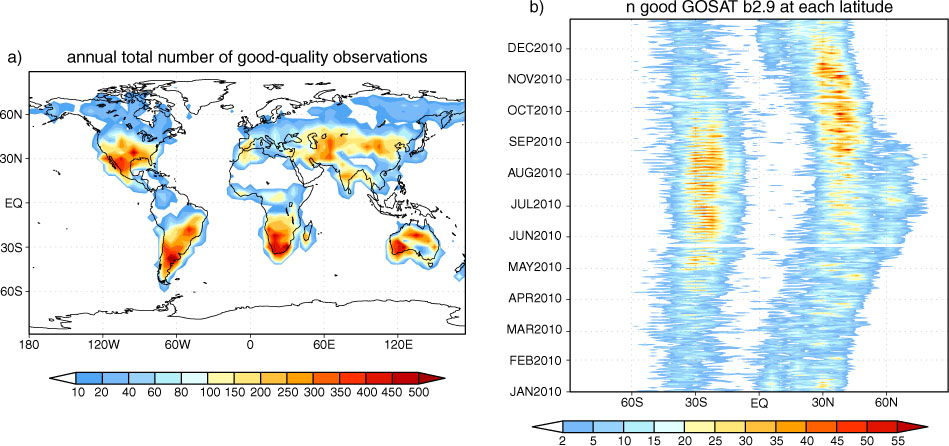
Fig. 2
(a) Total number of ACOS-GOSAT b2.9 good-quality observations at each 4°×5° grid point during 2010; (b) total number of daily ACOS-GOSAT b2.9 observations at each latitude as a function of time.
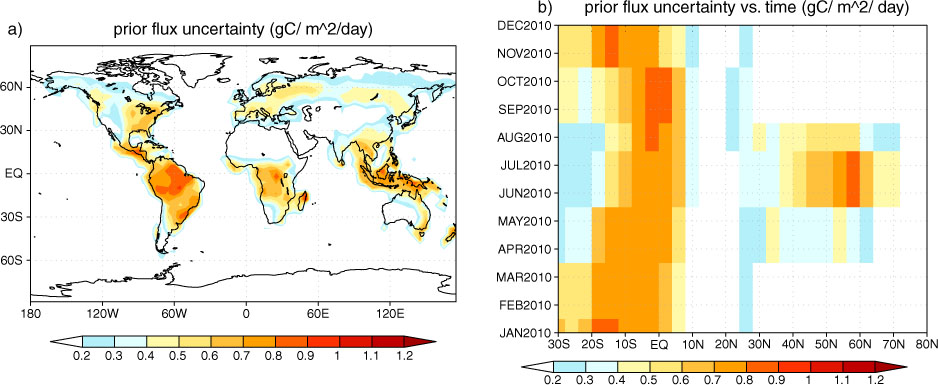
Fig. 3
(a) The annual mean prior flux uncertainty (unit: gC/m2/d) calculated from the monthly flux scale factor error statistics used in the inversion; (b) the monthly zonal mean prior flux uncertainty (unit: gC/m2/d).
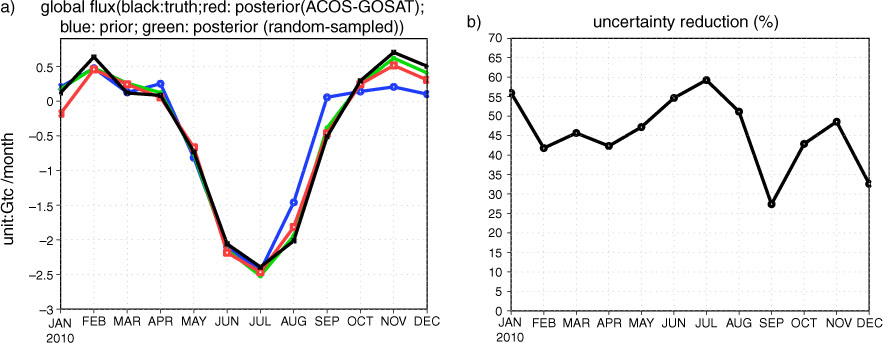
Fig. 4
(a) Global CO2 flux seasonal cycle (black: the truth; blue: the prior flux; red: the posterior flux assimilating ACOS-GOSAT XCO2 ; green: the posterior flux assimilating random-sampled XCO2 . Unit: GtC/month). (b) Global total flux uncertainty reduction as a function of month.
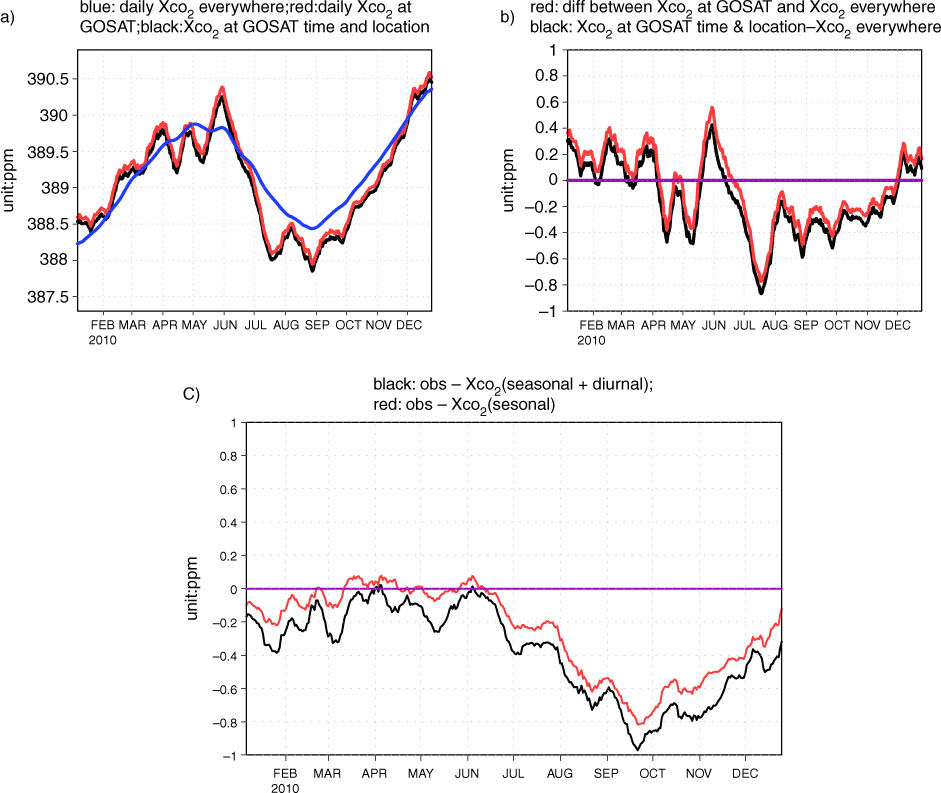
Fig. 5
(a) Comparison of XCO2 (unit: ppm) from nature run sampled with different sampling strategies. Blue: daily averaged XCO2 sampled at every grid point every 3 hours; red: daily averaged XCO2 sampled at the ACOS-GOSAT locations every 3 hours; black: XCO2 sampled at the ACOS-GOSAT locations and observing time. (b) Red: the difference between XCO2 sampled at the ACOS-GOSAT locations and the XCO2 sampled everywhere; black: the difference between XCO2 sampled at the ACOS-GOSAT locations and observing time and the XCO2 sampled everywhere every 3 hours. (c) Black: the difference between the observations and the XCO2 forced by the prior flux used in the control inversion; red: the difference between the observations and the XCO2 forced by the flux with the same diurnal cycle as the true flux but with the same seasonal cycle as the prior flux used in the control inversion.
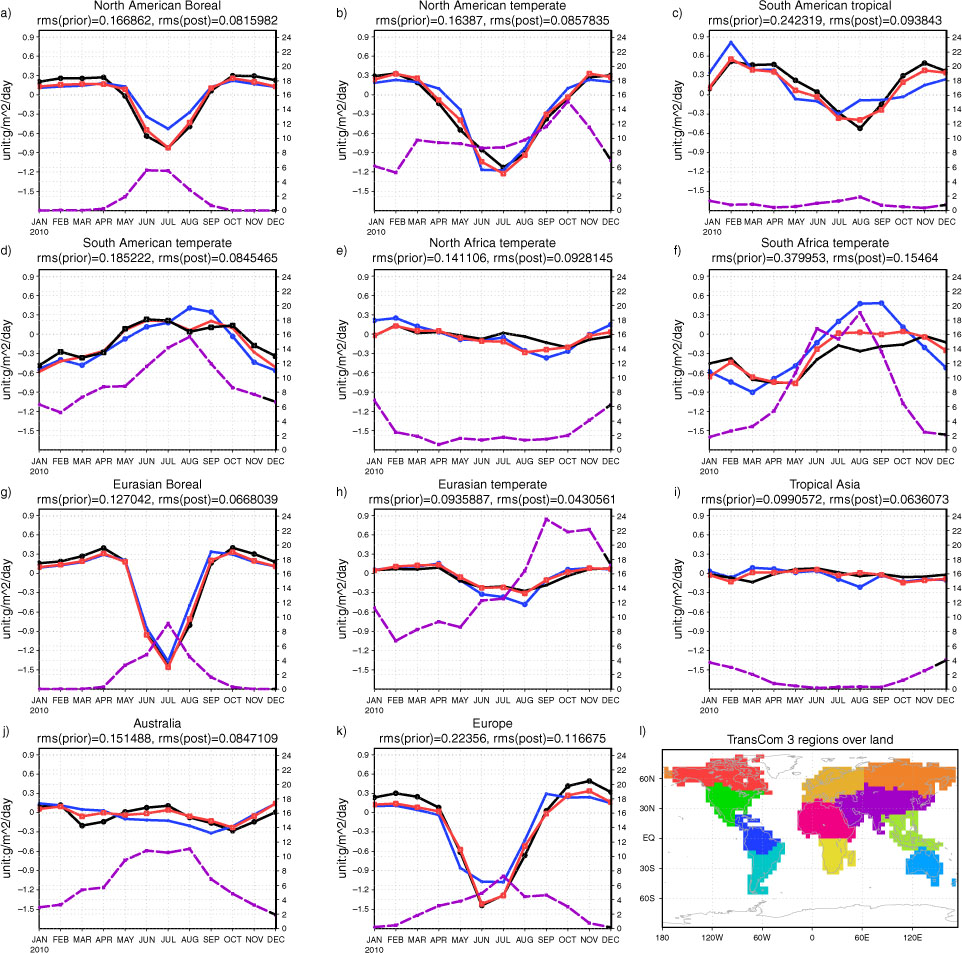
Fig. 6
Flux seasonal cycle comparison among the truth (black), the prior flux (blue) and the posterior flux (red) at 11 TransCom regions over land; purple line is the total number of simulated ACOS-GOSAT observations at each region as a function of month (unit: 100, right y-axis); (a) North American Boreal; (b) North American Temperate; (c) South American Tropical; (d) South American Temperate; (e) Northern Africa; (f) Southern Africa; (g) Eurasian boreal; (h) Eurasian temperate; (i) Tropical Asia; (j) Australia; (k) Europe. On the top of each panel lists the RMS error of the prior flux (first number) and the posterior flux (second number). Unit: gC/m2/d; (l) the geographic boundaries of the 11 regions.
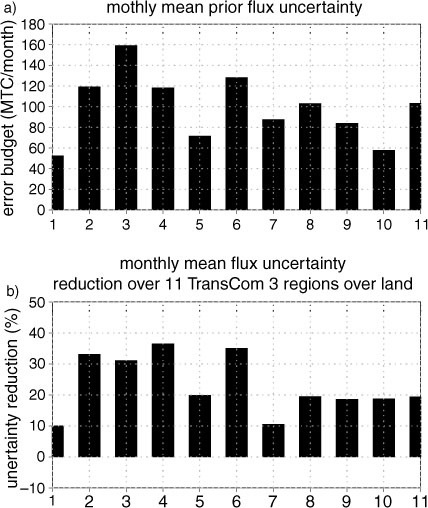
Fig. 7
Monthly mean prior flux uncertainty (a) and the uncertainty reduction at 11 TransCom regions over land (b). 1: North American Boreal; 2: North American Temperate; 3: South American Tropical; 4: South American Temperate; 5: Northern Africa; 6: Southern Africa; 7: Eurasian boreal; 8: Eurasian temperate; 9: Tropical Asia; 10: Australia; 11: Europe.
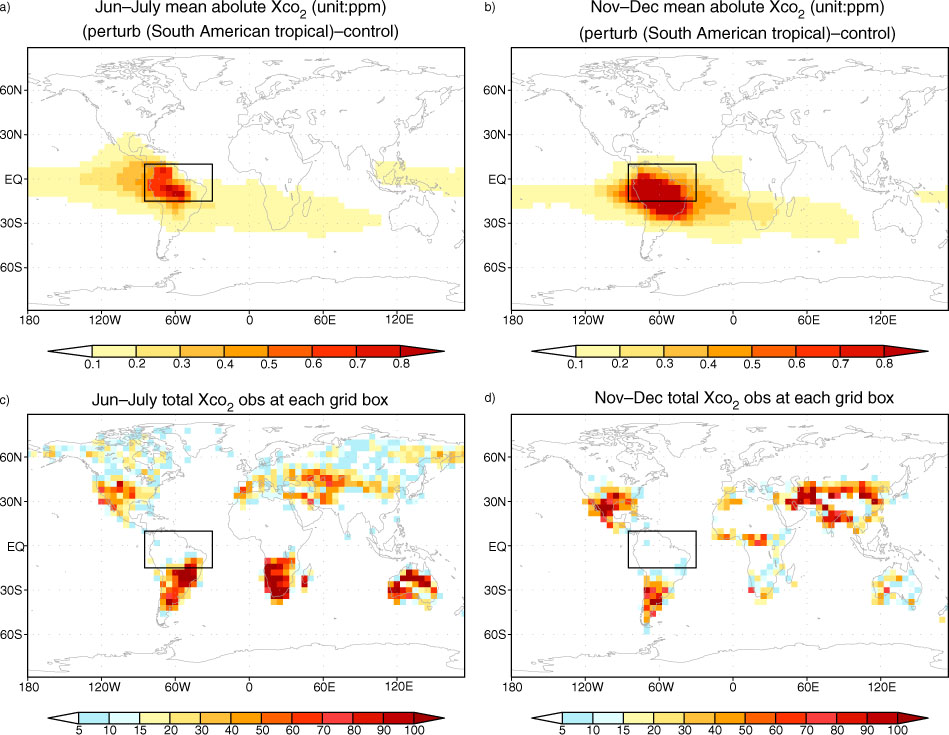
Fig. 8
The time averaged absolute XCO2 difference (unit: ppm) between the control run and a separate simulation where the surface flux is perturbed within the rectangle. The magnitude of this perturbation is equal to the difference between the control and nature run surface flux. (a) Averaged over June and July; (b) averaged over November and December. Total number of simulated ACOS-GOSAT observations at each grid cell for these two time periods. (c) June and July; (d) November and December.