
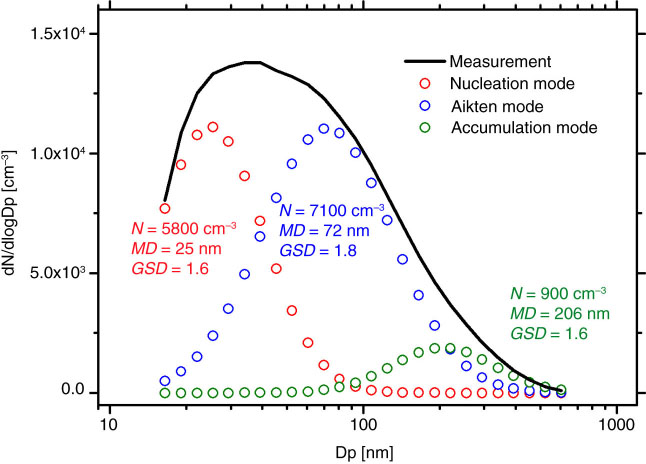
Fig. 1
The fitting result of the mean atmospheric particle number size distribution for the whole campaign period. The modal concentrations (N), median diameters (MD) and geometric standard deviations (GSD) for the nucleation (red), Aitken (blue) and accumulation (green) modes are also shown.
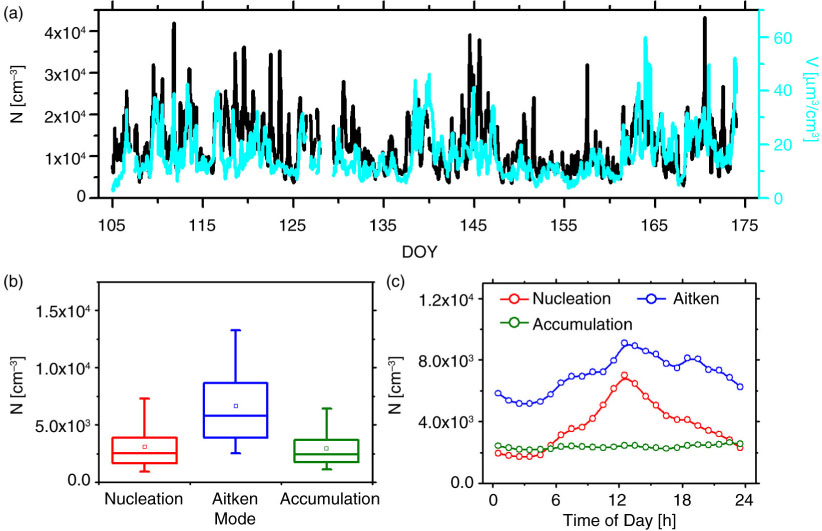
Fig. 2
(a) Temporal series of the total particle number (black line) and volume (Cyan line) concentrations; (b) box plot of number concentrations for nucleation, Aitken and accumulation modes particles; the upper and lower boundaries of boxes indicate the 75th and 25th percentiles; the line within the box marks the median; the whiskers above and below boxes indicate the 95th and 5th percentiles; and square symbols represent the means; (c) diurnal variation of three modes particles.
Table 1. Comparisons of the size-resolved particle number concentrations over China
ShanghaiApr.–June 2010Urban3100 (16–30)6700 (30–100)2900 (100–600)12 700 (16–600)This workShanghaiOct. 2008–Feb. 2009Urban1000 (10–20)8200 (20–100)3500 (100–1000)12 700 (10–1000)Du et al. (2012)BeijingMar. 2004–Mar. 2006Urban9000 (3–20)15 900 (20–100)7800 (100–1000)32 800 (3–10 000)Wu et al. (2008)GuangzhouJuly 2006Urban–––29 000 (20–10 000)Yue et al. (2010a)NanjingNov. 2011–Mar. 2012Suburban6700 (6–25)9500 (25–90)7100 (90–800)23 300 (6–800)Herrmann et al. (2014)LanzhouJune–July 2006Suburban4500 (10–20)3600 (20–100)500 (100–500)8600 (10–500)Gao et al. (2011)TaicangMay 2005Suburban16 000 (10–20)13 000 (10–100)1700 (100–500)30 200 (10–500)Gao et al. (2009)YufaAug.–Sept. 2006Rural2000 (3–20)9000 (20–100)5000 (100–1000)17 000 (3–10 000)Yue et al. (2009)XinkenOct.–Nov. 2004Rural/coastal–––16 300 (3–10 000)Liu et al. (2008)ShangdianziMar. 2008–Aug. 2009Background3600 (3–25)4400 (25–100)3500 (100–1000)11 500 (3–10 000)Shen et al. (2011)Yellow seaMar. & May 2005Marine4000 (3–10 000)Lin et al. (2007)WaliguanSept. 2005–May 2007Mountain/background600 (12–21)1100 (21–95)400 (95–570)2000 (12–570)Kivekas et al. (2009)
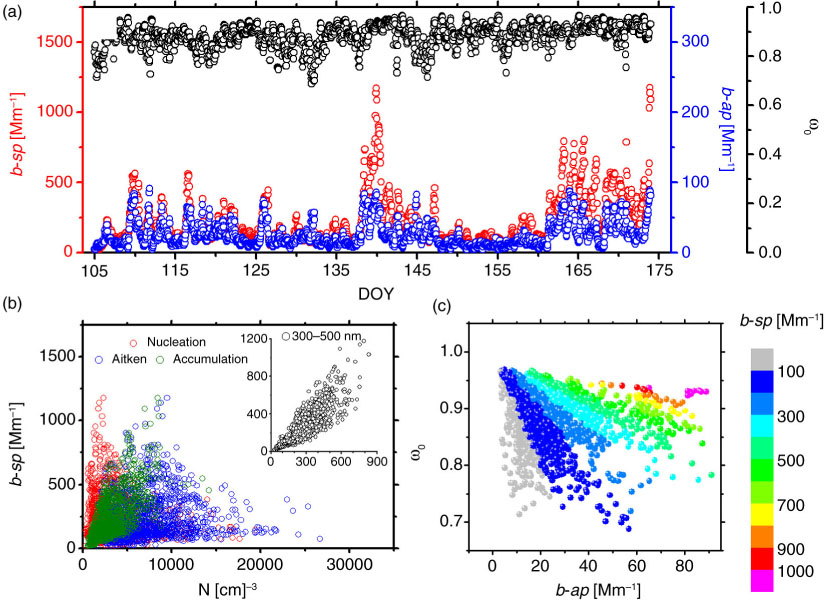
Fig. 3
(a) Temporal series of the atmospheric aerosol light-scattering coefficients (b-sp), absorption coefficients (b-ap) and single scattering albedo (ω 0) at 532 nm; (b) correlations between scattering coefficients and number concentrations of particles in different size ranges; (c) relationship between absorption coefficient and single scattering albedo, the colour bar represents the scattering coefficients.
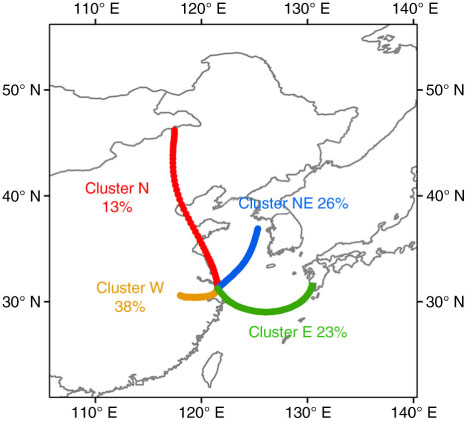
Fig. 4
Mean back trajectories for four trajectory clusters arriving at measurement site during the sampling period. The directions of four trajectory clusters are North (N, red), Northeast (NE, blue), East (E, green) and West (W, orange), respectively.
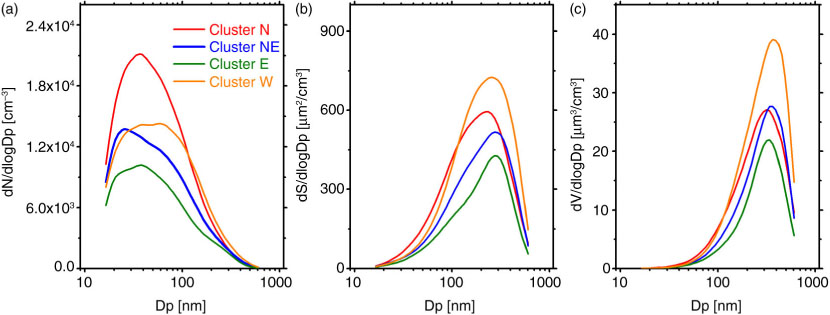
Fig. 5
Mean size distribution of aerosol (a) number, (b) surface and (c) volume concentrations for the four clusters, according to the classification in Fig. 4.
Table 2. Comparisons of the selected parameters for the four clusters: (mean±Standard deviation)
N-Nucleation (cm−3)3100±22004700±37003800±29002700±19003600±2600N-Aitken (cm−3)6700±37008400±46005800±34004400±26006900±3300N-Accumulation (cm−3)2900±17003100±18002500±15001800±9003800±1800N-Total (cm−3)12 700±620016 200±810012 100±62009000±470014 300±6200V-Total (µm3/cm3)16±816±814±711±521±9bap,670nm (Mm−1)21±1621±1115±1011±630±16bap,532nm (Mm−1)26±2025±1418±1214±835±19bsp,532nm (Mm−1)210±140163±134161±96116±53328±197ω00.88±0.050.84±0.050.88±0.050.89±0.040.89±0.05SO2 (ppb)7.1±5.911.4±8.56.2±4.64.7±2.07.7±6.4CS (s−1)0.019±0.0100.022±0.0080.017±0.0080.012±0.0060.024±0.010T (°C)21±419±520±420±322±4RH (%)63±1646±1659±1571±1068±14
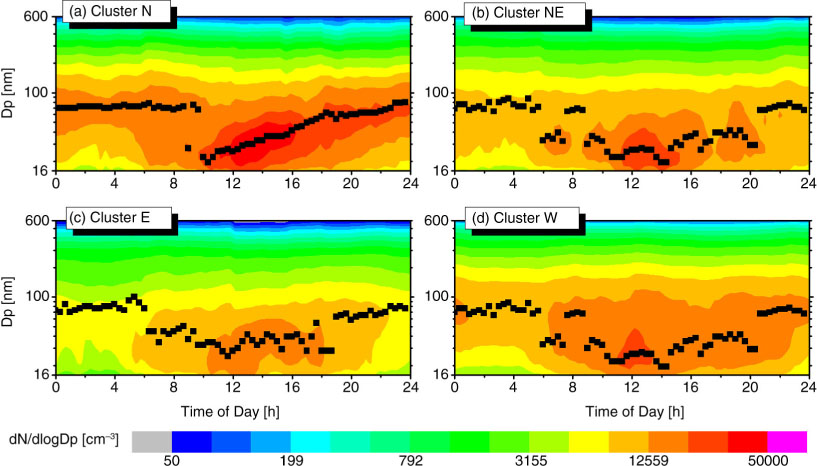
Fig. 6
Diurnal evolutions of particle number size distributions and the mean diameters of the dominating mode (black square) for the four clusters.