
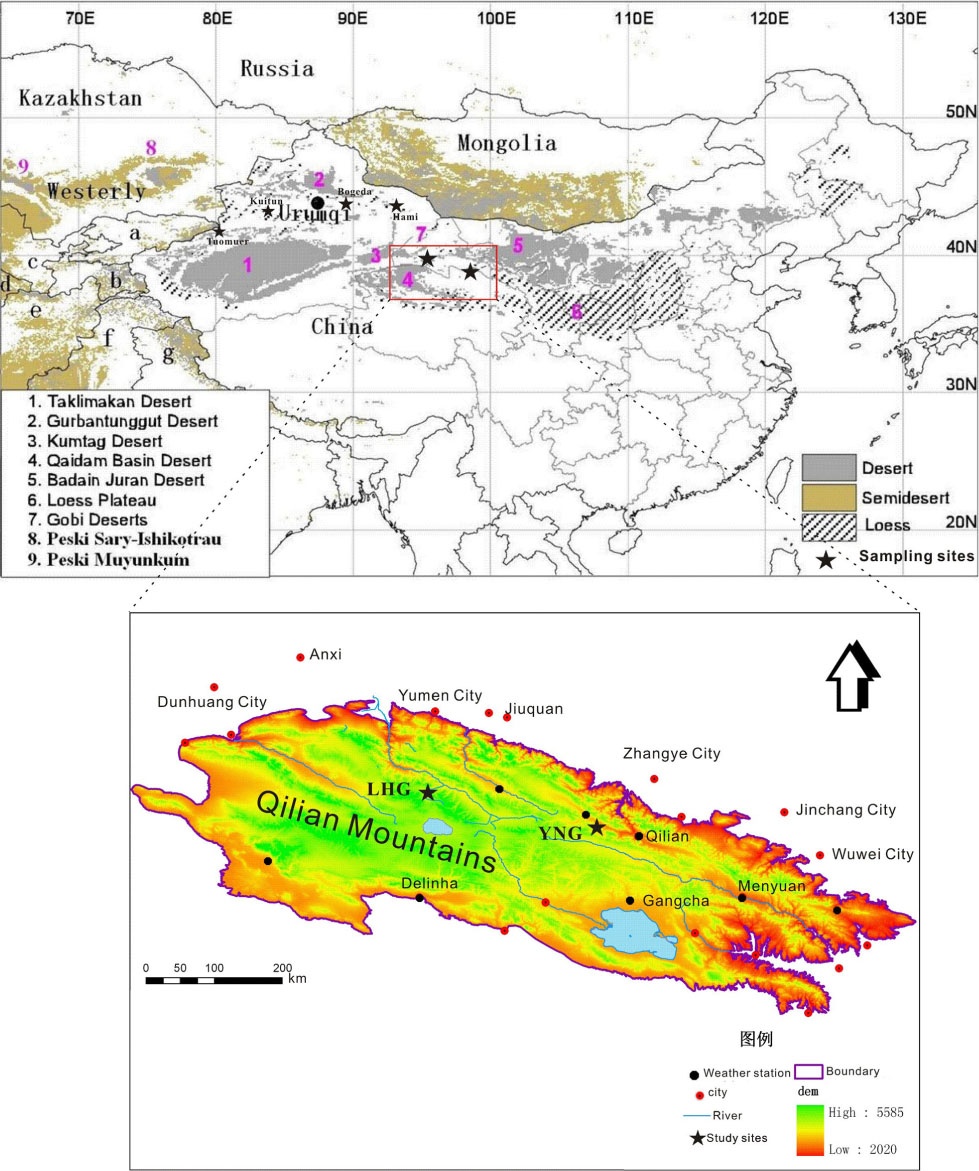
Fig. 1
Location of investigated glaciers of Glacier No.12 in the LHG Basin, and Shiyi Glacier in the YNG Basin in western Qilian Mountains.
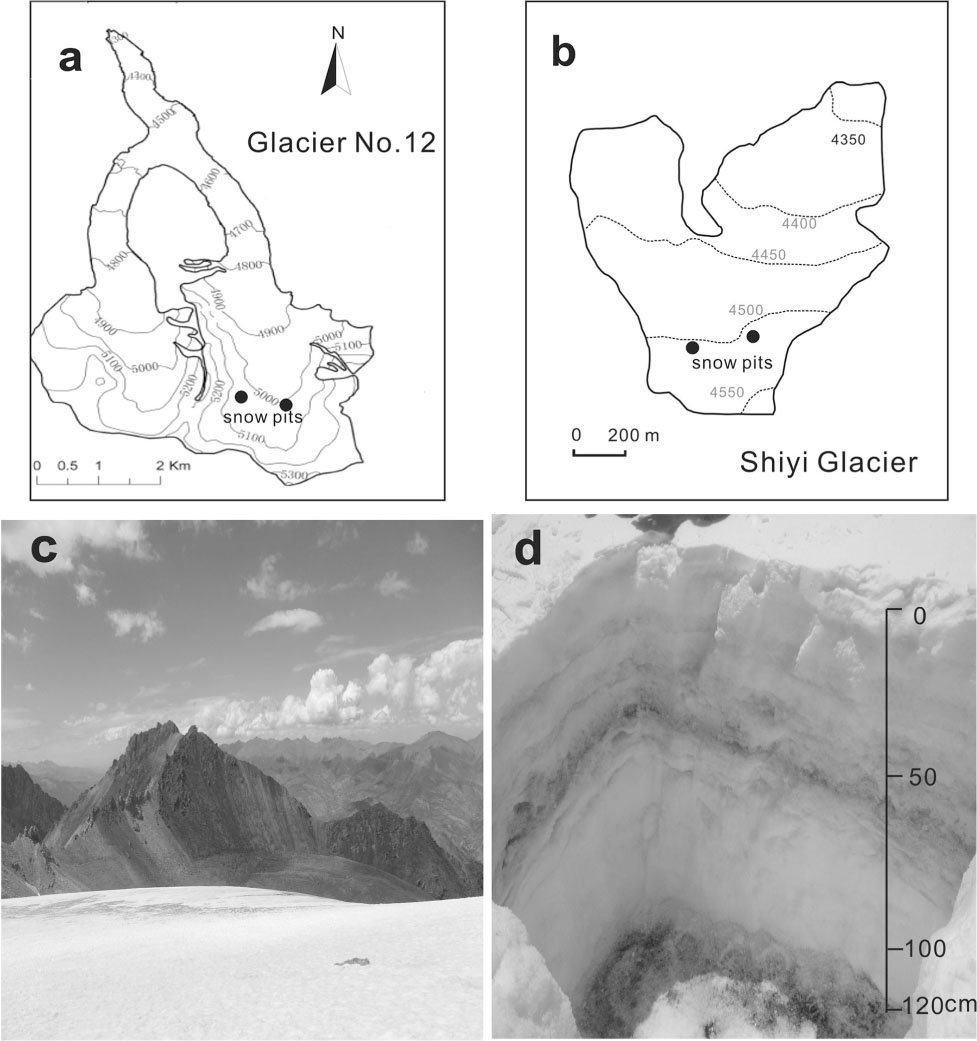
Fig. 2
The contour map and photographs showing (a) the flat location of snowpits on Glacier No. 12, (b) the flat location of snowpits on Shiyi Glacier, (c) Shiyi Glacier and surroundings in YNG Basin and (d) a typical snow pit for sampling on Glacier No. 12 in LHG Basin.
Table 1. The blank value for major ions of the whirl pack bags in the lab analysis (μg kg−1)
Table 2. Comparison of dust particles concentration at two sites in western Qilian Mountains
Table 3. Atmospheric dust concentration and flux in snow and ice at various northern hemispheric sites
1–1231.6
13.7143
1294.8
4.4Zdanowicz et al., 1998Devon Ice Cap, Canadian Arctic1800Last 7000 yr>18.32354.2Zdanowicz et al., 1998Alaska Range, USA2500Recent snow300Hinkley, 1994Summit, Greenland3207Recent snow0.5–12461Steffensen, 1997
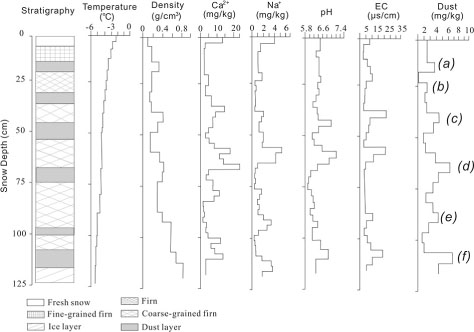
Fig. 3
Snow stratigraphy and vertical profiles of snow temperature, density, ionic concentrations, electric conductivity (EC) and dust concentration of a typical snowpit on Laohugou Glacier No.12 in summer 2012. Letters (a–f) in the dust profile indicate visible distinguishable dust layers in the snowpit.
Table 4. Correlation coefficient of ions and dust in the snow pits in western Qilian Mountains
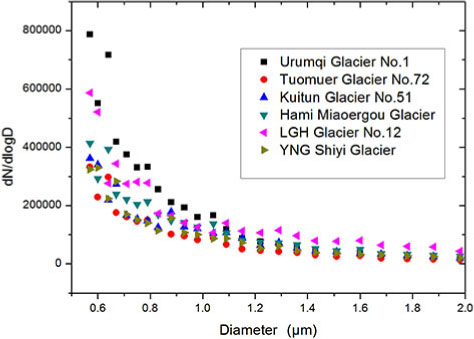
Fig. 4
Average number size distributions of dust particles in the snowpits of glaciers in western Qilian Mountains, and comparison of average number–size distribution of dust particles with other sites in Tianshan Mountains.
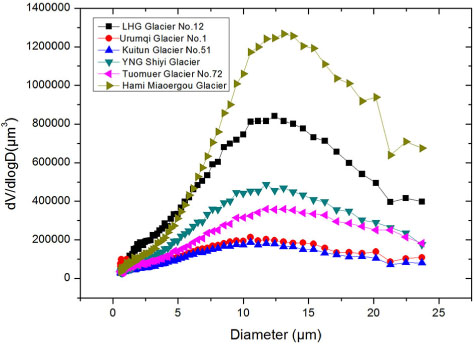
Fig. 5
Comparison of volume–size distribution of dust particles obtained at snowpit of six glaciers in western Qilian Mountains and Tianshan Mountains in central Asia.
Table 5. Parameters of volume–size distribution of dust in various sites of the Qilian Mountains, and Tianshan Mountains in Fig. 5
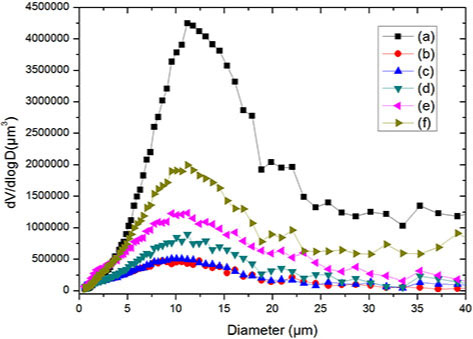
Fig. 6
Volume size distribution of dust particles in the snow layer (a–f) shown in Fig. 3
Table 6. Parameters of volume–size distribution of samples in different dust layers of Fig. 6
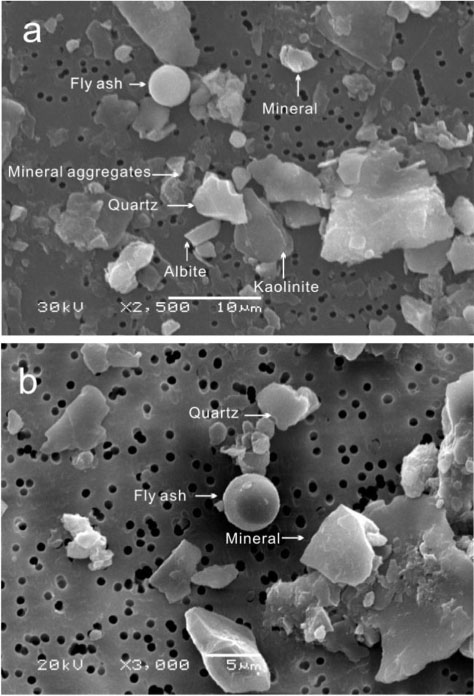
Fig. 7
Secondary electron images of some typical dust particles based on SEM–EDX, obtained from (a) LHG Glacier No.12, and (b) YNG Shiyi Glacier.
Table 7. Chemical types of fly ash particles within evaluated samples by EDX
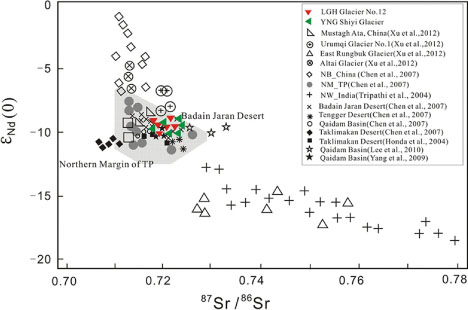
Fig. 8
The Nd–Sr isotopic composition of insoluble particles in snow samples collected from LHG Glacier No.12, YNG Shiyi Glacier, and comparison with other glaciers in western China.
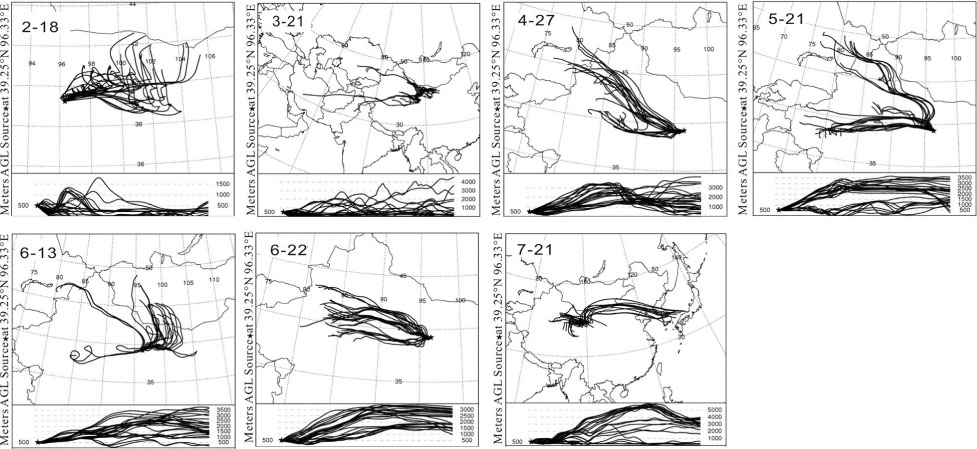
Fig. 9
Three-day backward trajectories terminated at 500 m above the ground level of the field observation site at LHG Glacier No.12 in Qilian Mountains, each panel showing trajectories on specific days of typical air-mass transport during winter, springtime and summer during the year 2012.