
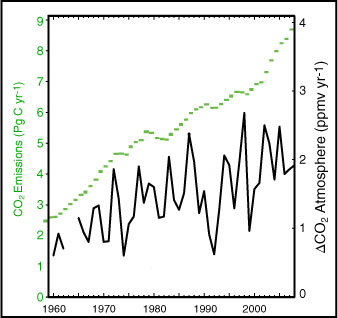
Fig. 1
The annual change in atmospheric CO2 concentration measured at the Mauna Loa site (black curve) and estimates of the annual CO2 emissions from fossil fuel burning and cement production (green bars). As is usefully done elsewhere (Prentice et al., 2001), the ratio of the two Y-axes is chosen such that the rate of CO2 change would track the emissions curve if all emissions were accounted for and remained in the atmosphere; the interannual variability seen in the CO2-change record is much larger than, and therefore cannot be explained by the interannual variability seen in the estimated emissions.
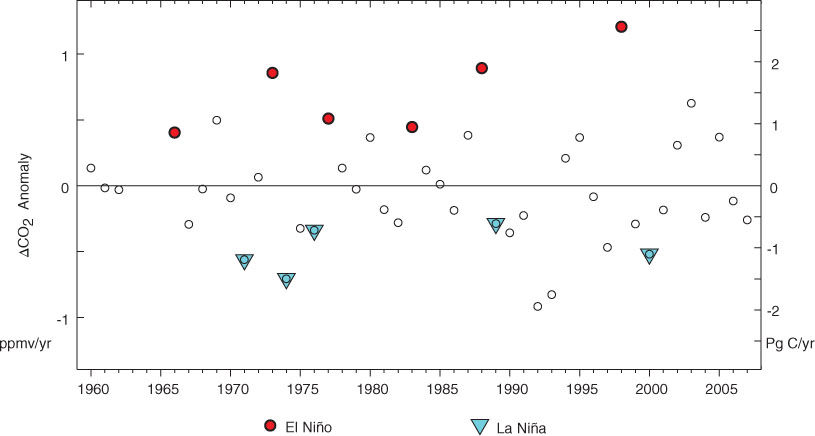
Fig. 2
Annual changes in CO2 concentration (left-hand Y-axis) after removing the trend from emissions. Estimated net carbon equivalent given by the Y-axis on the right. Filled red circles mark years with SON NIÑO3 > 1σ; blue triangles for years with SON NIÑO3 <1σ.
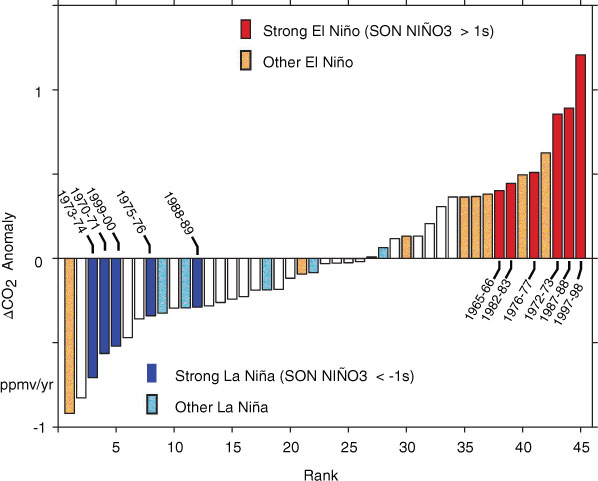
Fig. 3
Rank-order ΔCO2 anomalies with strong La Niña and El Niño years, based on SON values of the NIÑO3 index, shaded blue and red, respectively. Other years with ENSO-status based on the current NOAA Historical El Niño definition are shown with speckled shading.
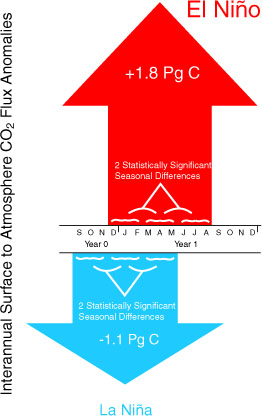
Fig. 4
Summary of strong La Niña and El Niño effects on interannual atmospheric CO2 concentration variability. The season-to-season CO2 changes illustrated here are those that yield statistically significant composite ΔCO2 anomalies (all season-to-season changes from ENSO Year 0 to 2 were evaluated for their statistical significance).
Table 1. Composite seasonal changes in atmospheric CO2 concentration at the Mauna Loa site for the 5 strong La Niña and 6 strong El Niño events (ENSO Year 0 to Year +1)
[i] Values are in ppmv yr−1. Bold type shows values significant at the 95% level. All other values shown are significant at the 90% level, or better, except for the value noted by the asterisk, for which p=0.89. All seasonal pairs from ENSO Year 0 to 2 were considered. Only those shown yield statistically significant results.