Have a personal or library account? Click to login
Short-wave radiative forcing at the surface for cloudy systems at a midlatitude site Cover

Short-wave radiative forcing at the surface for cloudy systems at a midlatitude site

Open Access
|Jan 2013

Figures & Tables

Table 1. Values of c 1, c 2 and c 3 (eq. 1) for each interval of AOD440 nm
AOD440 nm intervalc1c2c3n(0, 0.1]−83±21197±8−89±73783(0.1, 0.2]−82±21122±7−24±65279(0.2, 0.3]−87±21059±1023±82498(0.3, 0.4]−89±41004±1468±12803(0.4, 0.5]−108±111010±5050±40108(0.5, 0.6]−80±4864±16170±1498(0.6, 1.0]−66±4759±17267±1437

[i] n is the number of data. Units in W m−2.

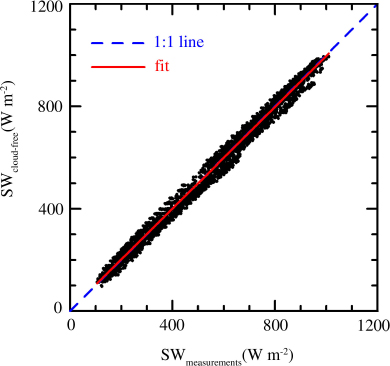
Fig. 1

Comparison of SW measurements and estimations by eq. (1) and Table 1. Solid line is the linear fit and dashed line is the 1:1 line.

Table 2. Statistical estimators in the validation of SWcloud−free model [eq. (1) and Table 1]

VariableValuen4512SWmeasurements average523 W m−2SWcloud−free average523 W m−2Bias0.35%rmse4.6%W10%86.3%W30%100%Ordinate3.4 W m−2Slope0.99r20.99

[i] n is the number of data, bias and rmse are given in eqs. (10) and (11), W10% and W30% are the percentage of cases with an error <10 and 30%, respectively, and r 2 is the correlation coefficient of a linear fit.

Table 3. CRFSW (NCRFSW), CARFSW (NCARFSW) and ARFSW (NARFSW) 1-min statistics at 30° and 60° of SZA: average (ave), standard deviation (SD), first quartile (q1), median (md) and third quartile (q3)
VariableCRFSW (NCRFSW)CARFSW (NCARFSW)ARFSW (NARFSW)n12 620 (12 620)12 620 (12 620)12 620 (12 620)Ave−78 (−11)−100 (−14)−22 (−3)SD161 (23)163 (23)16 (2)SZA=30°q1−46 (−7)−75 (−10)−32 (−4)md−23 (−3)−43 (−6)−12 (−2)q3−2.0 (−0.3)−20 (−3)−12 (−2)n31 897 (31 897)31 897 (31 897)31 897 (31 897)Ave−50 (−13)−69 (−17)−19 (−4)SD124 (32)124 (31)17 (4)SZA=60°q1−122 (−32)−144 (−36)−36 (−5)md−9 (−2)−31 (−8)−17 (−4)q336 (9)22 (5)0 (0)

[i] CRFSW, CARFSW and ARFSW are in W m−2, and NCRFSW, NCARFSW and NARFSW are in percentage.

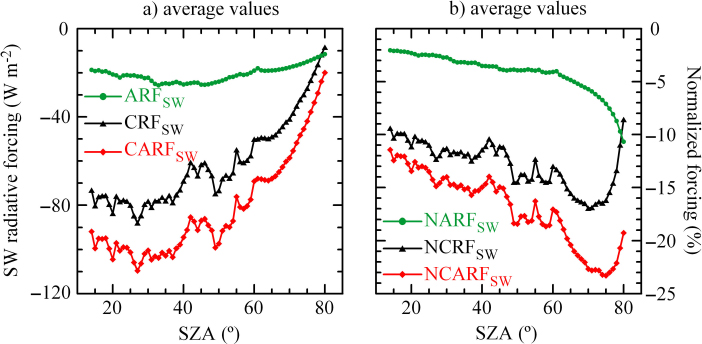
Fig. 2

Evolution of the average values for CRFSW (a, with triangles), CARFSW (a, with diamonds), ARFSW (a, with circles), NCRFSW (b, with triangles), NCARFSW (b, with diamonds), and NARFSW (b, with circles) as a function of solar zenith angle.
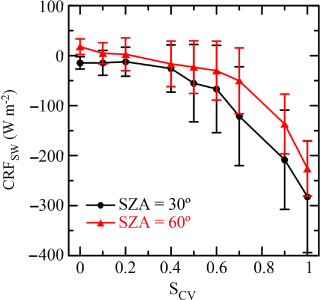
Fig. 3

CRFSW as a function of SCV at 30° (line with circles) and 60° (line with triangles) of solar zenith angle. Vertical bars are the standard deviation of each interval (see text).
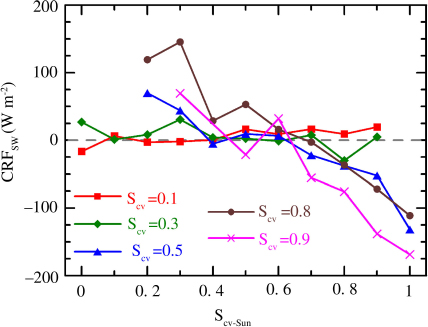
Fig. 4

CRFSW as a function of SCV-Sun at SZA = 60°. Different symbols are the different values of the hemispheric SCV. The grey dotted line is the CRFSW=0 case.
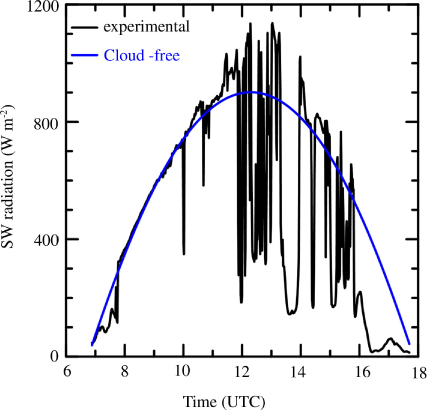
Fig. 5

Evolution of SW radiation measurements and cloud-free estimations.
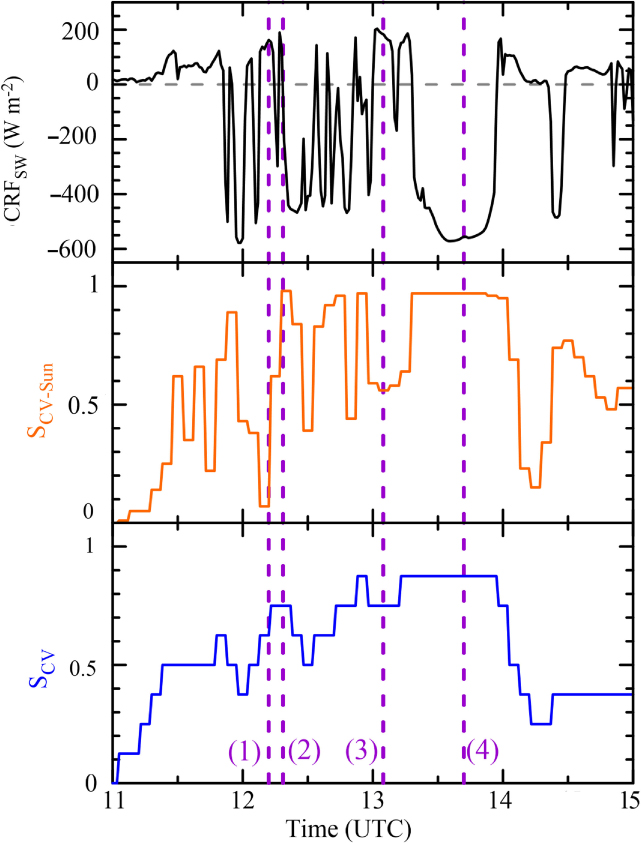
Fig. 6

Evolution of CRFSW, SCV and SCV-Sun for the case study analysed in this study on 3 April 2007. Vertical dashed lines point out four positions that correspond with the sky photo shown in Fig. 7. Horizontal dashed line in the upper panel points out CRFSW=0.
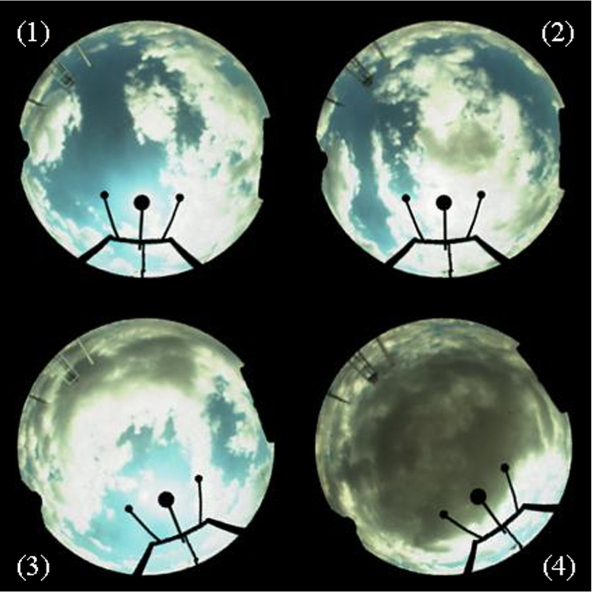
Fig. 7

Sky photo for the four positions highlighted in Fig. 6: (1) at 12:10 h, (2) at 12:20 h, (3) at 13:05 h and (4) at 13:40 h UTC on 3 April 2007.

Language: English
Page range: 21069 - 21069
Submitted on: Apr 9, 2013
Accepted on: Aug 22, 2013
Published on: Jan 1, 2013
Published by: Stockholm University Press
In partnership with: Paradigm Publishing Services

© 2013 David Mateos, Manuel Antón, Antonio Valenzuela, Alberto Cazorla, Francisco J. Olmo, Lucas Alados-Arboledas, published by Stockholm University Press
This work is licensed under the Creative Commons Attribution 4.0 License.