Have a personal or library account? Click to login
Sustained large stimulation of soil heterotrophic respiration rate and its temperature sensitivity by soil warming in a cool-temperate forested peatland Cover

Sustained large stimulation of soil heterotrophic respiration rate and its temperature sensitivity by soil warming in a cool-temperate forested peatland

Open Access
|Jan 2013

Figures & Tables

Fig. 1

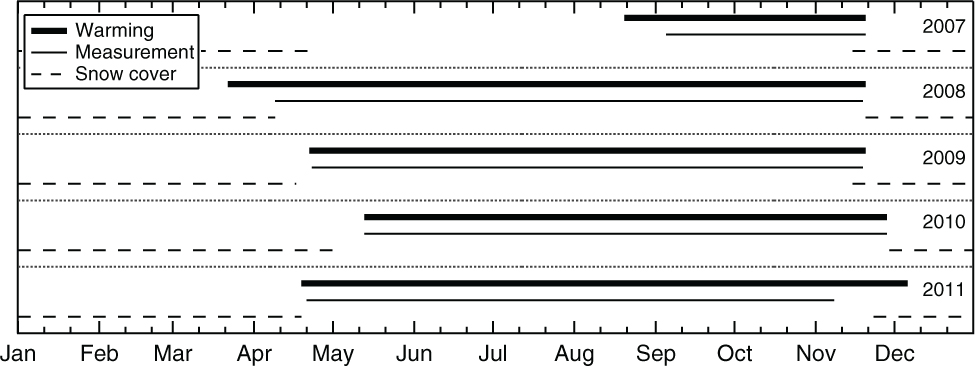
Warming, measurement and snow-covered periods during 2007–2011.
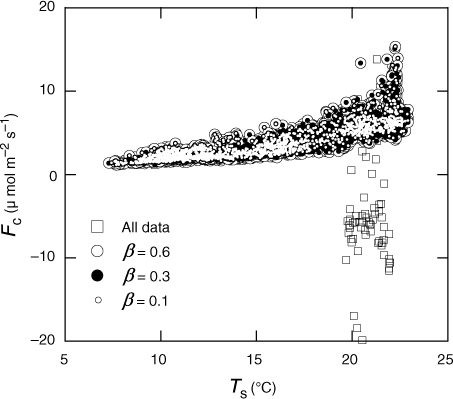
Fig. 2

Relationship between soil temperature (T s) and soil CO2 efflux (F c) after outlier detection by eqs. (1) and (2) with three cases for their threshold value (β=0.1, 0.3 and 0.6). Efflux data without outlier detection are also plotted. Data obtained from April to August 2008 at Chamber no. 10 are used.
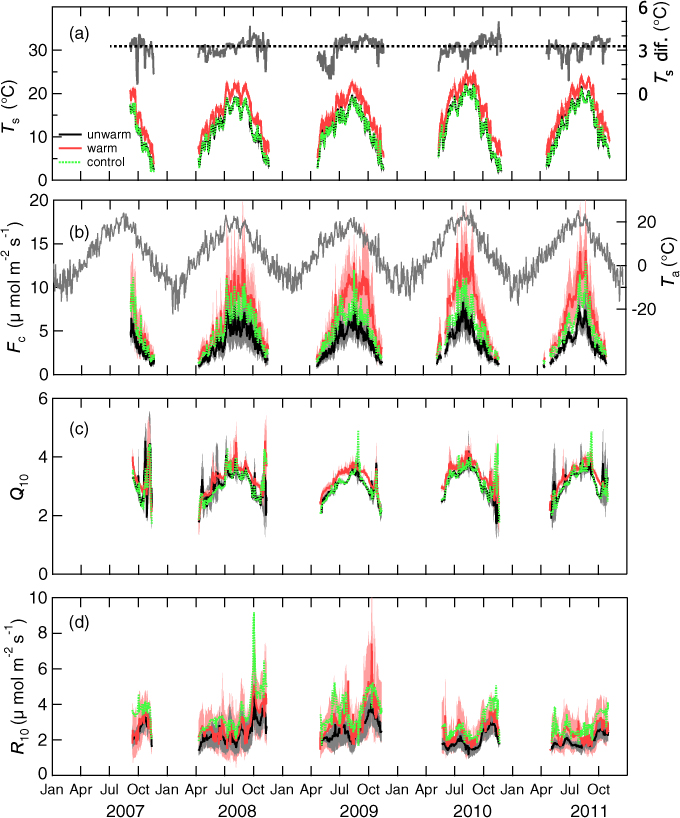
Fig. 3

Inter-annual variation of (a) soil temperature at 5-cm depth (T s) and temperature difference between unwarmed and warmed treatments (T s dif.), (b) soil CO2 efflux (F c) and daily-average air temperature (T a), (c) Q 10, and (d) basal respiration rate at 10°C (R 10). Thick lines are the average of five daily averages and the standard deviation is shown as shades for two trenched treatments. For undisturbed control treatment, only average values are shown as dot lines. The temperature difference is shown as the difference between daily averages of five chambers.

Table 1

Inter-annual variation of micrometeorology

20072008200920102011AnnualAir temperature (°C)5.65.85.76.55.7Precipitation (mm)806984126216821024Measurement periodDays77225211200202Air temperature (°C)–12.312.313.913.4Precipitation (mm)–6666501049618Solar radiation (GJ m−2)–3.152.902.582.80

[i] Annual and seasonal averages (air temperature) and sums (precipitation and solar radiation) are shown.

Table 2

F values of repeated-measures ANOVA on the effects of warming, month and their interaction on monthly averages of soil temperature at 5-cm depth (T s), soil CO2 efflux (F c), Q 10 and basal respiration rate at 10°C (R 10)

YearWarmingMonthWarming×monthTs2007214***3682***5.86*2008190***1508***1.352009132***1798***7.35**2010132***2367***3.75*2011233***2301***2.39Fc20074.48 ^49.4***4.12 ^20083.74 ^38.3***2.6720098.03*61.7***6.61*201013.4**99.1***14.8**20117.69*67.6***6.12*Q1020070.033.02 ^1.2220082.7115.0**0.662009113***167***2.70201025.5**42.7***0.9720112.9430.9***0.65R1020070.0750.0***0.8620080.4029.2***1.0920090.5614.7**1.2420101.4431.2***2.1720111.2417.9***0.99

[i] ^, , **, and *** denote significant difference between unwarmed- and warmed-trenched treatments at p<0.10 (as a reference), 0.05, 0.01, and 0.001, respectively.

Table 3

Seasonal average (each measurement period for each year) and the standard deviation of soil temperature at 5-cm depth (T s) and soil CO2 efflux (F c)

Ts (°C)Fc (mol C m−2 s−1)Fc (kg C m−2 )Ts dif. (°C)ER (%)HR (%)YearUnwarmedWarmedControlUnwarmedWarmedControlUnwarmedWarmedControl200710.10±0.5812.97±0.309.66±0.222.90±0.514.57±1.854.19±1.612.875869200812.30±0.3115.39±0.4312.18±0.323.75±1.356.19±2.505.25±1.970.87±0.32 (0.80±0.30)1.44±0.58 (1.32±0.54)1.22±0.46 (1.12±0.42)3.096571200912.25±0.2315.38±0.5512.11±0.253.72±1.026.49±2.485.22±1.910.81±0.22 (0.76±0.21)1.46±0.50 (1.37±0.47)1.14±0.41 (1.07±0.39)3.137471201013.59±0.2116.85±0.5813.52±0.263.88±0.937.73±1.885.54±2.390.78±0.19 (0.75±0.18)1.53±0.37 (1.48±0.35)1.12±0.47 (1.07±0.45)3.269970201113.15±0.1916.32±0.4613.01±0.293.69±0.647.17±2.315.07±2.420.73±0.13 (0.69±0.12)1.36±0.42 (1.30±0.40)1.01±0.45 (0.96±0.44)3.1694734 seasons12.80±0.2215.96±0.4912.68±0.283.76±0.986.84±2.225.27±2.113.19±0.835.78±1.834.49±1.773.158271

[i] Seasonal sums of F c are also shown for each measurement period of each year and for the same days of the year (180 days from 13 May to 8 November) overlapping during the four seasons from 2008 to 2011 (parentheses). Seasonal average difference in the soil temperature between unwarmed and warmed treatments (T s dif.), seasonal average enhancement ratio of F c by warming (ER), and seasonal average ratio of unwarmed-trenched F c to control F c (HR) are also shown. Four-season averages during 2008–2011 are also shown for each parameter.
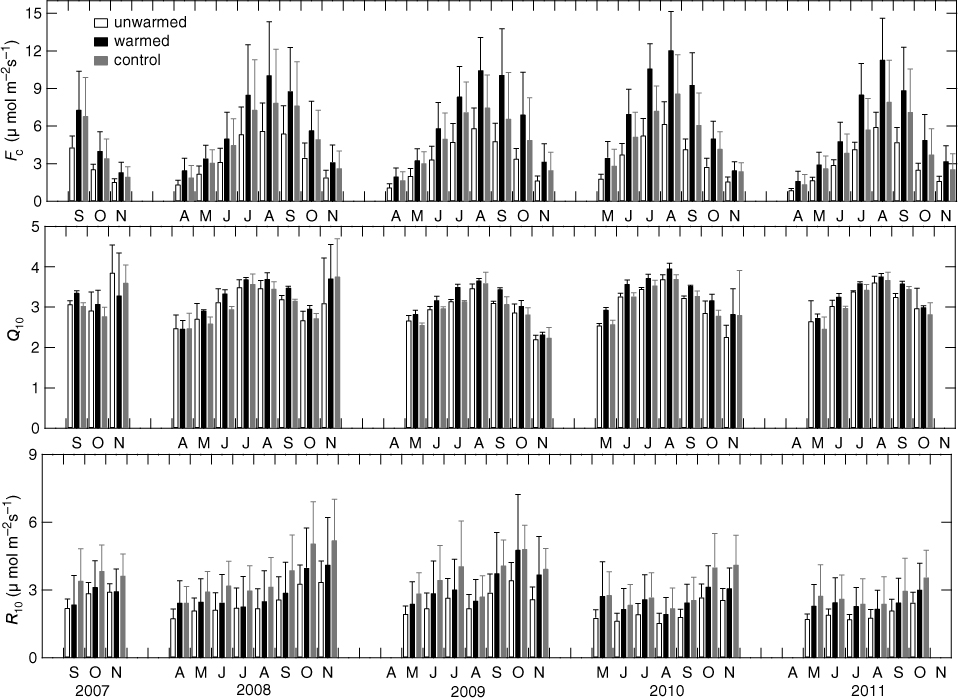
Fig. 4

Monthly averages of soil CO2 efflux (F c), Q 10 and basal respiration rate at 10°C (R 10). The standard deviation is shown as vertical lines.
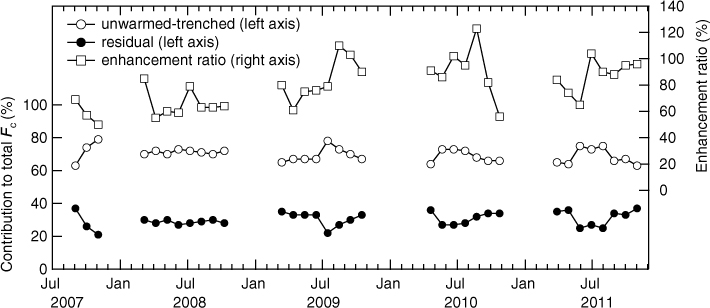
Fig. 5

Inter-annual variation of monthly average ratio of efflux rate in unwarmed-trenched chambers to total soil CO2 efflux (open circles), the residual (total – unwarmed-trenched) to total efflux (closed circles) and monthly average enhancement ratio of trenched efflux by warming (open squares).
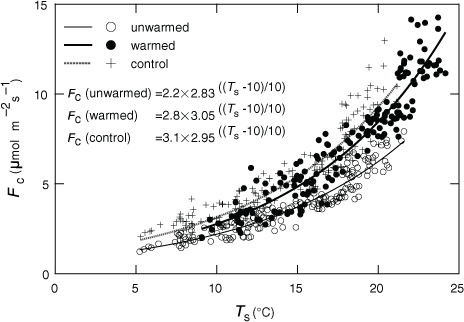
Fig. 6

Relationship between daily-average soil CO2 efflux (F c) and soil temperature at 5-cm depth (T s) in 2011 (n=5). Regression equations in the figure were obtained by the least-squares method using eq. (3).
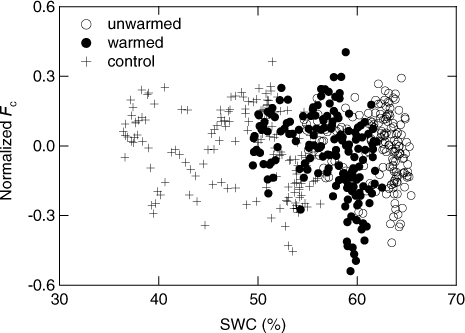
Fig. 7

Relationship between temperature-normalised daily-average F c and the soil water content (SWC). See text for the determination of temperature-normalised F c.

Table 4

Seasonal average (each measurement period for each year) and standard deviation of Q 10 and basal respiration rate at 10°C (R 10)

Q10R10 (mol C m−2 s−1)YearUnwarmedWarmedControlUnwarmedWarmedControl20073.15±0.353.18±0.322.99±0.182.66±0.422.91±1.163.68±1.1920083.06±0.243.27±0.103.04±0.112.37±0.722.81±1.323.46±1.2020093.00±0.043.15±0.093.00±0.052.59±0.643.23±1.343.74±1.1220103.17±0.063.47±0.113.25±0.111.98±0.422.55±0.892.86±1.0120113.16±0.193.33±0.033.16±0.091.95±0.322.45±0.932.68±1.21Four seasons3.10±0.083.31±0.063.11±0.092.22±0.522.76±1.153.20±1.12

[i] Four-season averages during 2008–2011 are also shown.

Language: English
Page range: 20792 - 20792
Submitted on: Mar 7, 2013
Accepted on: Jun 27, 2013
Published on: Jan 1, 2013
Published by: Stockholm University Press
In partnership with: Paradigm Publishing Services

© 2013 Maricar Aguilos, Kentaro Takagi, Naishen Liang, Yoko Watanabe, Munemasa Teramoto, Seijiro Goto, Yoshiyuki Takahashi, Hitoshi Mukai, Kaichiro Sasa, published by Stockholm University Press
This work is licensed under the Creative Commons Attribution 4.0 License.