
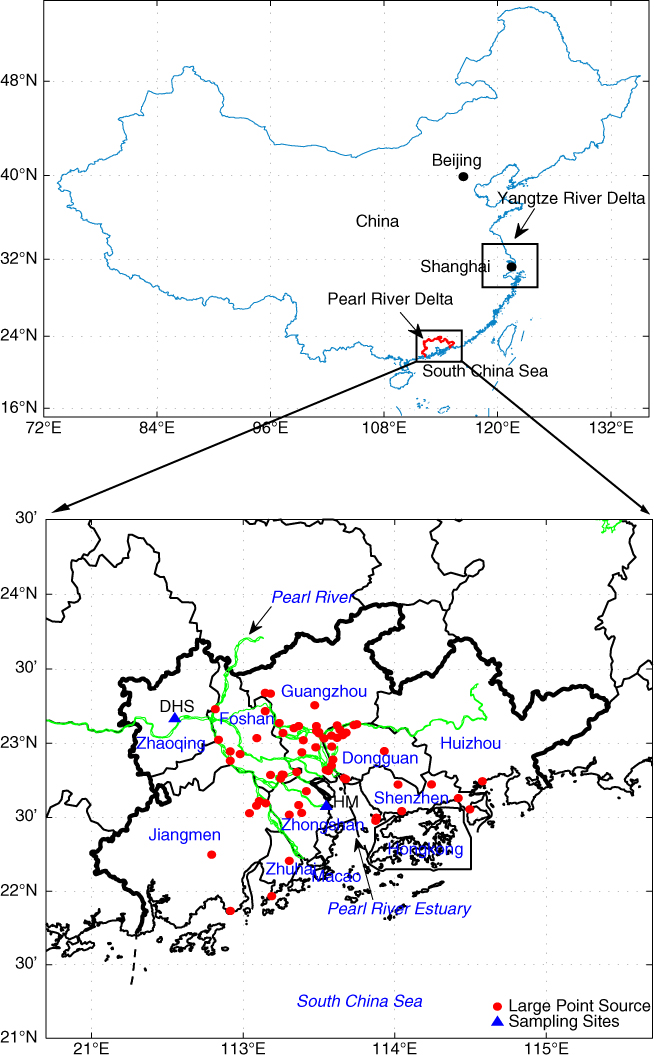
Fig. 1
Locations of the sampling sites (triangle symbols). The circle symbols indicate the locations of large point sources of NOx emission (>1000 ton yr−1).
Table 1
Deposition fluxes of reactive nitrogen at DHS during Jan 2007–Dec 2007 and at HM during Nov 2006–Oct 2007a
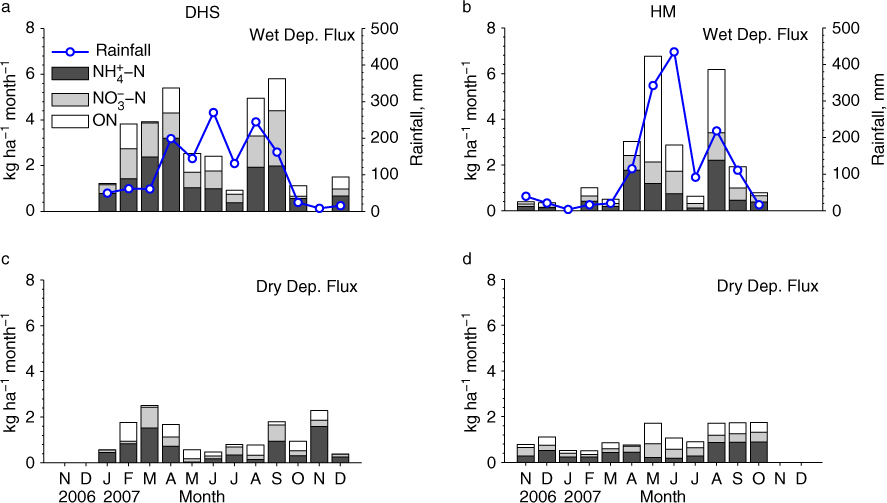
Fig. 2
Monthly deposition fluxes of ammonium nitrogen (-N), nitrate nitrogen (-N) and organic nitrogen (ON): (a) rainfall and wet deposition at DHS; (b) rainfall and wet deposition at HM; (c) dry deposition at DHS; (d) dry deposition at HM.
Table 2
Wet deposition fluxes of reactive nitrogen among cities in the Pearl River Delta region, Southern China
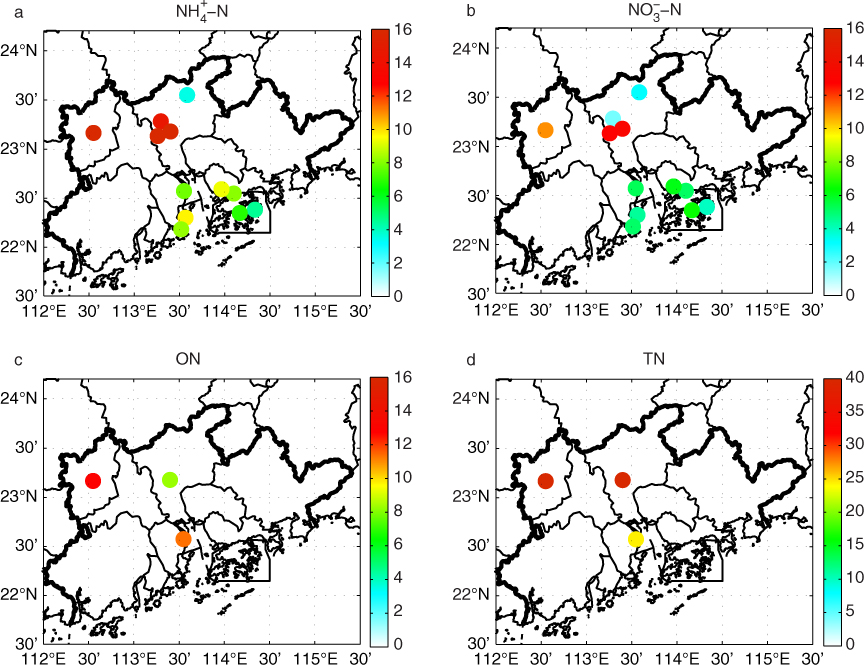
Fig. 3
Spatial distribution of wet deposition flux of (a) ammonium nitrogen (-N), (b) nitrate nitrogen (-N), (c) organic nitrogen (ON) and (d) total nitrogen (TN) in the Pearl River Delta region (kg ha−1 yr−1). References for data sources are listed in Table 2. The arithmetic mean flux is displayed if data of multiple years are available for the same site.
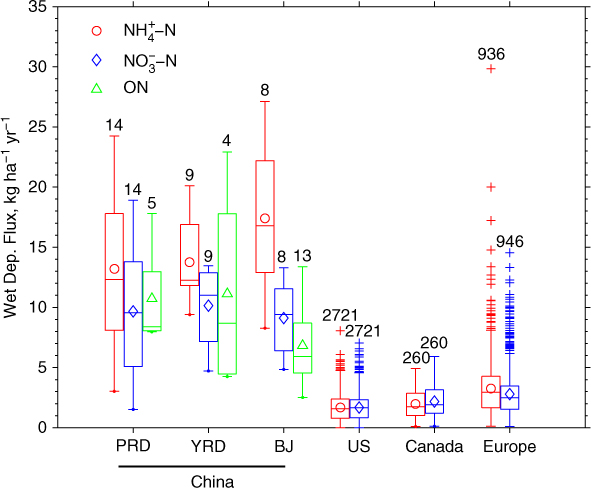
Fig. 4
Comparison of wet deposition fluxes of ammonium nitrogen (-N), nitrate nitrogen (-N) and organic nitrogen (ON) during 2000–2010 from the Pearl River Delta (PRD) sites with observations in Yangtze River Delta (YRD) of China, Beijing (BJ) of China, United States (US), Canada and Europe. In each box, the central mark is the median, the edges of the box are the 25th (q1) and 75th (q3) percentiles, the whiskers extend to the most extreme data points not considered outliers and points are drawn as outliers (symbol ‘+’) if they are larger than q3+1.5 (q3–q1) or smaller than q1–1.5 (q3–q1). The open cycles, diamond and triangle inside the boxes are the mean values. The number above each box-whisker is the number of samples. Table 2 lists the data for PRD; data for YRD were from Zhang et al. (2007), Huang et al. (2008), Zhao et al. (2009), Xu et al. (2011), Yang et al. (2010), Zhang et al. (2008), Zhang et al. (2012) and Wang et al. (2004); data for BJ were from Tang et al. (2005), Yang et al. (2012), Xu and Han (2009), Zhang et al. (2008) and Zhang et al. (2012); US data are from NADP network available on the web at http://nadp.isws.illinois.edu/nadpdata/multsite.asp?state=ALL; Canada data are from CAPMoN network available on the web at http://www.on.ec.gc.ca/capmon/login/login.aspx; Europe data are from EMEP network available on the web at http://www.nilu.no/projects/ccc/emepdata.html.
Table 3
Annual dry deposition fluxes of reactive nitrogen (kg ha−1 yr−1) collected by the DDAS (dry deposition on aqueous surface) sampling device for different sites
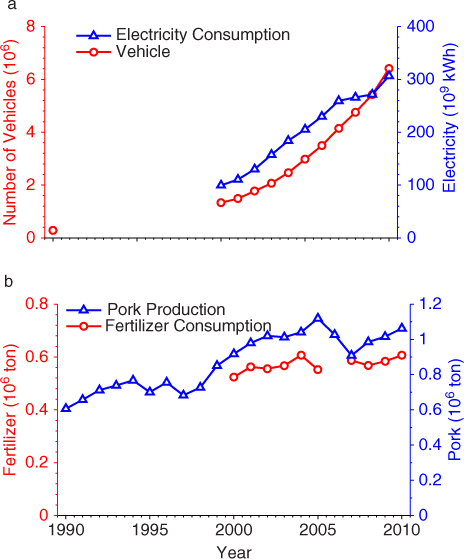
Fig. 5
Number of civil vehicles, electricity consumption, chemical fertilizers consumption in effective weight and pork production in PRD excluding Hong Kong and Macao from 1990 to 2010 (Guangdong Statistical Yearbook, 1991–2011).