
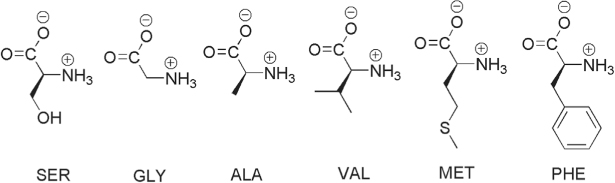
Fig. 1
Chemical structures of the l-amino acids under study.
Table 1
DFAAs detected in air collected between 32.5 to 36.6°N and 132.7 and 133.0°W
[i] The DFAAs are shown in decreasing order of abundance (Malder et al., 2004): THR: threonine, GLU: glutamic acid, ASP: asparagine, CYS: cysteine, LYS: lysine, TYR: tyrosine, LEU: leucine, ILE: iso-leucine, HIS: histidine.
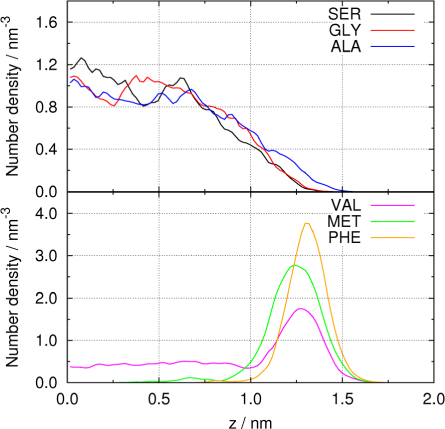
Fig. 2
Axial number densities of the six types of amino acids in planar interface simulations.
Table 2
Cartesian components of pressure tensor (in bar), length of simulation box in z-direction (in nm), surface tension σ (in mJ m−2), and surface tension-concentration slope dσ/dC for planar liquid-gas interface together with reference data (in mJ m−2 L mol−1)
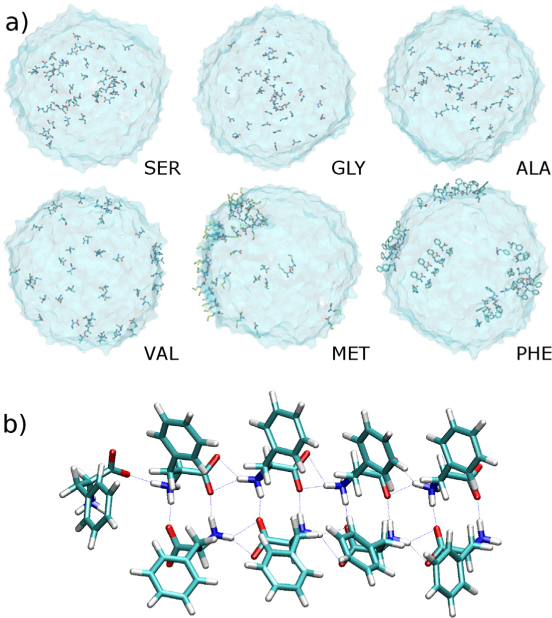
Fig. 3
(a) Snapshots for water droplets containing different amino acids. (b) Hydrogen bond network in phenylalanine molecules on droplet surface.
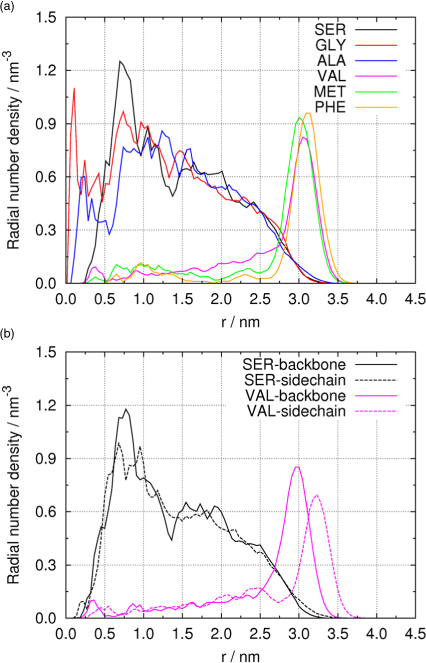
Fig. 4
(a) Radial number densities of different amino acids in droplets containing 5000 water molecules. (b) Molecular orientation of SER and VAL in droplets.
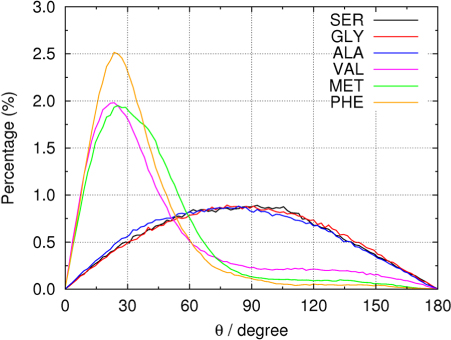
Fig. 5
Distribution of angle θ and order parameters.
Table 3
Order parameter of amino acids in the spherical clusters
Table 4
Density of liquid phase ρ α (in nm−3), radius of equimolar dividing surface R e (in nm), surface tension σ (in mJ m−2), and individual contributions to work of formation W (in 10−19 J) for spherical droplets consisting of 5000 water molecules and different amino acids
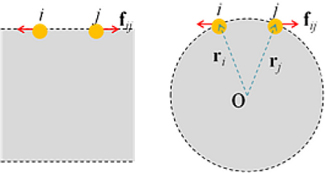
Fig. 6
Different effects of a pair of repulsive force on the surface tension of planar and spherical interfaces. Here, i and j denotes the two interacting particles, f ij is the force exerted on particle j, O denotes centre of mass of droplet, and r i and r j are the O→i and O→j vectors, respectively.
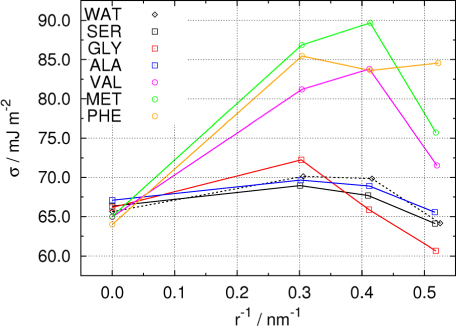
Fig. 7
Curvature dependence of surface tension of droplets containing 5000 water molecules and different amino acid molecules.
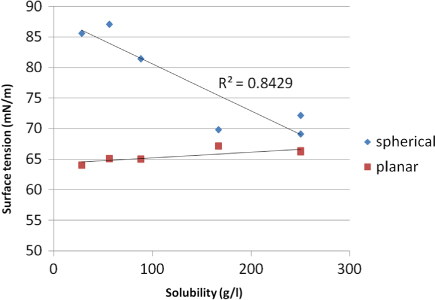
Fig. 8
The relation between solubility and surface tension.
Table 5
Solubility and surface tensions for the DFAAs used in this study
[i] aLide, D.R., (ed.). 2005. CRC Handbook of Chemistry and Physics. 86th ed. Boca Raton, FL: CRC Press.
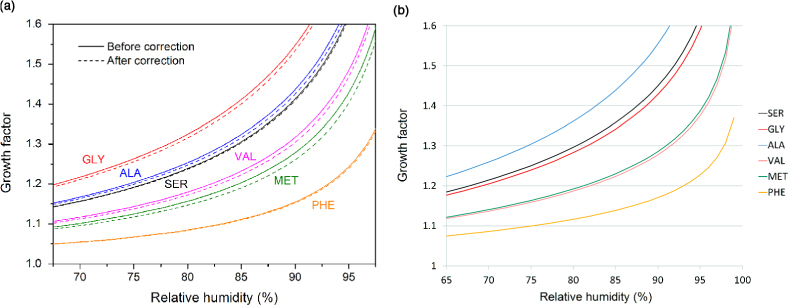
Fig. 9
Comparison between (a) calculated GF according to Biskos et al. (2006) and (b) the empirical relation. In (a) the GF–RH curves with surface tension correction taken into account were shown as dashed lines.