
Fig. 1
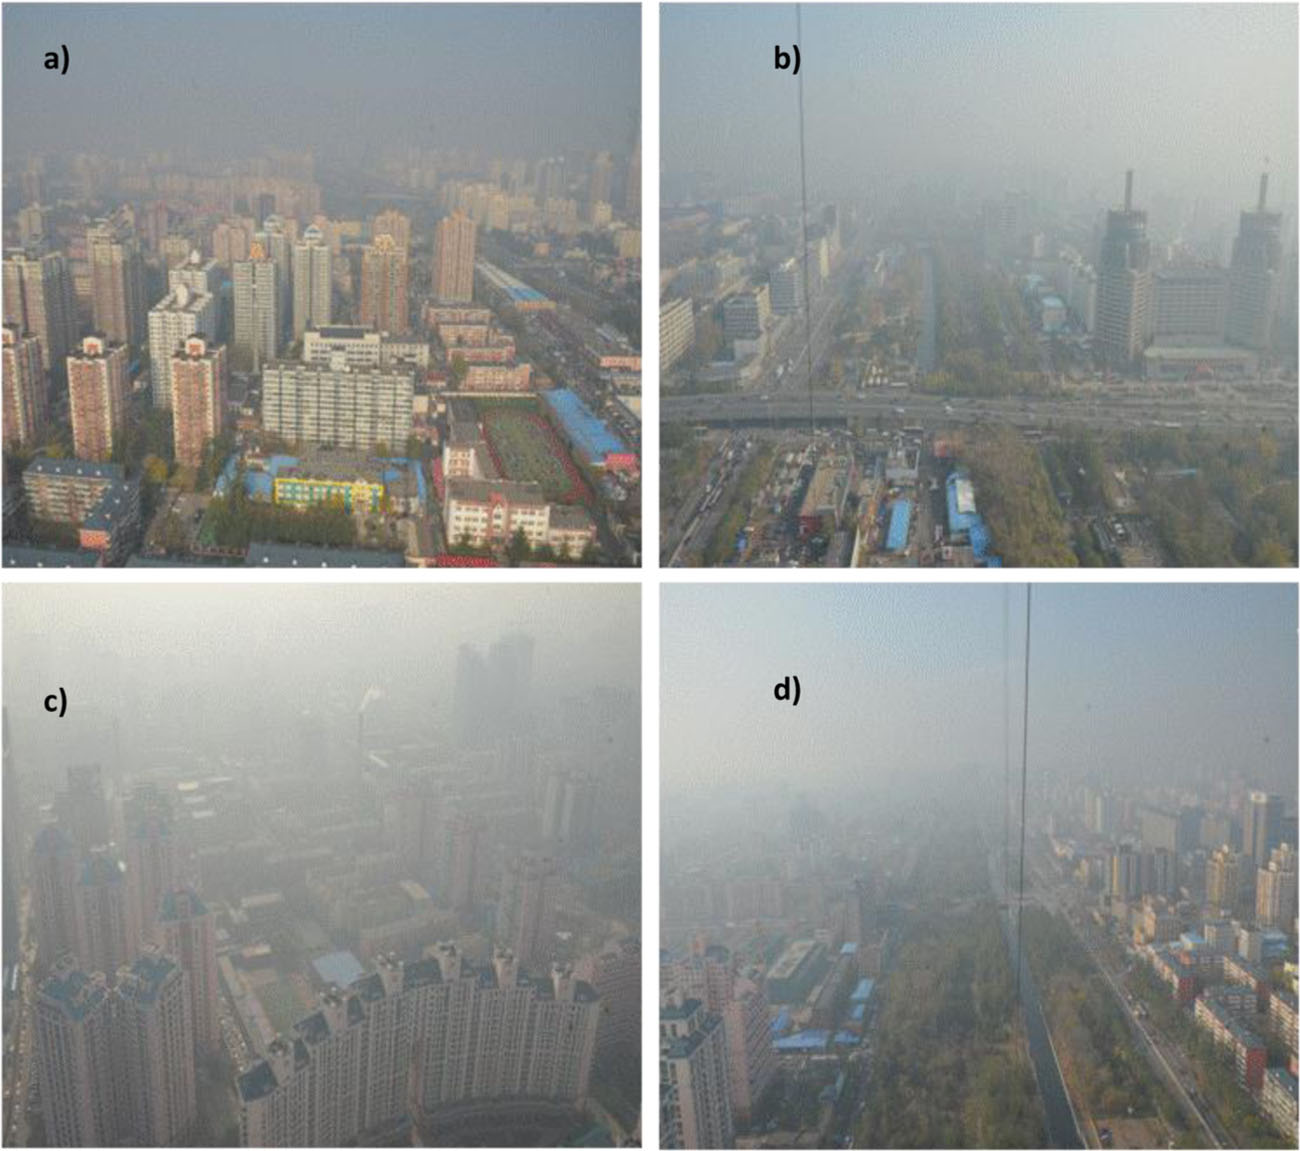
Photographic views from the 325-m meteorological tower at a height of 140 m looking northward (a), eastward (b), southward (c) and westward (d). The photographs were taken on 16 November 2012. The weather condition was hazy.
Table 1
The data coverage of turbulent fluxed measured at three levels 47, 140 and 280 m.
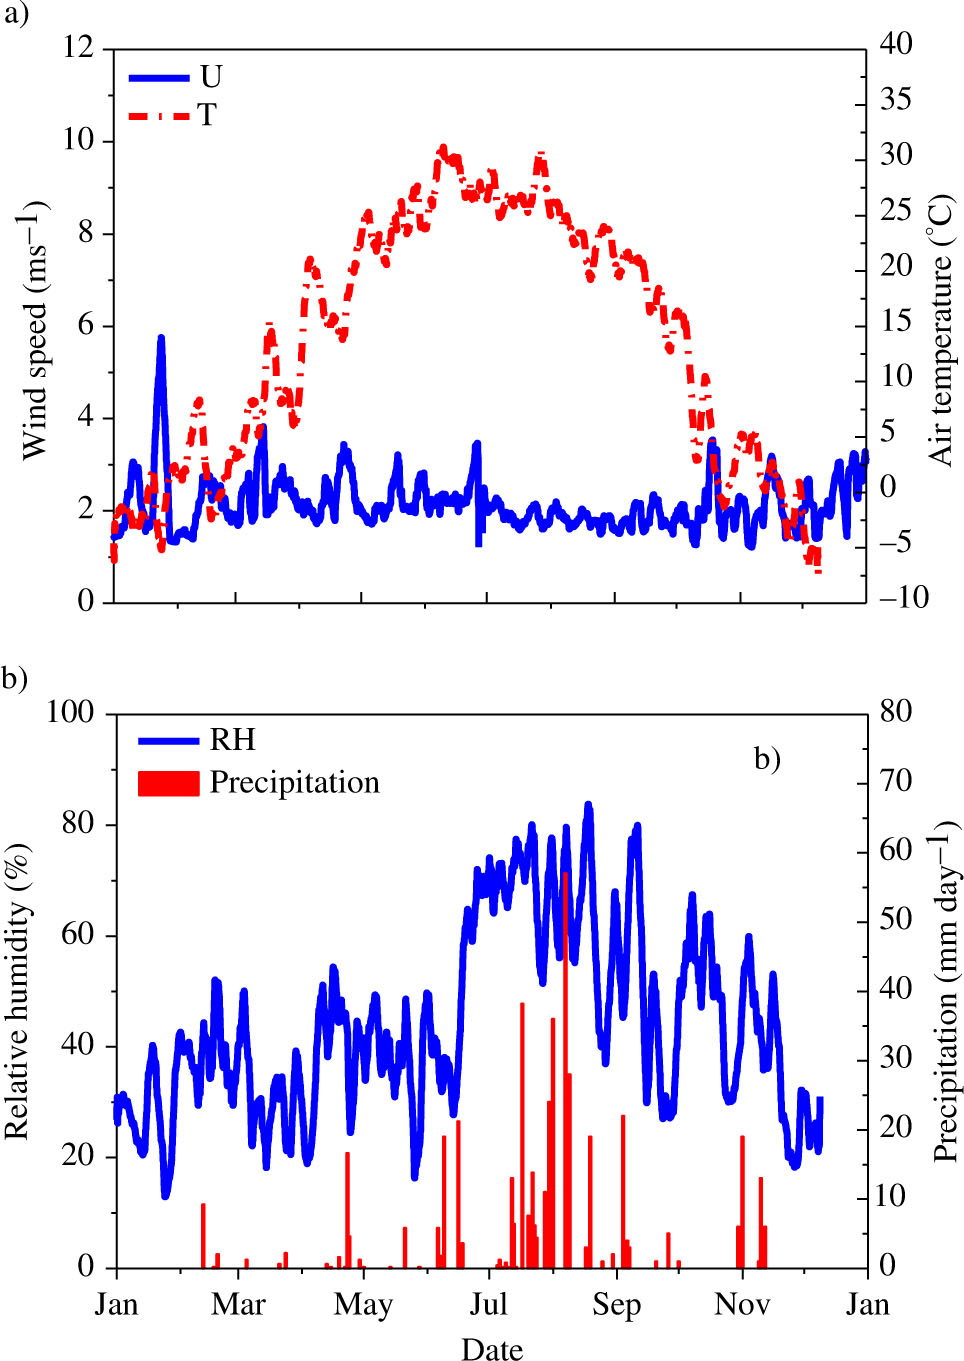
Fig. 2
(a) Five-day running means of the air temperature (°C) and wind speed (U, m s−1), (b) precipitation (mm d−1) and 5-d running means of the relative humidity (%) at a height of 32 m.
Table 2
Diurnally averaged half-hourly F c (mg m−2 s−1), where h={1,2,3, … 48} for the half hours of the day and f h as the set of flux data of all considered days for each h, is the average of all mean value, is the average of all median value, is the minimum and the maximum of the diurnal courses of the half hourly median .
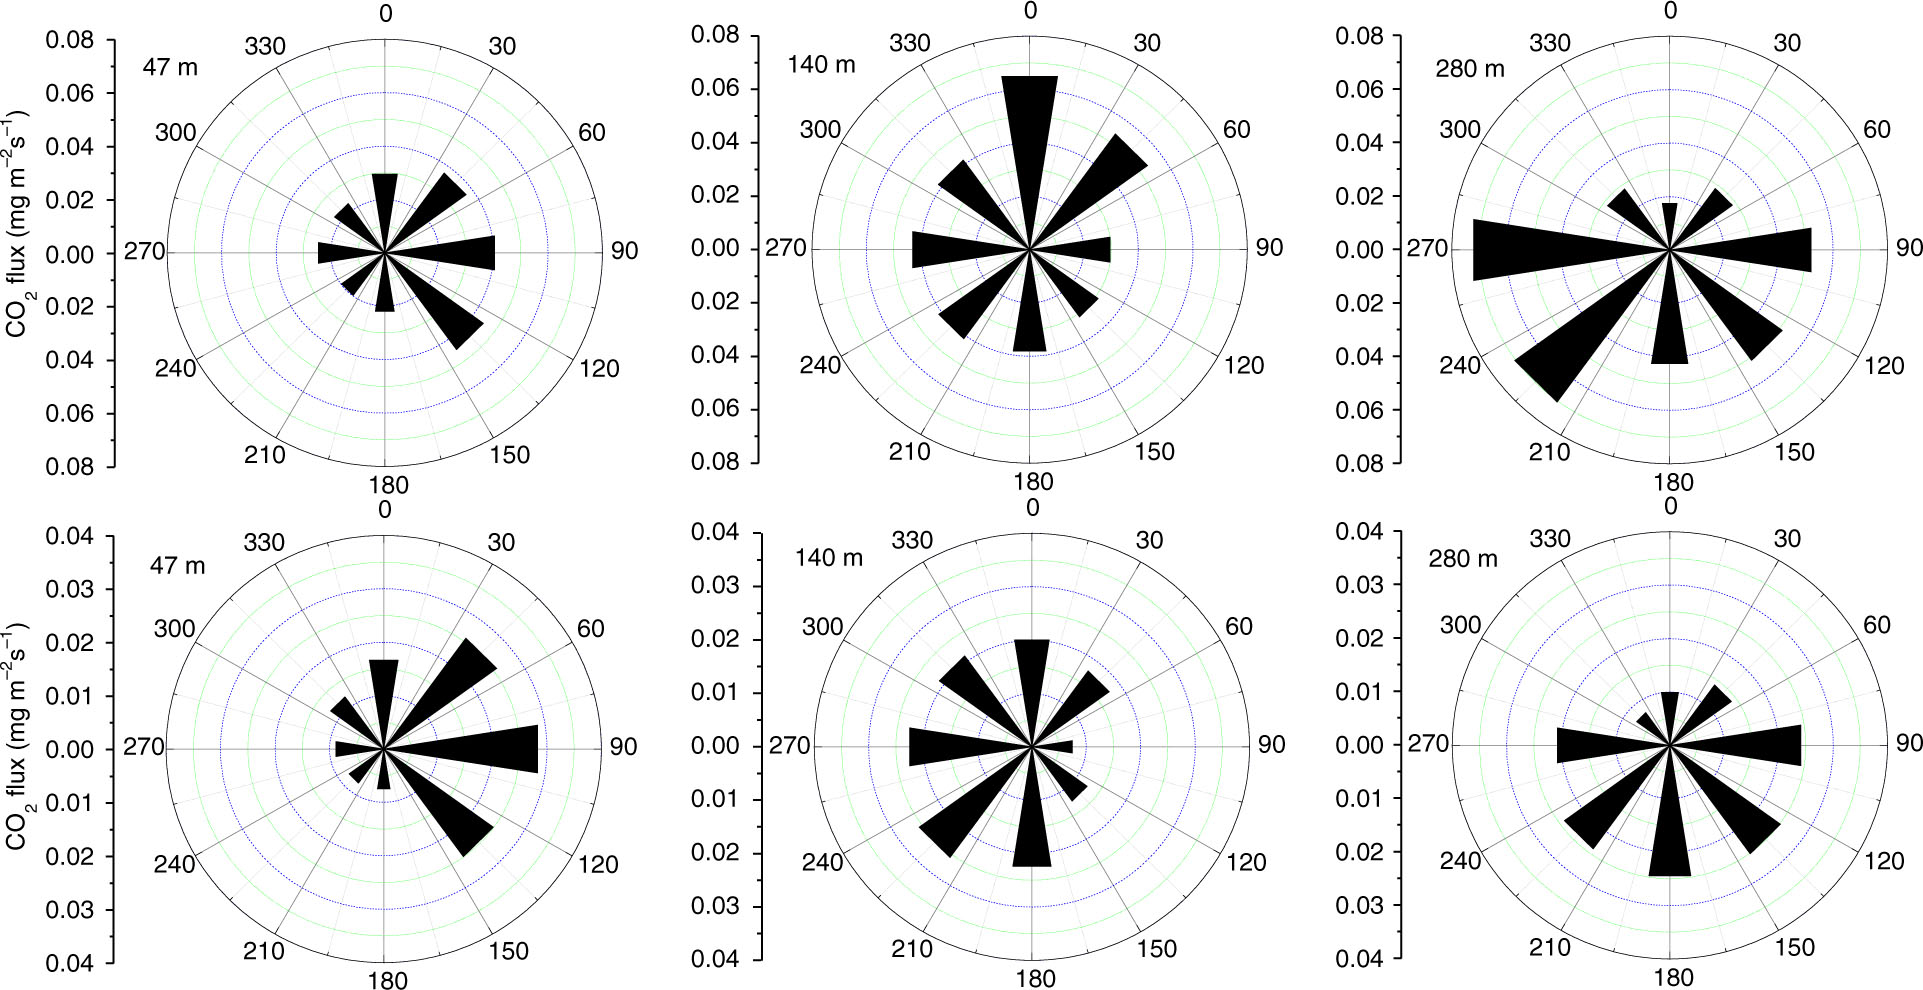
Fig. 3
The mean CO2 flux measured at 47 m (left), 140 m (middle) and 280 m (right) and wind directions in winter (upper row) and in summer (lower row) by wind direction (45° intervals).
Table 3
The wind frequencies in different seasons by wind direction for 47-, 140- and 280-m measurement height
Table 4
Seasonal CO2 fluxes budget estimated at 47-, 140- and 280-m measurement height
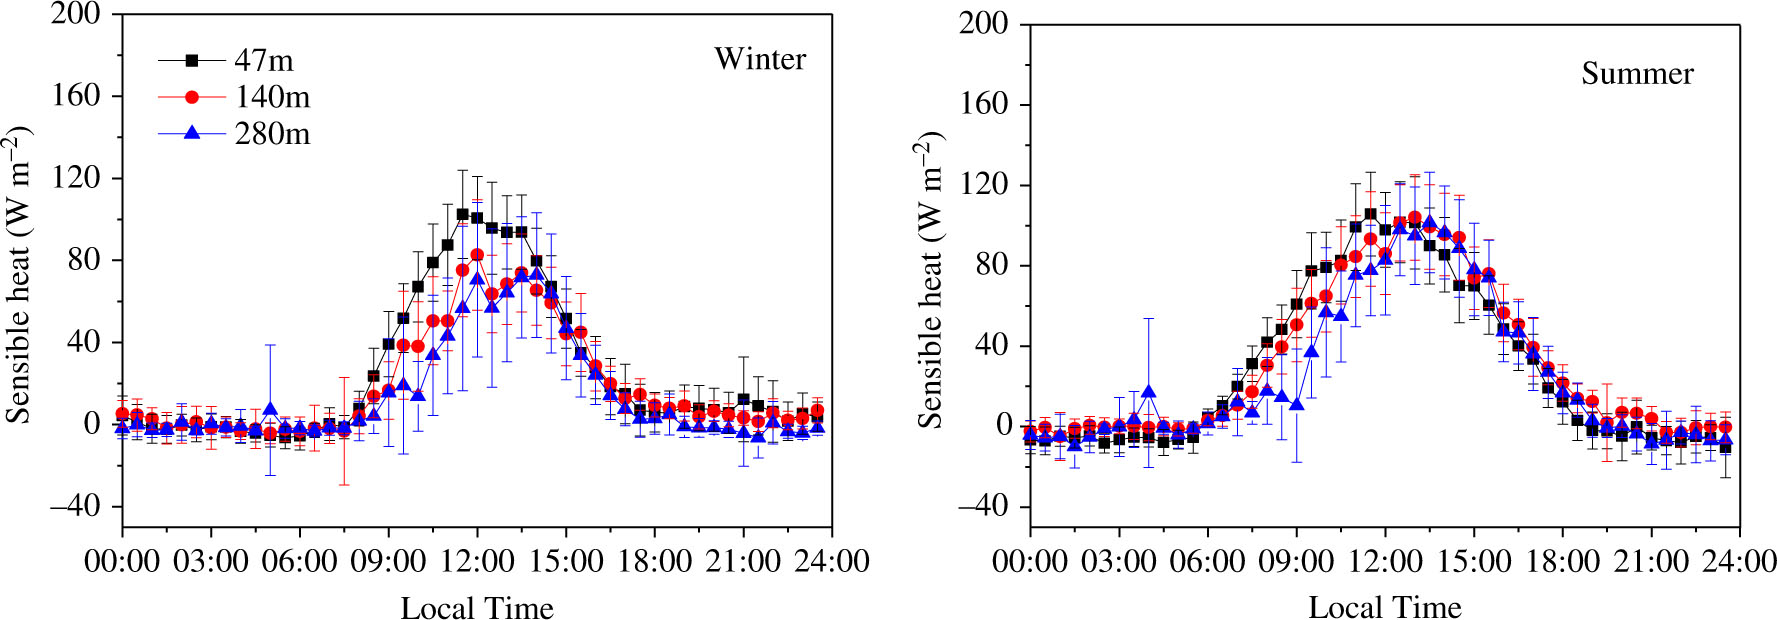
Fig. 4
The diurnal course of the average seasonal sensible heat in the winter and summer measured at three heights (47, 140 and 280 m). The vertical line indicates the standard deviation.
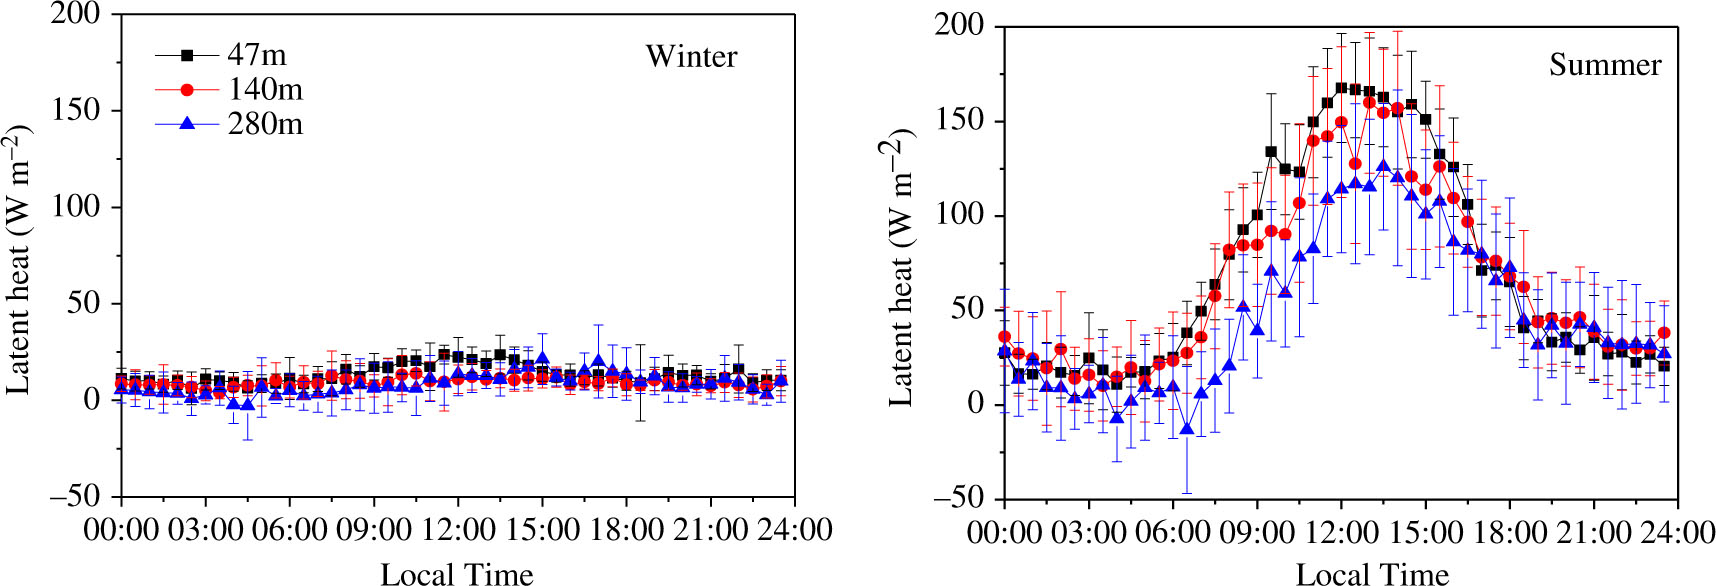
Fig. 5
The diurnal course of the average seasonal latent heat in the winter and summer measured at three heights (47, 140 and 280 m). The vertical error bars indicate the standard deviation.
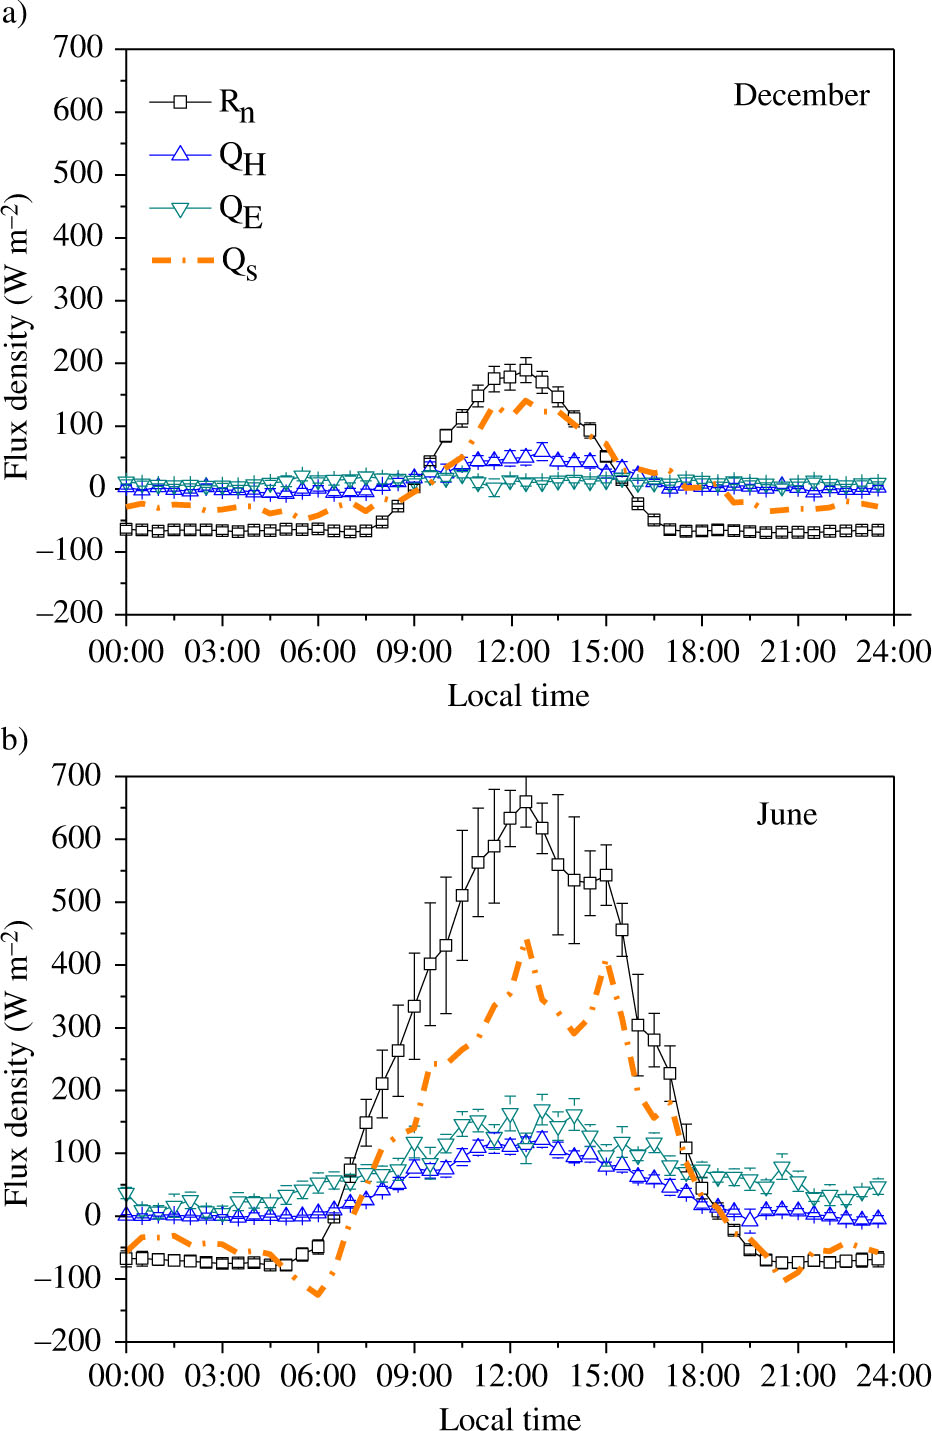
Fig. 6
The diurnal course of the average monthly energy fluxes in (a) December and (b) June at a 140-m height. The vertical line indicates the standard deviation.
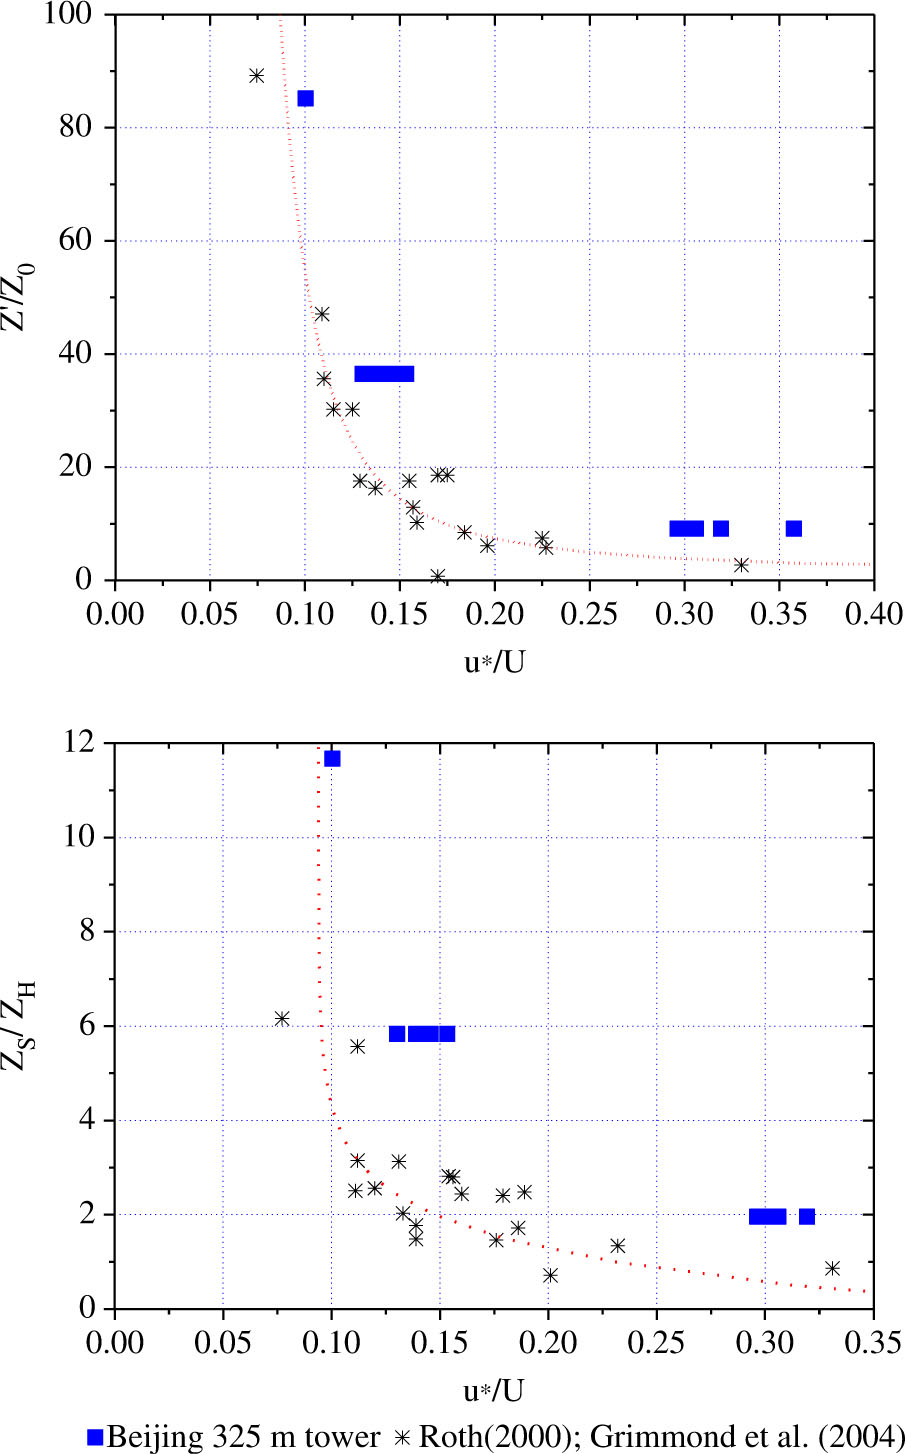
Fig. 7
Variation of the drag coefficient for neutral conditions with non-dimensional height (a) and (b) z S/z H . The line on the left is eq. (5), and the line on the right is eq. (6). The squares are data from this study, and the asterisks are data reported by Roth (2000) and Grimmond et al. (2004).
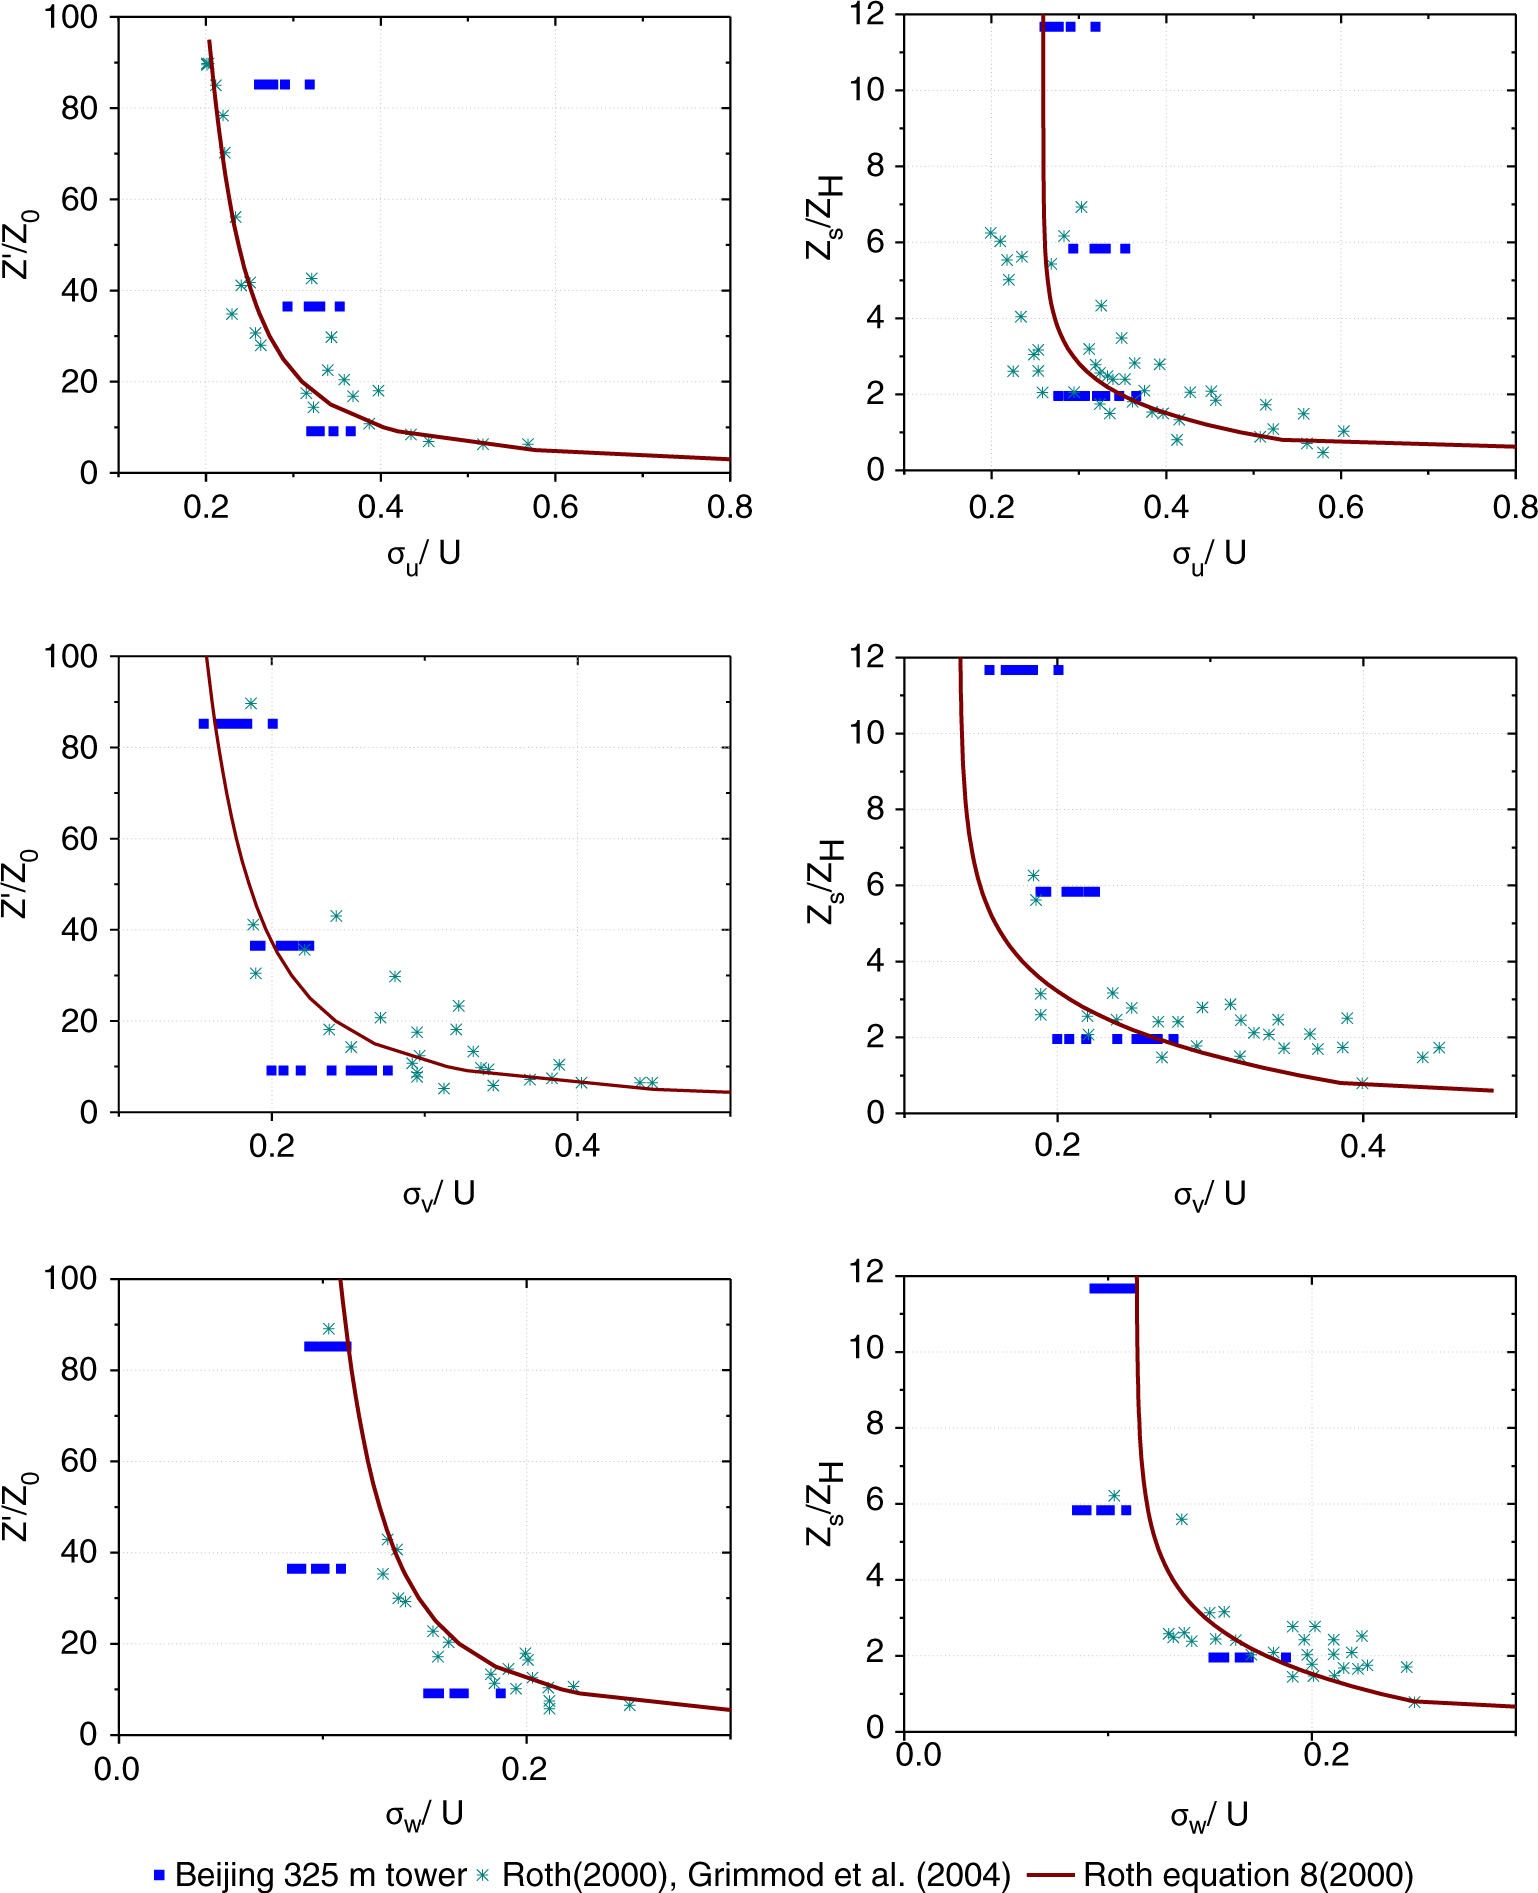
Fig. 8
The variation of (top), (middle) and (bottom) for neutral conditions with non-dimensional height (left) and z/z H (right). The line on the left is from Roth (2000) based on theory, that is, his eq. (8), and the line on the right is from his empirical equation (9).
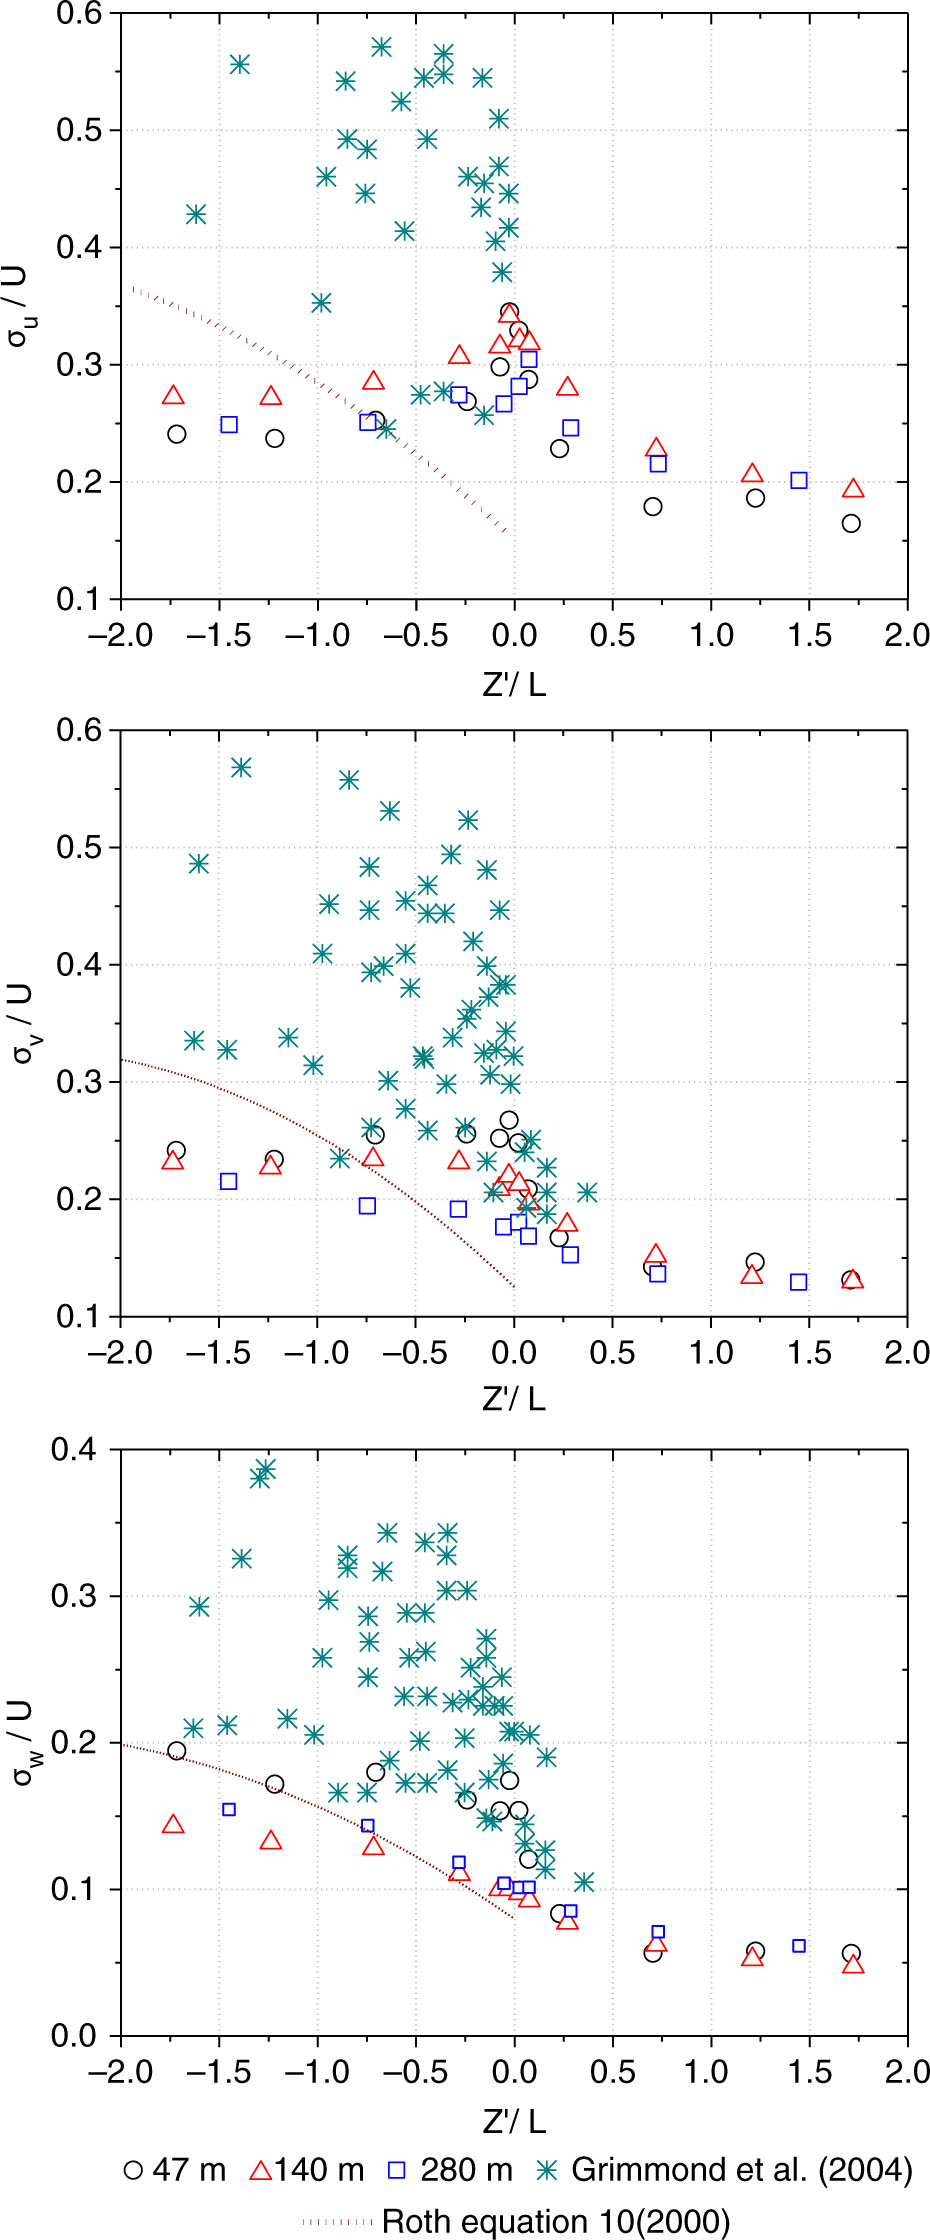
Fig. 9
Variation of the turbulence intensity with stability. The data from this study are the means for each 0.5 interval of stability. Dot-dash lines are from Roth [2000, eq. (10)].