
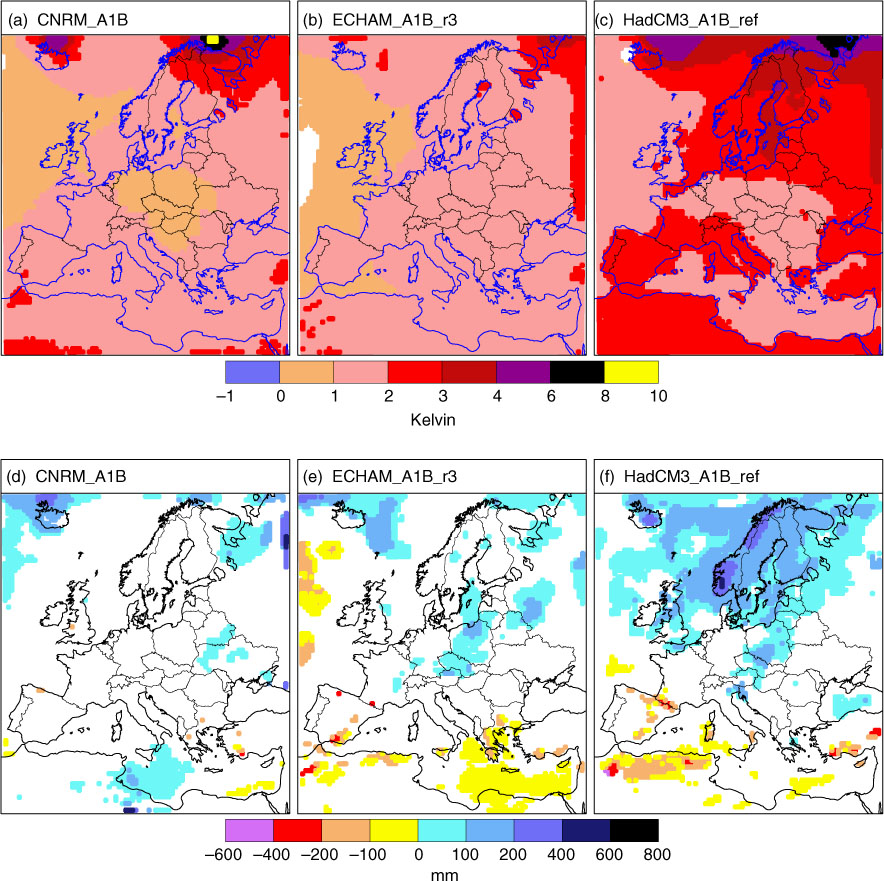
Fig. 1
Change in annual mean 2 m temperature (top), and annually accumulated surface precipitation (bottom) from 1990–2009 to 2040–2059. Only changes significant at the p=0.05 level are shown.
Table 1
Comparison of MATCH model results with observations collected during 1995–2005
SO2NO2HNO3NH3SulphateNitrateAmmoniumSulphateNitrateAmmoniumSulphateNitrateAmmoniumPrec (mm/yr)Mean Observations1.022.110.210.830.740.451.144073143660.510.370.43892 CNRM_A1B0.671.300.100.440.810.451.066054014200.740.570.58918 HadCM3_A1B_ref0.671.350.090.430.750.431.036464194470.740.520.54987 ECHAM5_A1B_r30.611.290.090.400.660.380.936174124400.640.450.471104RMSE CNRM_A1B0.581.340.130.690.410.280.914352022700.430.290.37421 HadCM3_A1B_ref0.581.350.140.680.370.260.904862203010.400.220.35496 ECHAM5_A1B_r30.581.330.130.660.340.240.844352012810.320.180.30534Bias % CNRM_A1B−34−38−53−4680−74827145051332 HadCM3_A1B_ref−34−36−57−470−4−1058332245382310 ECHAM5_A1B_r3−39−39−58−51−11−15−185131202420823Spatial corr. CNRM_A1B0.690.740.320.680.770.820.750.600.500.470.830.770.730.62 HadCM3_A1B_ref0.740.740.230.670.800.840.750.620.490.490.850.740.710.72 ECHAM5_A1B_r30.680.730.170.670.800.830.740.660.550.520.860.760.710.78#Stations7153151156252467666675757562
[i] Model running on RCP4.5 emissions for 2000 and meteorology from RCA3 for the period 1990–2009. Mean and RMSE are in the units given in the table header, bias is in per cent of the observations, spatial correlation (Spearman correlation coefficient) and number of stations are dimensionless.
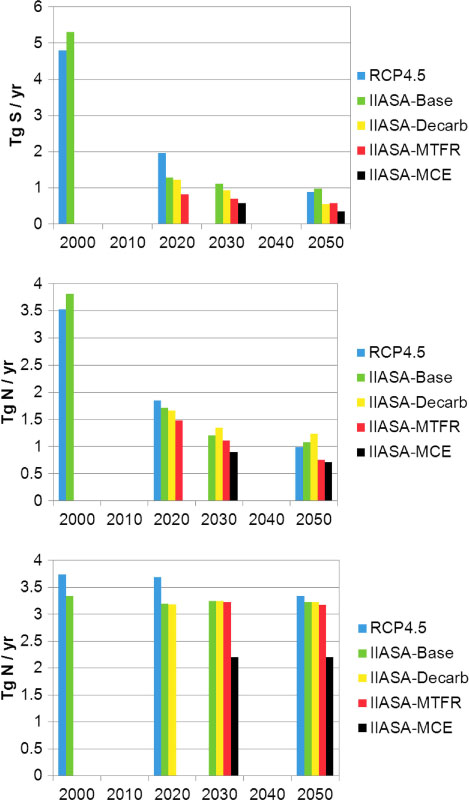
Fig. 2
Annual anthropogenic emissions for EU-27 of sulphur (top), nitrogen oxides (middle) and ammonia (bottom) for RCP4.5 and four different scenarios developed by the International Institute for Applied Systems Analysis (IIASA). Base corresponds to implementation of current legislation. Decarb correspond to an 80% reduction in greenhouse gas emissions in 2050 and concurrent reductions in sulphur and nitrogen emission. MTFR corresponds to Maximum Technically Feasible Reduction and MCE corresponds to Maximum Control Efforts.
Table 2
Atmospheric turnover time (t 0), average mass and deposition fluxes in the modelling domain during different periods
Constant emissionsVariable emissionsConstant emissionsVariable emissionsConstant emissionsVariable emissions
1990–20092040–20591990–20092040–20591990–20092040–20591990–20092040–20591990–20092040–20591990–20092040–2059SOXa t0 (days)2.93.13.13.32.52.6*2.62.9***2.72.9*2.63.0*** Mass (Gg S)6567*8131***5456**6927***5961*7028*** Emis (Tg S yr−1)9.99.912.13.6***9.99.912.13.6***9.99.912.13.6*** Drydep (Tg S yr−1)1.71.72.30.8***1.61.62.20.8***1.61.72.00.7*** Wetdep (Tg S yr−1)7.06.87.82.9***6.96.77.62.9***7.16.98.63.0***NOYb t0 (days)3.23.33.94.3***3.13.13.84.2***3.23.23.33.8*** Mass (Gg N)54546039***50515638***53535436*** Emis (Tg N yr−1)6.36.36.53.1***6.36.36.53.1***6.36.36.53.1*** Drydep (Tg N yr−1)1.81.91.81.0***1.701.75*1.70.9***1.71.8*1.81.0*** Wetdep (Tg N yr−1)4.34.33.82.4***4.34.33.82.3***4.34.34.32.5***NHXc t0 (days)1.92.01.91.7***1.51.61.61.4***1.61.8*1.71.5*** Mass (Gg N)29302824**23242320**25262522*** Emis (Tg N yr−1)6.26.25.95.76.26.25.95.76.26.25.95.7 Drydep (Tg N yr−1)2.22.32.12.4*2.12.22.02.3*2.22.22.02.3* Wetdep (Tg N yr−1)3.73.73.63.2*3.73.73.63.3*3.83.73.73.3**
[i] t 0 is defined as the 20-year mean of average mass in model domain during each month divided by the sum of all dry and wet deposition during that month. Values for 2040–2059 significantly different than the corresponding value in 1990–2009 at p=0.05 are marked with one star, for p=0.01 with two stars and for p=0.001 with 3 stars.
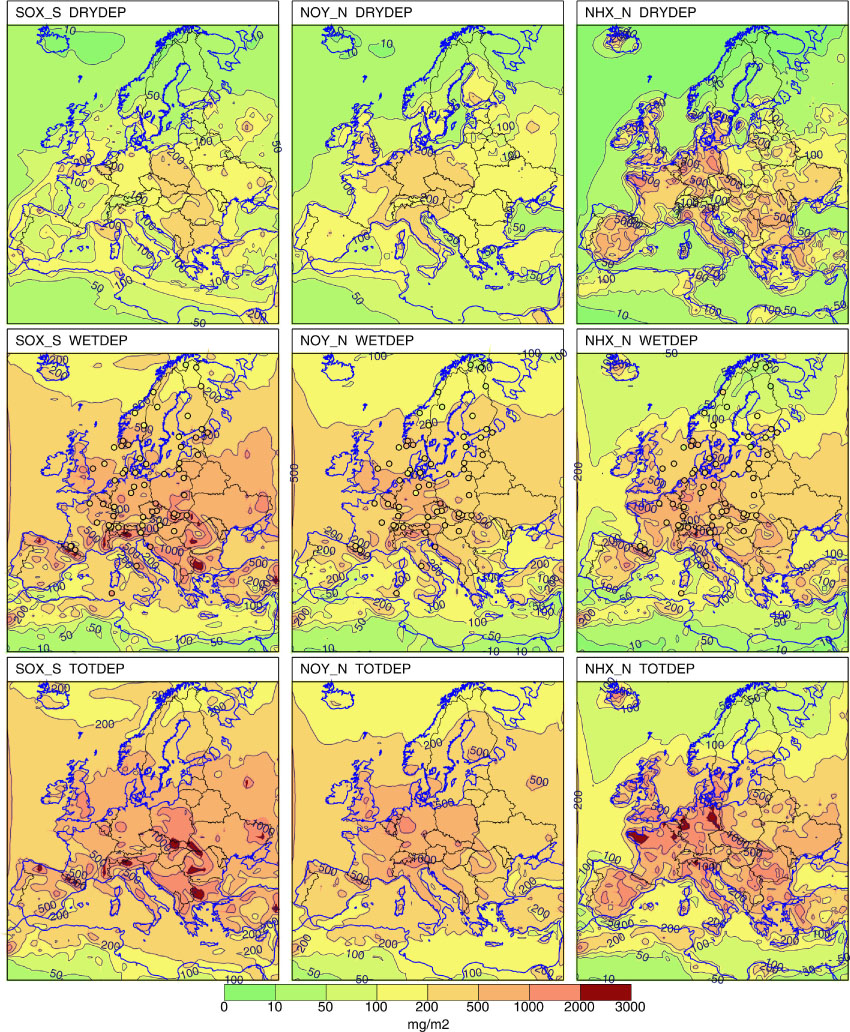
Fig. 3
Average deposition of sulphur (left), oxidised nitrogen (middle) and reduced nitrogen (right) for the period 1990–2009 using HadCM3_A1B_ref meteorology and emissions from RCP4.5 held at their 2000 values. Top: Dry deposition. Middle: Wet deposition. Bottom: Sum of dry and wet deposition. Coloured circles indicate the observed wet deposition values at the stations used in the model evaluation given in Table 1. Units: mg S/N m−2 yr−1.
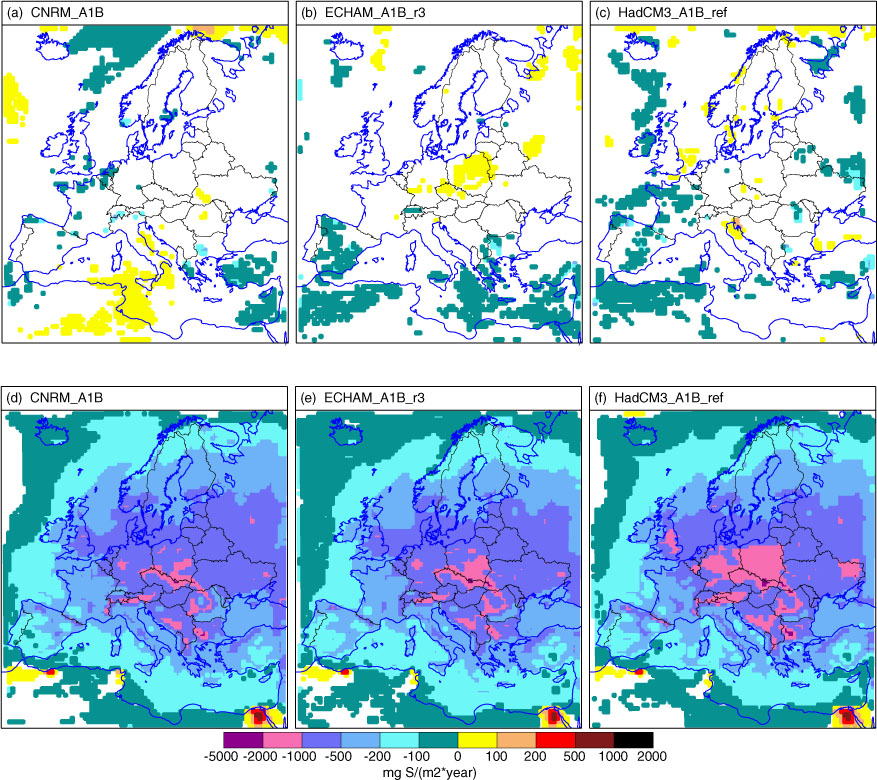
Fig. 4
Change in total deposition of sulphur from 1990–2009 to 2040–2059. Top: Only changing climate. Bottom: Changing climate and changing emissions. Only changes significant at the p=0.05 level are shown.
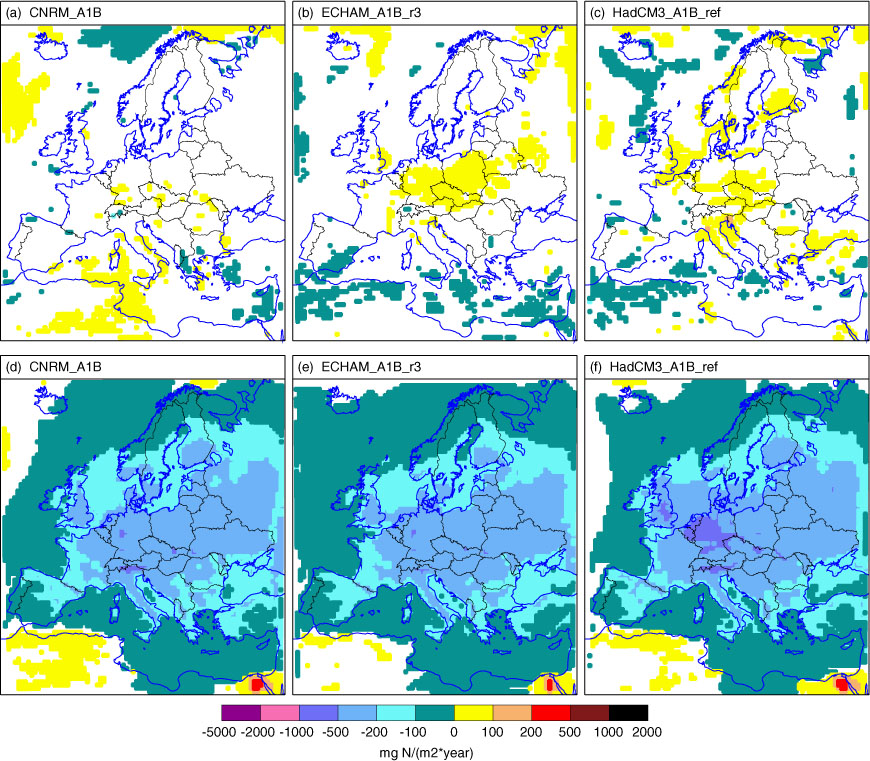
Fig. 5
Change in total deposition of oxidised nitrogen from 1990–2009 to 2040–2059. Top: Only changing climate. Bottom: Changing climate and changing emissions. Only changes significant at the p=0.05 level are shown.
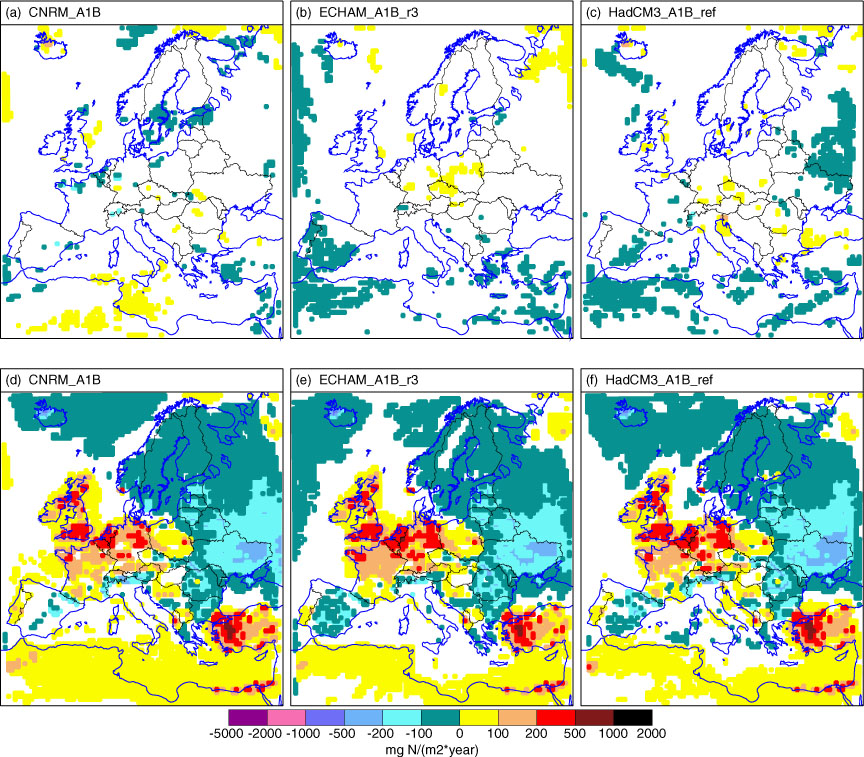
Fig. 6
Change in total deposition of reduced nitrogen from 1990–2009 to 2040–2059. Top: Only changing climate. Bottom: Changing climate and changing emissions. Only changes significant at the p=0.05 level are shown.
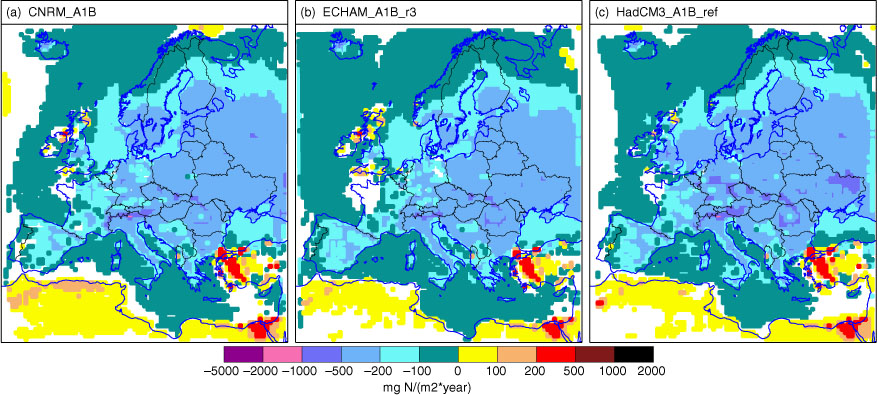
Fig. 7
Change in total deposition of fixed nitrogen (oxidised- plus reduced nitrogen) from 1990–2009 to 2040–2059 following changes in climate and emissions. Only changes significant at the p=0.05 level are shown.