
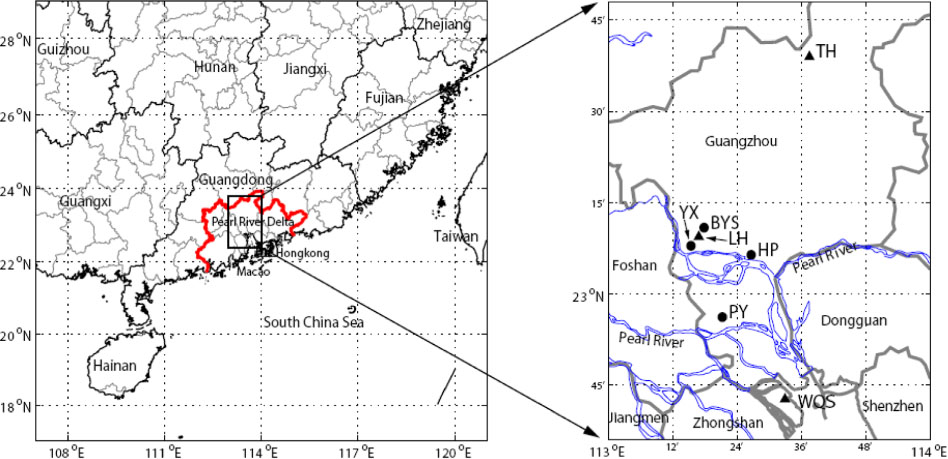
Fig. 1
Locations of four precipitation chemistry monitoring sites since 1994 (close cycle symbols, YX, BYS, HP and PY) and three air quality monitoring sites since 1986 (triangle symbols) in Guangzhou, Southern China. The boundary for the Pear River Delta (left panel) and for the rivers (right panel) is coloured in red and blue, respectively.
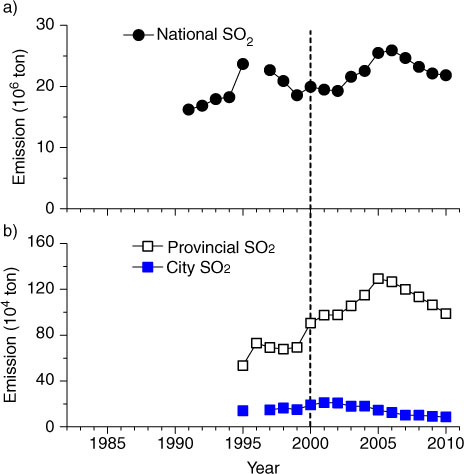
Fig. 2
Annual emissions of SO2 in (a) China and (b) Guangdong Province and Guangzhou city. Data are from Report on the State of the Environment in China (http://jcs.mep.gov.cn/hjzl/zkgb/) for SO2 emissions in China, from Guangzhou Statistical Yearbook (http://data.gzstats.gov.cn/gzStat1/chaxun/njsj.jsp) for SO2 and from Guangdong Environmental Quality Report (http://www.gdepb.gov.cn/hjzlyxx/hbzkgb/200906/t20090615_62862.html) for SO2 emissions in Guangdong province. The dash line indicates when the policy of SO2 emission abatement started. In Guangzhou, SO2 emissions were reduced since 2001.
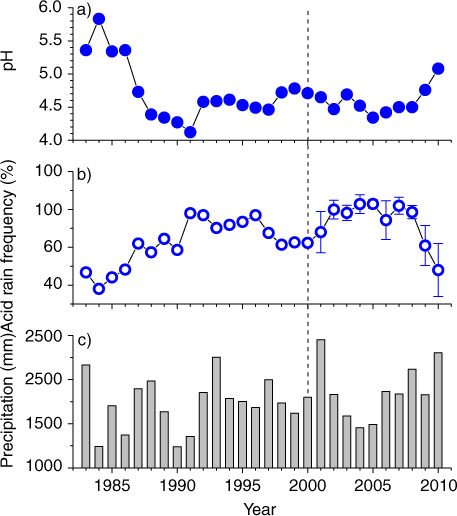
Fig. 3
Annual precipitation (a) pH value, (b) acid rain frequency and (c) precipitation in Guangzhou city since 1983. Mean of four monitoring sites and standard error of mean are presented for the period of 2001–2010. The dash line indicates when the policy of SO2 emission abatement started. In Guangzhou, SO2 emissions were reduced since 2001.
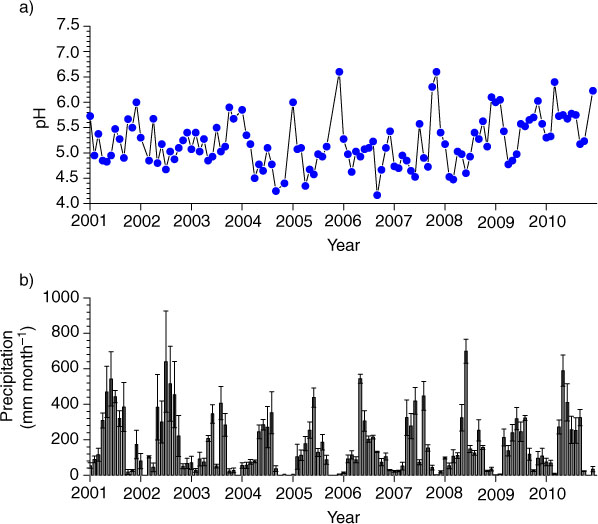
Fig. 4
Monthly mean (a) pH values and (b) precipitation amount in Guangzhou city since 2001.
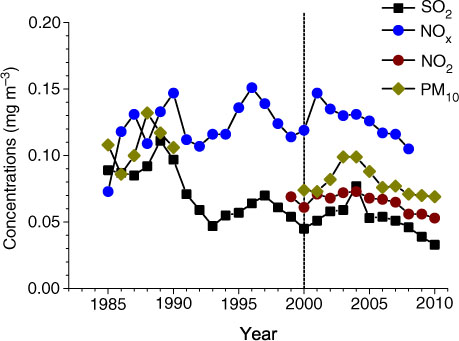
Fig. 5
Long-term trends of annual mean concentrations of major air pollutants in Guangzhou city (three sites in Fig. 1) since 1986. The dash line indicates when the policy of SO2 emission abatement started. In Guangzhou, SO2 emissions were reduced since 2001. Data were supplied by Guangdong Environmental Monitoring Center.
Table 1. Temporal patterns of annual SO2 emissions and annual mean concentrations of major air pollutants
Since 1986Since 2001SO2 emissions in Chinaaincrease0.45<0.001Quadratic0.76<0.001SO2 emissions in GDbquadratic0.83<0.001Quadratic0.79<0.001SO2 emissions in GZbquadratic0.76<0.001Decrease0.95<0.001SO2 concentration in GZcdecrease0.54<0.001Quadratic0.660.009NOx concentration in GZcnsd0.040.26Decrease0.93<0.001NO2 concentration in GZcquadratic0.75<0.001Quadratic0.88<0.001PM10 concentration in GZcdecrease0.49<0.001Quadratic0.420.06
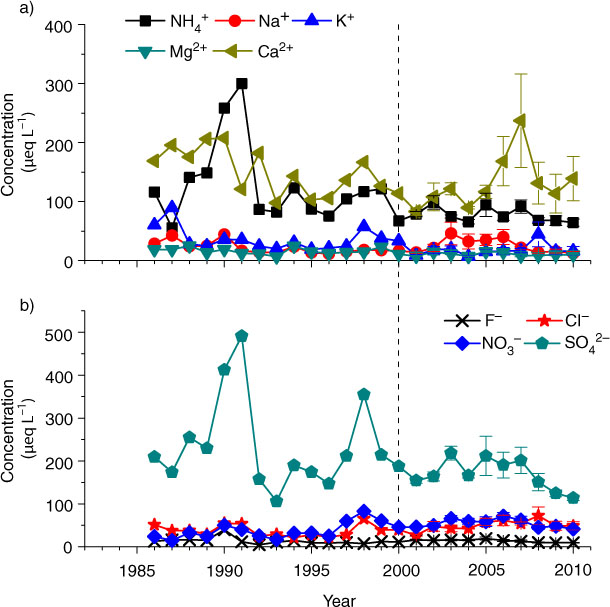
Fig. 6
Long-term trends of annual mean concentrations of major (a) cations and (b) anions in precipitation in Guangzhou city since 1986. Mean of four monitoring sites and standard error of mean are presented for the period of 2001–2010. The dash line indicates when the policy of SO2 emission abatement started. In Guangzhou, the rate of SO2 emissions has reduced since 2001.
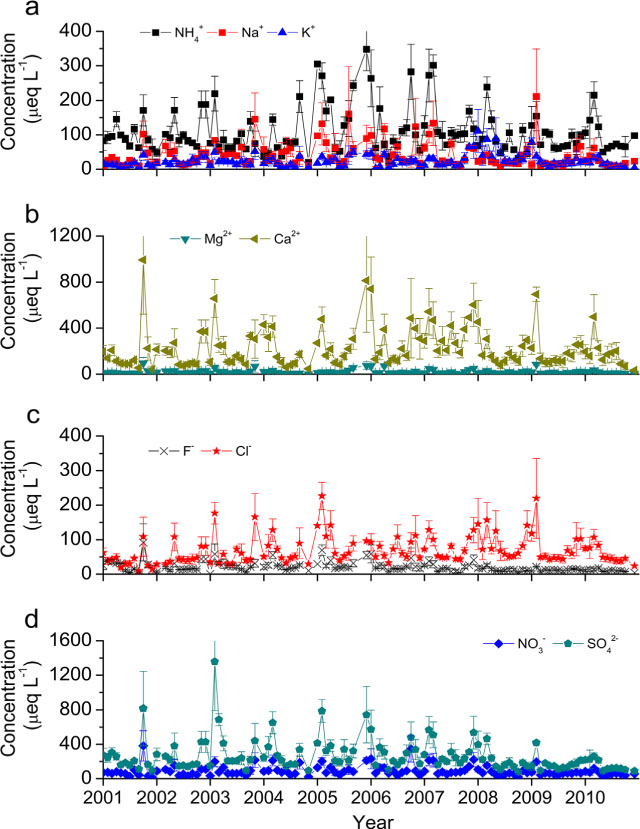
Fig. 7
Monthly mean concentrations of (a) , Na+, K+, (b) Mg2+, Ca2+, (c) F−, Cl−, and (d) , in precipitation in Guangzhou city since 2001.
Table 2. Temporal patterns of precipitation chemistry since 2001a
pHquadratic0.680.007ARF (%)bquadratic0.820.001Annual concentration (µeq L−1)Annual deposition (kg ha−1 yr−1)
nsc0.120.177–Nns0.100.196Na+quadratic0.500.040Nans0.190.183K+ns0.030.294Kns0.060.238Mg2+ns0.100.699Mgns0.110.790Ca2+ns0.160.221Cans0.060.243F−quadratic0.710.006Fns0.110.188Cl−increase0.260.076Clns0.120.171quadratic0.600.016–Nns0.160.137quadratic0.670.008–Sdecrease0.400.003DINns0.130.161
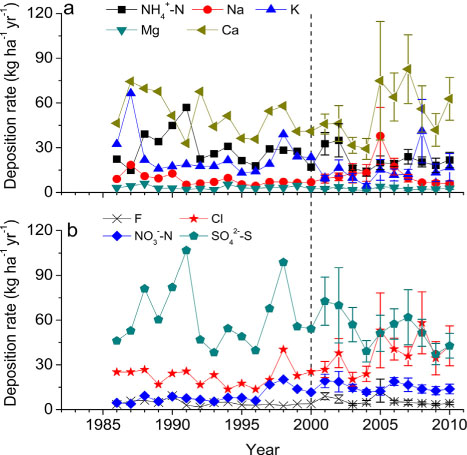
Fig. 8
Long-term trends of annual deposition rates of major (a) cations and (b) anions in precipitation in Guangzhou city since 1986. Mean of four monitoring sites and standard error of mean are presented for the period of 2001–2010. The dash line indicates when the policy of SO2 emission abatement started. In Guangzhou, the rate of SO2 emissions has reduced since 2001.
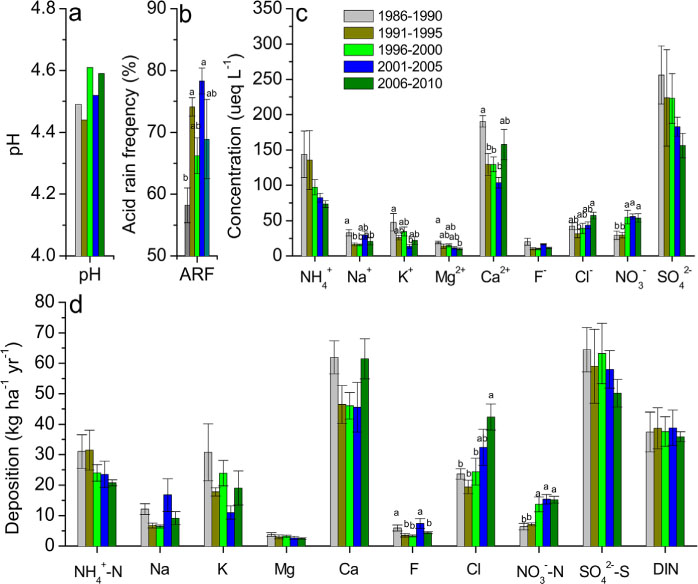
Fig. 9
Five-year means of (a) pH, (b) acid rain frequency, (c) concentrations and (d) annual deposition rates of major cations and anions in precipitation in Guangzhou city since 1986. n=5. Different letters indicate significant differences between periods obtained by one-way ANOVA.
Table 3. Long-term patterns of precipitation chemistry since 1983a
pHquadratic0.45<0.001ARF (%)bquadratic0.55<0.001Annual concentration (µeq L−1)Annual deposition (kg ha−1 yr−1)
decrease0.290.015–Ndecrease0.150.034Na+nsc0.020.533Nans0.030.569K+decrease0.240.007Kns0.090.079Mg2+decrease0.250.006Mgns0.080.085Ca2+ns0.070.107Cans0.040.919F−ns0.010.340Fns0.030.660Cl−increase0.270.012Clquadratic0.48<0.001increase0.350.001–Nquadratic0.53<0.001decrease0.110.053–Sns0.040.180DINns0.040.739
Table 4. Current status of pH, S and N deposition in precipitation in Guangzhou, in comparison with other Chinese cities
North China
Beijing2001–20034546.0118.114.95.320.2Yang et al., 2004 Xi'an20104596.6814.712.02.614.6EANET 2010 Zhengzhou19995286.4111.814.03.417.4Zhao et al., 2001South China
Chongqing20109774.1543.519.210.629.8EANET 2010 Shanghai200510714.4934.212.17.519.6Huang et al., 2008 Xiamen201015304.5713.18.56.214.7EANET 2010 Zhuhai201018574.8511.76.46.212.6EANET 2010 Guangzhou201023035.0842.821.713.835.5This study
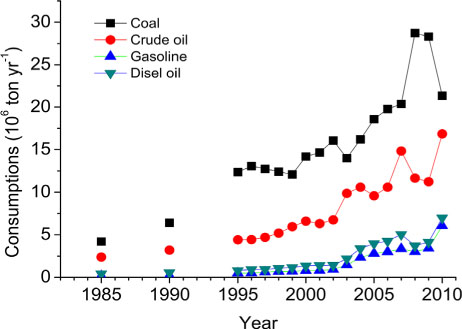
Fig. 10
Fuel consumptions in Guangzhou city from 1985 to 2009. Data are from Guangzhou Statistical Yearbook (http://data.gzstats.gov.cn/gzStat1/chaxun/njsj.jsp).
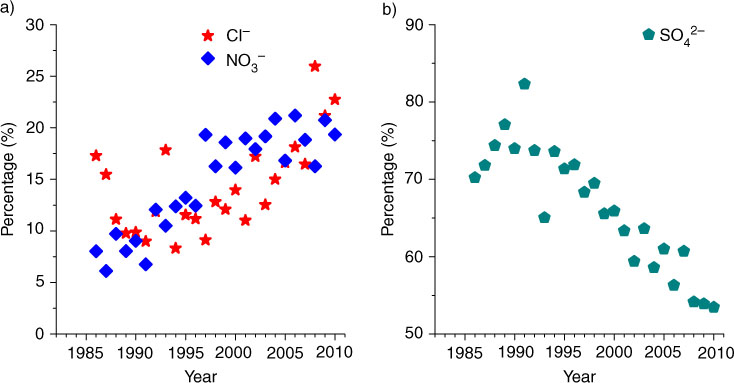
Fig. 11
Long-term trends of proportion of (a) Cl− and and (b) to sum anions in precipitation in Guangzhou city since 1986.