
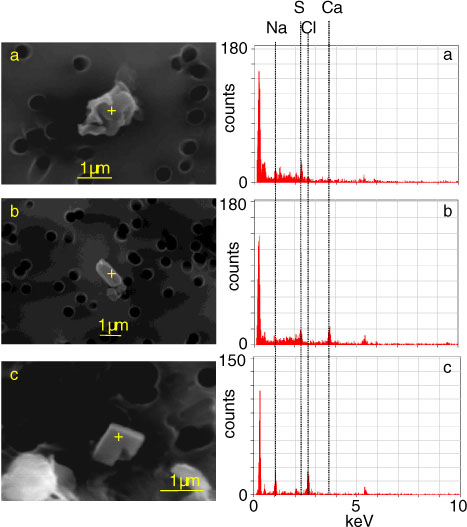
Fig. 1
photomicrographs and elements of typical particles in the filter samples. (a) Sodium sulphate from sample number 226_b1 (see Table 1 for depth of each sample). (b) Calcium sulphate from sample 1193_b1. (c) Sodium chloride from sample 1195_b1. Filters are 13-mm in diameter, made from polycarbonate, with a pore size of 0.4 µm (Advantec, K040A013A). All filters were coated with platinum for 30 s with a thickness of 10 nm using magnetron sputtering (Vacuum Device, MSP-10). The images were taken with the following settings: scanning time 80 s; space resolution 1280×960 pixels; spot size 45.
Table 1
Sample depth, age, total measured numbers and average size of non-volatile particles in 11 ice samples
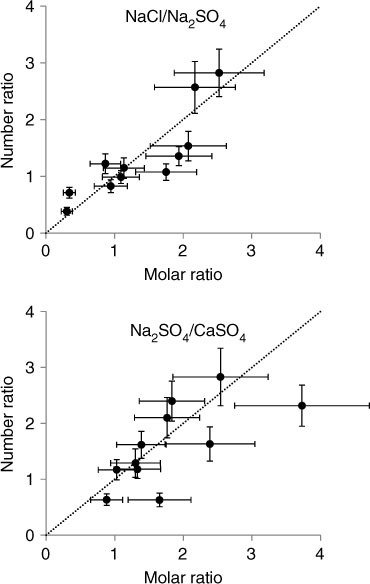
Fig. 2
Number and molar ratios of sodium and calcium compounds in 11 TD samples. (top) NaCl/Na2SO4. (bottom) Na2SO4/CaSO4. Dotted lines show the 1:1 relation. Errors for the number ratio were calculated using the method in Iizuka et al. (2009), whereas those for mass ratio used the method in Iizuka et al. (2012b).
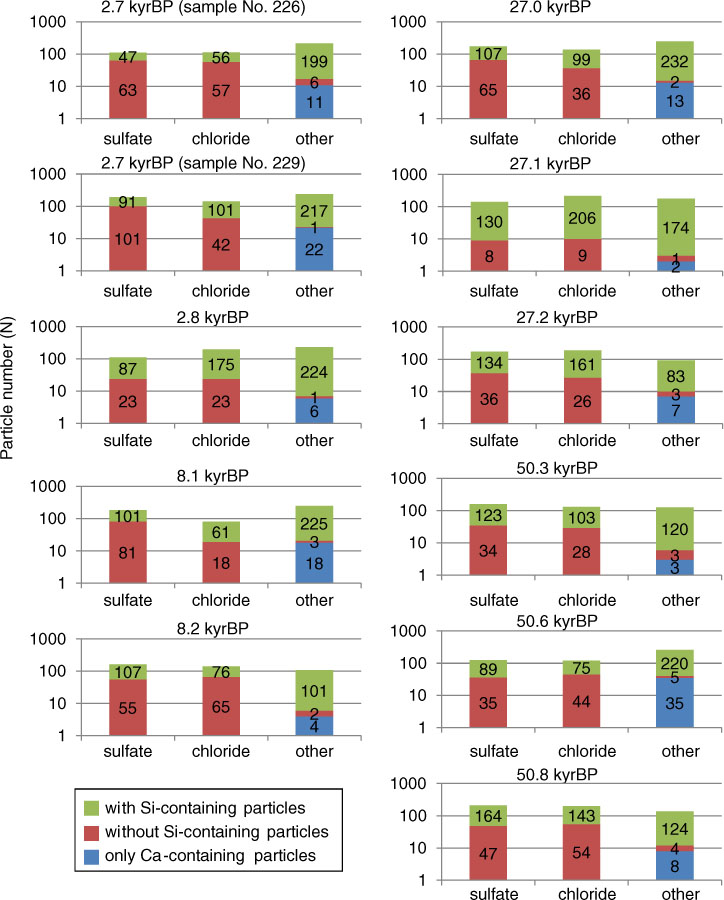
Fig. 3
Frequencies of the elemental compositions in non-volatile (post-sublimation) particles from the TD core. ‘sulphate’ and ‘chloride’ bars mean S- and Cl-containing particles. ‘Other’ means without sulphate and chloride particles. The green section indicates particles with Si, whereas red indicates without Si. The blue section, a special case of the red section, indicates Ca (or Ca and O) detected particles without Si, Al, S, Cl, Na and Mg. Numbers on the bars are the number of particles for the corresponding colour. The logarithmic scale is used to distinguish between blue and red sections.
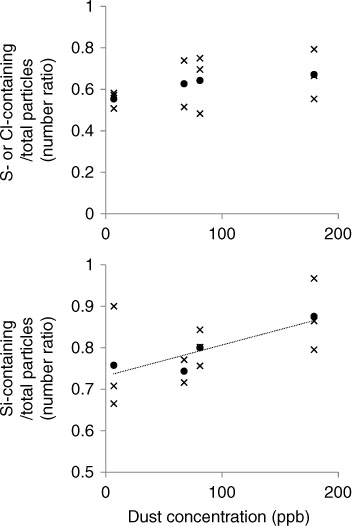
Fig. 4
Number ratios of particles with S or Cl and particles with Si for a range of dust concentrations. (top) Ratio of particles with S or Cl to total particles. (bottom) Ratio of particles with Si to total particles. Crosses are data for the 11 samples, and the black circles are averaged values of every four stages. The correlation coefficient of the regression line in Fig. 4 bottom is 0.80 (no significance level given as there were only four points).
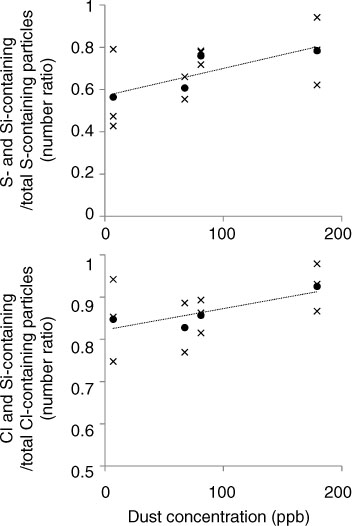
Fig. 5
Same as Fig. 4 except for particles with both S and Si and particles with both Cl and Si. (top) Ratio of particles with both S and Si to total particles. The regression-line correlation coefficient is 0.72. (bottom) Ratio of particles with both Cl and Si to total particles. The corresponding correlation coefficient is 0.73.
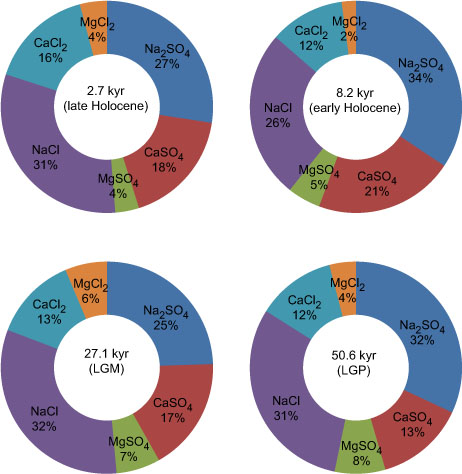
Fig. 6
Sulphate and chloride compounds at 2.7, 8.2, 27.1 and 50.6 kyrBP in TD ice samples. The early and late Holocene data are averages of two and three samples. For the two LGP stages (27 and 50 kyr BP) the averages are over three samples each.
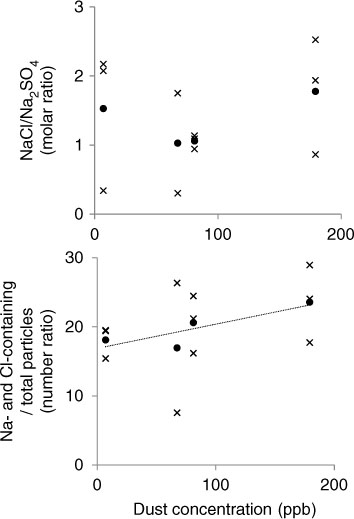
Fig. 7
Same as Fig. 4 except for the molar ratio of NaCl/Na2SO4 and the particles with both Na and Cl. (top) Molar ratio of NaCl/Na2SO4. (bottom) Ratio of particles with both Na and Cl to total particles. The correlation coefficient of the regression line is 0.72.