
Table 1. Instruments used in these studies
Differential Mobility Particle Sizer (DMPS)Aerosol number concentration (Nacc)Cloud Droplet Probe (CDP)Cloud droplet number concentration (Nd)Liquid water content (LWC)Cloud droplet effective radii (Reff)Present weather Sensor (Vaisala FD12P)Visibility and precipitation intensityCeilometer (Vaisala CT25 K)Cloud base height Detection of multiple cloud layersMODerate resolution Imaging Spectroradiometer (MODIS)Cloud optical thickness (COT)Cloud droplet effective radii (Reff)Liquid water path (LWP)Cloud droplet number concentration (Nd)
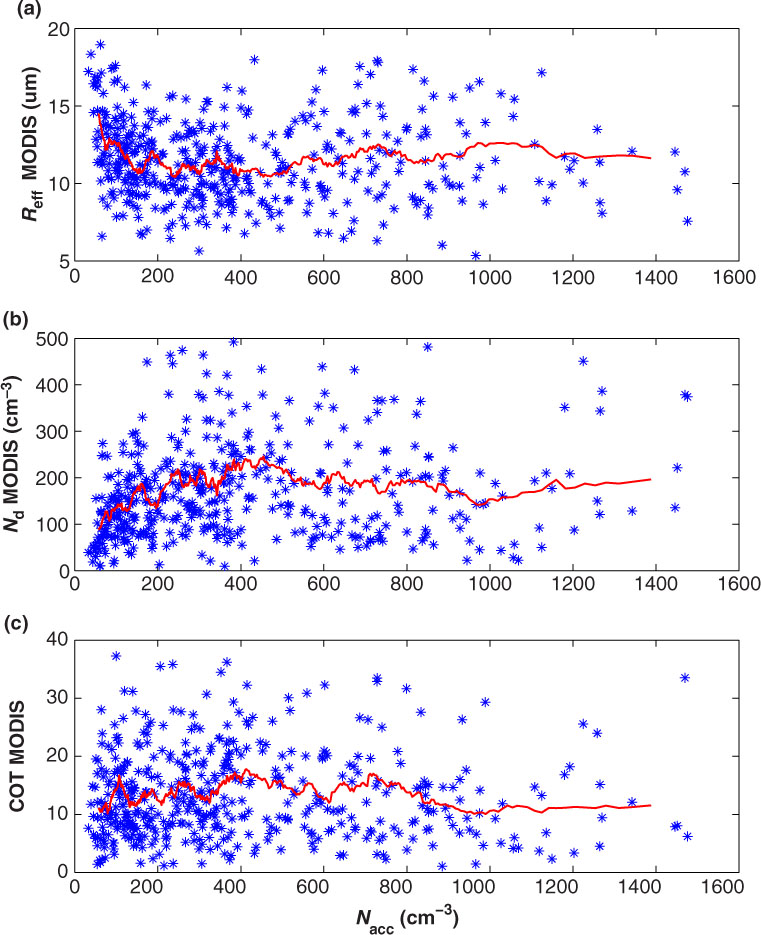
Fig. 1
The effect of accumulation mode particle number concentration on effective radii, (a), cloud droplet number concentration (b) and cloud optical thickness (COT) (c) retrieved from Moderate Resolution Imaging Spectroradiometer (MODIS) during 2006–2011. Red lines are the 30-point running mean. Our category III data are used here.
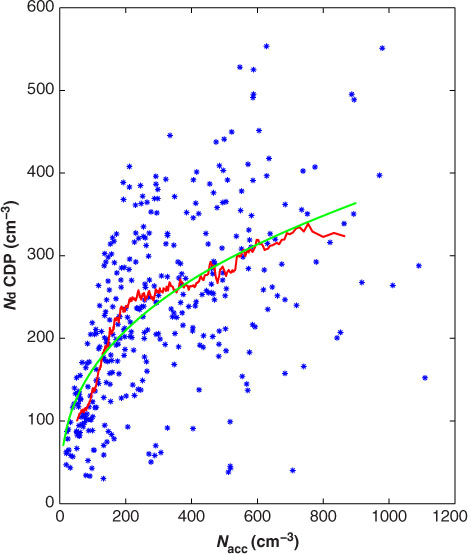
Fig. 2
Cloud droplet number concentration as a function of accumulation mode aerosol number concentration from Puijo station between 2006 and 2011. The red line is a 30-point running mean and the green line is a fit based on eq. (1).
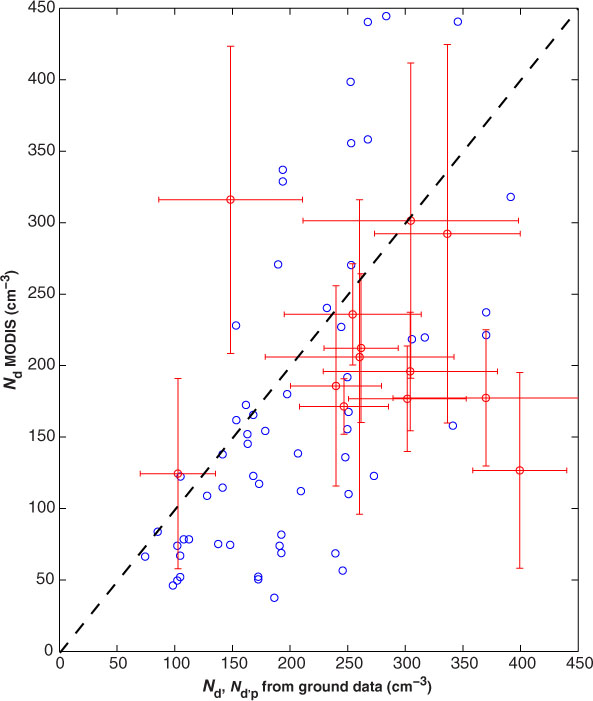
Fig. 3
Moderate Resolution Imaging Spectroradiometer (MODIS)-retrieved N d for categories I and II versus N d or N d,p from Puijo station, as measured from the Cloud Droplet Probe (CDP) (red, N d) and estimated from eq. 1 (blue, N d,p), respectively. The vertical bars for the category I MODIS data show the standard deviations over the 5×5 km areas combined with the Moderate Resolution Imaging Spectroradiometer (MODIS) measurement error. The horizontal bars show the CDP standard deviation over the 5-minute averaging period.
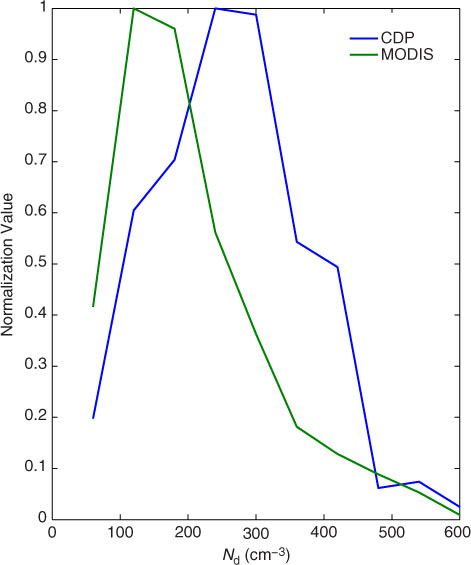
Fig. 4
Probability distributions of cloud droplet number concentrations from in situ Cloud Droplet Probe (CDP) measurements and from Moderate Resolution Imaging Spectroradiometer (MODIS) for the time 2006–2011. Both coincident and non-coincident CDP measurements and MODIS data are used here. Blue line denotes CDP and green line denotes MODIS.