
1. Introduction
The bomb radiocarbon signal in atmospheric carbon dioxide (CO2) has been used as transient tracer in numerous applications, for example, to: (1) study the dynamics and transport processes in the atmosphere, hydrosphere and biosphere (e.g. Czeplak and Junge, 1974; Oeschger et al., 1975; Meier-Reimer and Hasselmann, 1987; Dörr and Münnich, 1986; Johnston, 1989; Trumbore, 2000; 2009); (2) constrain fluxes in the global carbon cycle (e.g. Siegenthaler et al., 1980; Randerson et al., 2002; Naegler, 2009; Naegler and Levin, 2009; Levin et al., 2010); and also (3) for dating of young organic material and in forensic studies (e.g. Wild et al., 2000; Spalding et al., 2005; Ubelaker et al., 2006). Common basis of these investigations are precise atmospheric 14CO2 observations, which serve as an input or reference signal that is transferred into the carbon reservoir under investigation or that are used for dating at annual resolution. The radiocarbon measurement records available for Central European background stations, such as Vermunt, Austrian Alps; Schauinsland, Black Forest, Germany; and Jungfraujoch, Swiss Alps, covering the period from 1959 onwards (Levin and Kromer, 2004), have served as such a reference for applications in mid-latitudes of the Northern Hemisphere. Here, we present an extension of our measurements from the two stations Schauinsland and Jungfraujoch. These data are not only of importance for the above-mentioned applications, but Jungfraujoch measurements are also often used to define the European clean air reference when estimating regional fossil fuel CO2 levels at polluted stations in Europe (e.g. Levin et al., 1980; Levin et al., 2003; Rakowski et al., 2004; Van Der Laan et al., 2010; Levin et al., 2011). In the following, we present and discuss the data covering the past decade (2000 to 2012). Earlier measurements are available in Levin and Kromer (2004), and in digital form under http://www.iup.uni-heidelberg.de/institut/forschung/groups/kk/Data_html. The new data presented here will be available at the same link.
2. Sampling sites and methods
The high-alpine monitoring station Jungfraujoch is located in the Swiss Alps (JFJ, Berner Oberland, 46°33′N, 7°59′E) at an elevation of 3450 m a.s.l. This high-elevation Global Atmosphere Watch (GAW) station is only occasionally – for example, during strong convective mixing conditions – influenced by regional CO2 sources (e.g. Tucson et al., 2011), but for most of the time it samples air from the free troposphere over Europe (Levin et al. 2008). The Schauinsland observatory in the Black Forest, situated on a mountain ridge at an elevation of 1205 m a.s.l. (SIL, 47°55′N, 7°54′E), is located at the eastern boarder of the upper Rhine valley and normally samples free tropospheric air during night. During the day and particularly in summer, Schauinsland station is frequently influenced by boundary layer air and moderate pollution events from the industrialised and populated Rhine valley (Schmidt et al., 2003). At both stations, JFJ and SIL, 2-week integrated CO2 samples are collected by chemical absorption in carbonate-free concentrated sodium hydroxide solution (Levin et al., 1980). In the Heidelberg laboratory, CO2 is extracted from the basic solution with phosphoric acid; samples are then purified over activated charcoal and measured by conventional counting (Kromer and Münnich, 1992). All Δ14CO2 data presented here are reported as fractionation-corrected permil-deviations from Oxalic Acid standard activity corrected for decay (Stuiver and Polach, 1977); the measurement precision of individual samples is generally ±2‰ (1 sigma).
3. Results
The long-term decrease of Δ14C in atmospheric CO2 observed since the 1960s has continued in the last decade, albeit at a decreasing rate of only about 3‰ per year in 2007–2011. This decreasing trend reduces the precision of bomb 14C dating compared to the preceding decades. The Δ14CO2 decline today is driven primarily by the on-going input of 14C-free fossil fuel CO2 into the global atmosphere, as the atmospheric bomb 14C perturbation of the early 1960s has been almost fully equilibrated with surface ocean water and the terrestrial biosphere (Levin et al., 2010; Graven et al., 2012). Figure 1a shows individual Δ14C data measured on the Jungfraujoch samples. In most years we observe a seasonal variation with minimum Δ14C values in winter and spring and maxima in summer and autumn. The solid line in Fig. 1a is a fit curve calculated according to Nakazawa et al. (1997) through monthly mean Jungfraujoch data (Table 1). Levin et al. (2010) could show with the carbon cycle box model GRACE that this seasonality is mainly due to seasonal variations of the share of 14C-elevated stratospheric air in the northern hemispheric troposphere and to a seasonally changing amount of fossil fuel CO2 in the troposphere. At Schauinsland station (Fig. 1b), the seasonal variation of Δ14C is larger by more than a factor of two compared to Jungfraujoch data. This is due to the closer proximity of the Schauinsland site to the fossil fuel sources, for example, in the Rhine valley. However, the summer values at Schauinsland are very close to those observed at Jungfraujoch, indicating that in summer European fossil fuel CO2 emissions are smaller and diluted into a higher mixed layer depth than in winter (Levin et al., 2003).
Fig. 1.
Δ14CO2 trends in background air over Europe 2000–2012. (a) Individual data from Jungfraujoch with 1σ error bars together with a harmonic fit curve calculated through the monthly mean data; the outlier in spring 2000 is a contaminated sample and is not included in the monthly mean values of Table 1, (b) Schauinsland monthly means in comparison with the Jungfraujoch fit curve from (a) and May–August (spring and summer) mean values with 1σ standard deviation of the four monthly values.
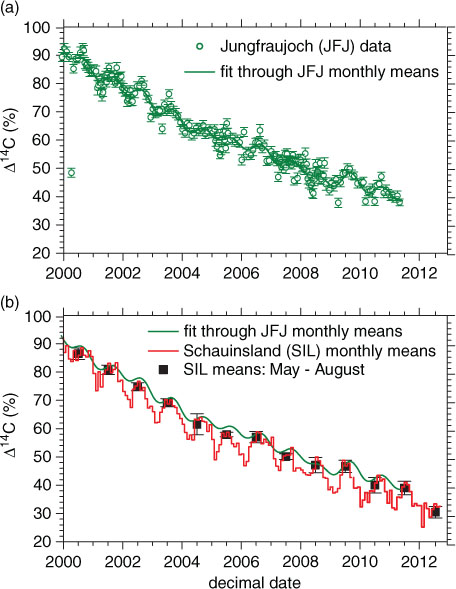
Table 1. Monthly mean Δ14CO2 data from Jungfraujoch and Schauinsland as well as monthly values from the fitted curve through Jungfraujoch data. Last column gives spring and summer mean values (including 1 sigma standard deviations of the monthly averaged data).
When searching for the proper European 14CO2 reference curve for investigations linked to the terrestrial biosphere reservoir or for dating of recent organic material, the question is, which data set is most appropriate as input curve. Keeping in mind that photosynthesis by plants is mainly restricted to spring and summer months, and that generally the organic material to be dated has grown in rural areas and at lower elevation than Jungfraujoch, we suggest that only spring and summer months’ data from SIL may best be taken for reference in such applications. Mean Δ14C values for May to August have thus been calculated from monthly mean Schauinsland data and are also plotted in Fig. 1b, together with a 1σ standard deviation of the four monthly values. Our suggestion would be to use these numbers as input 14C/C ratios which are transferred into plant material. However, there may be other applications where different data selection may be appropriate. For this purpose, monthly mean Schauinsland values, respective values from the Jungfraujoch together with the monthly data from the Jungfraujoch fit curve are listed along with the SIL summer mean values in Table 1. The individual 2-week integrated data are available online under http://www.iup.uni-heidelberg.de/institut/forschung/groups/kk/Data_html.
4. Summary and conclusions
Long-term integrated Δ14CO2 measurements have been continued at the high-alpine Jungfraujoch station in the Swiss Alps as well as at Schauinsland in the Black Forest, southern Germany. The almost exponential decrease of Δ14C since 1963 has continued with a current rate of ca. 3‰ per year in the last 4 yr. We suggest using the Jungfraujoch fit curve as a clean air reference for estimates of the fossil fuel CO2 concentration at polluted European stations, while mean summer (May–August) data from Schauinsland may best represent atmospheric Δ14C transferred into the biospheric reservoir. It should be noted, that the mid latitude northern hemispheric reference values presented here may not be applicable for tropical and southern hemispheric studies, as the increasing fossil fuel CO2 emissions in northern mid-latitudes tend to increase the meridional gradient, so that respective background Δ14C data may be higher in latitudes further to the south by as much as 5‰ (see Levin et al., 2010; Graven et al., 2012). Continuation of our long-term measurements seems appropriate as these data sets are essential as input to study carbon cycle dynamics or for future dating purposes.
5. Acknowledgements
We wish to thank the technical personnel at Jungfraujoch and Schauinsland for their careful work collecting the numerous 14CO2 samples as well as the Jungfraujoch Foundation and the German Umweltbundesamt for logistic support at the stations. Sabine Kühr and Eva Gier took care of the 14CO2 sample preparation in the Heidelberg Radiocarbon laboratory. Financial support for these long-term 14CO2 measurements was provided by a number of agencies in Germany and Europe, namely the Heidelberg Academy of Sciences, the Ministry of Education and Science, Baden-Württemberg, Germany, the German Science Foundation, the German Minister of Science and Education (FKZ 01LK1102A), and the European Commission, Brussels, under the projects CarboEurope-IP (Project No. GOCE-CT-2003-505572) and ICOS Preparatory Phase (Project No. 211574).