
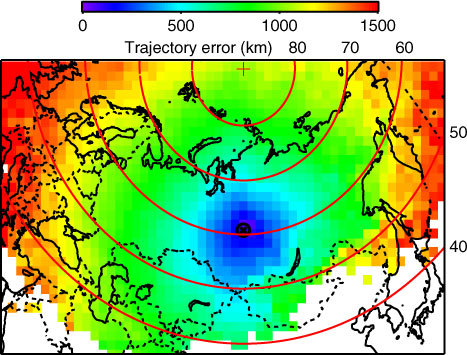
Fig. 1
Average geographical distribution of uncertainties in km of 54 988 10-d back trajectories starting at 300 m of the ZOTTO facility (89.35E, 60.8N), marked with the symbol cross in circle. National boundaries are drawn as thin dotted lines. Only grid cells with at least 25 cases are shown. Parallels and North Pole are drawn in red.
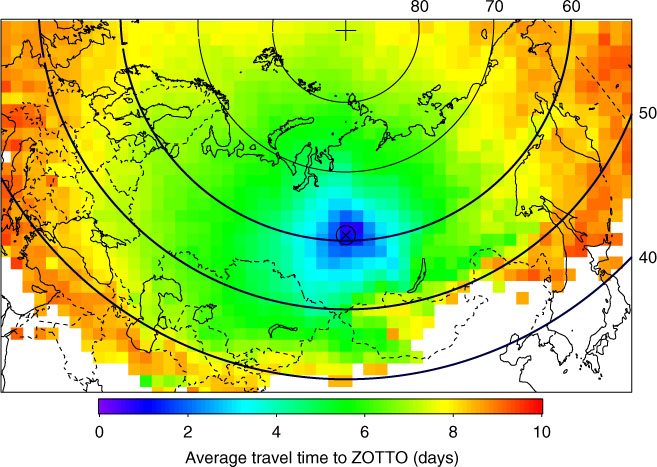
Fig. 2
Average geographical distribution of travel times to ZOTTO in days of 54 988 10-d back trajectories starting at 300 m of the ZOTTO facility (89.35E, 60.8N), marked with the symbol cross in circle. National boundaries are drawn as thin dotted lines. Only grid cells with at least 25 cases are shown. Parallels and North Pole are drawn in red.
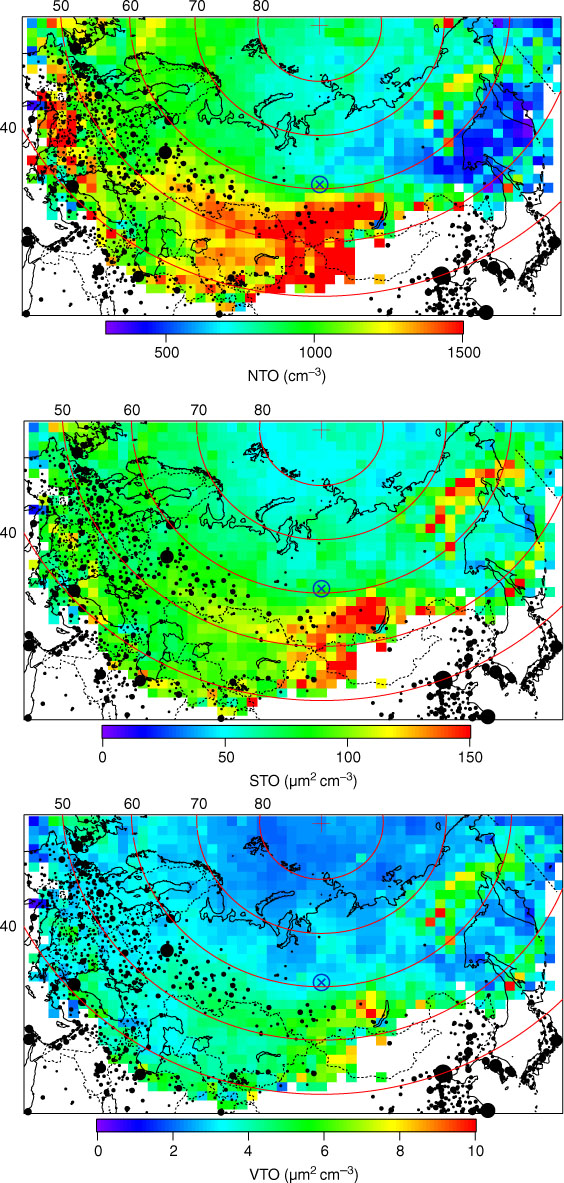
Fig. 3
Average trajectory-extrapolated distribution of total number (top, NTO, cm−3), total surface (centre, STO, µm2 cm−3) and total volume (bottom, VTO, µm3 cm−3) measured at ZOTTO 2006–2012. Values larger than the scale top are plotted in red. ZOTTO is marked as red symbol on the map. Cities with populations of 100 000 and larger are drawn as black discs, the areas of which are scaled in proportion to their population relative to 100 000.
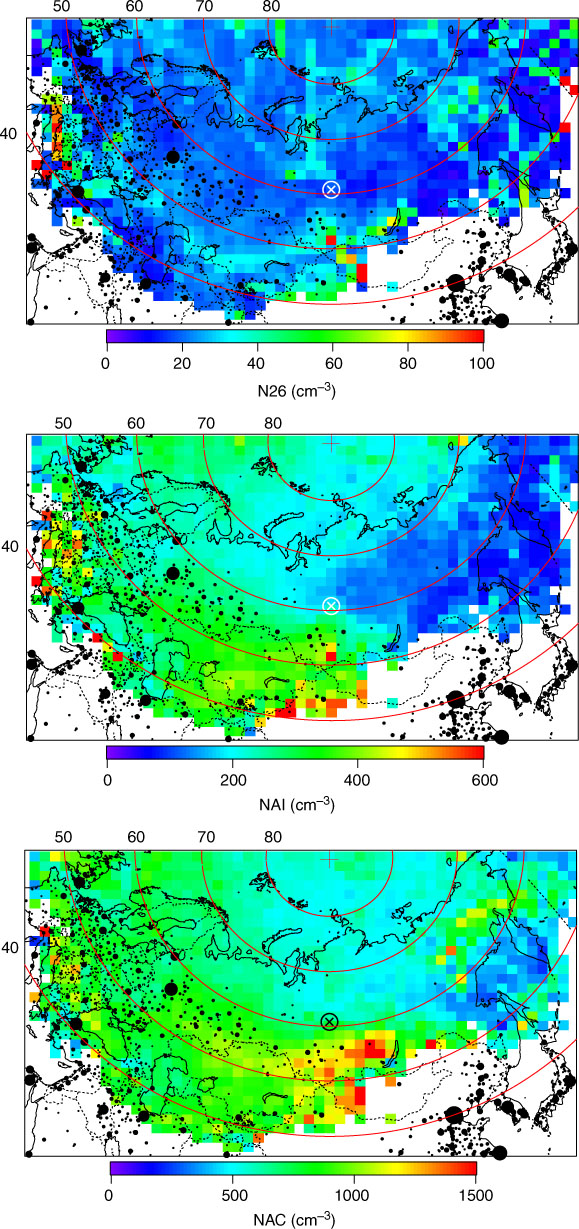
Fig. 4
As Fig. 3 but for number concentration of particles <26 nm (top, N26, cm−3), between 26 and 80 nm (center, NAI, cm−3), and larger than 80 nm (bottom, NAC, cm−3) measured at ZOTTO 2006–2012.
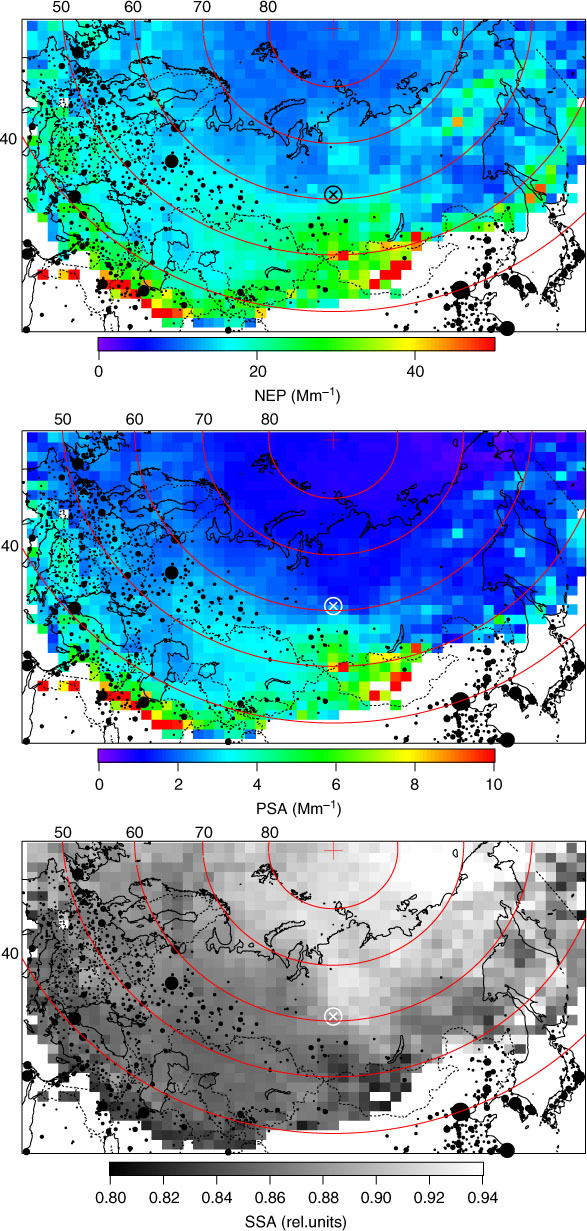
Fig. 5
As Fig. 3 but for scattering coefficients at 550 nm wavelength (top, NEP, Mm−1), absorption coefficients at 574 nm wavelength (centre, PSA, Mm−1), and single scattering albedo (bottom, SSA) measured at ZOTTO 2006–2012.
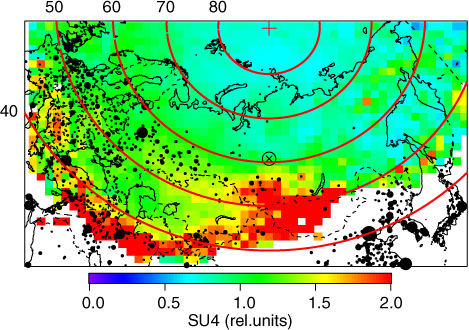
Fig. 6
As Fig. 2 but for the relative parameter SU4 formed from normalised measured data of NTO, NEP, PSA and COM (cf. section 2 for details).
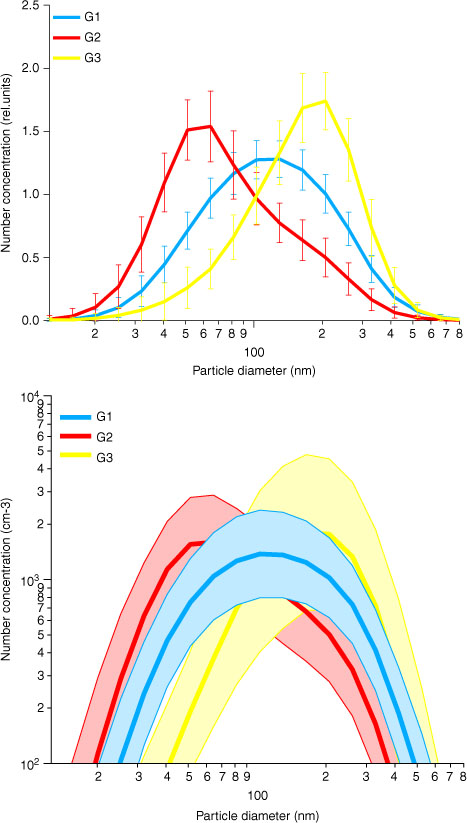
Fig. 7
Average relative (top) and absolute (bottom) number size distributions of three clusters (G1–G3) of ZOTTO size distributions. Error bars indicate the standard deviations of the relative group averages. Shaded areas in the colour of the averages indicate the ranges of one standard deviation about the absolute averages plotted as thick lines.
Table 1. Average integral properties of the three clusters of number size distributions: total number (NTO, cm−3), total surface (STO, µm2 cm−3), total volume (VTO, µm3 cm−3), light scattering coefficient (NEP, Mm−1), absorption coefficient (PSA, Mm−1), CO concentration (COM, ppb) and single scattering albedo (SSA)

Fig. 8
Maps of occurrences (%) of the three groups of number size distributions shown in Fig. 7, top: group 1, centre: group 2, bottom: group 3. ZOTTO is marked as red symbol on the maps. Cities with populations of 100 000 and larger are drawn as black discs, the areas of which are scaled in proportion to their population relative to 100 000.