Fig. 1.
Time series for (a) particle number size distributions and (b) sulphuric acid (H2SO4, blue empty dot), condensation sink (CS, green line with empty dot) and 15–25 nm particle number concentrations (N 15–25, red line) for the measurement period. The new particle formation event days are presented on a grey background. The x-axis is presented by DOY (day of year), 1 January is defined as day 1.
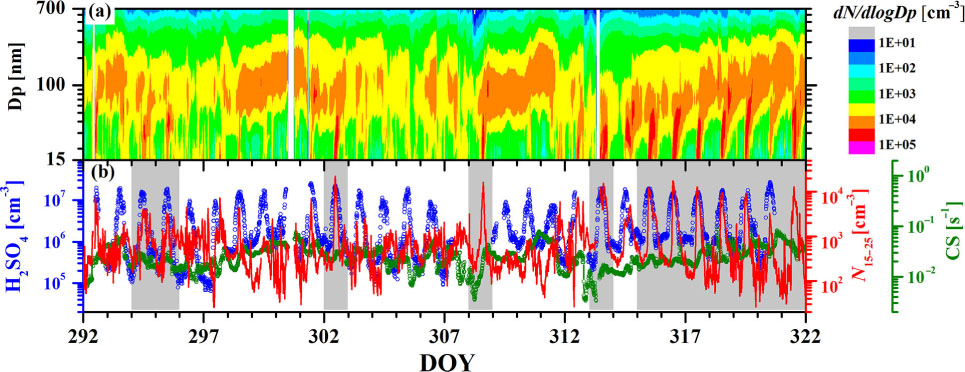
Table 1. Comparisons of various parameters between NPF event days and non-event days (during 9:00–12:00)
Table 2. Comparisons of the condensation sink values with other studies at rural sites on NPF event days
Fig. 2.
The relationship between the number concentration of 15–25 nm particles and the ratio of sulphuric acid concentration to condensation sink. The data are from 09:00 to 12:00. NPF event days (red), Non-event days (blue).
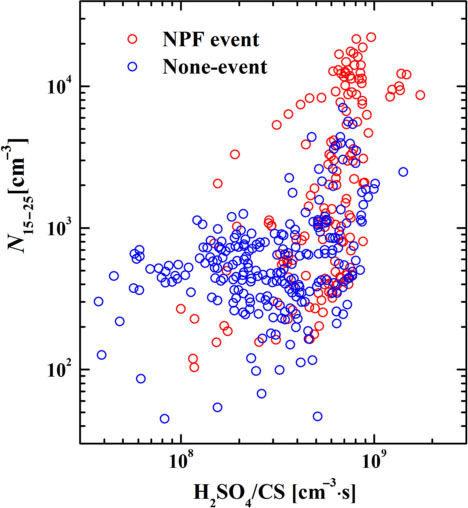
Fig. 3.
Time series of (a) particle number size distribution and the mean diameter of the dominating mode; (b) Temperature (T, red) and Relative Humidity (RH, blue); (c) Wind Speed (WS, orange) and Wind Direction (WD, green); (d) PM1 species concentrations; and (e) the ratio of primary emission to total mass concentration and fire count (pink) in PRD region during the episode.
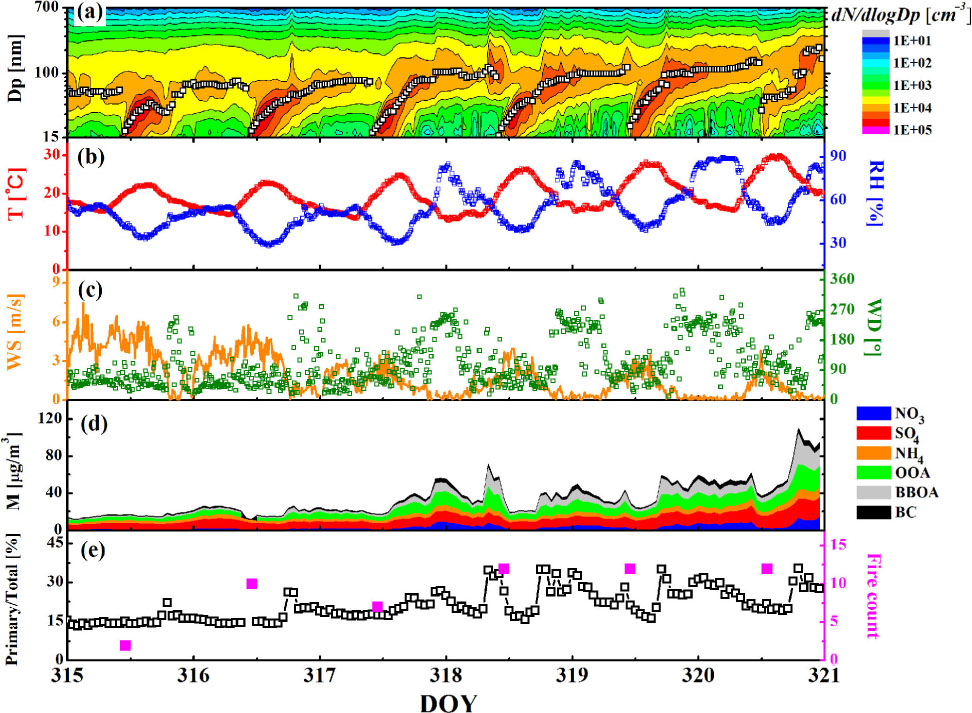
Fig. 4.
Time evolutions of (a) particle number size distributions and (b) particle volume size distributions during the episode. Different colour lines represent the mean distribution.
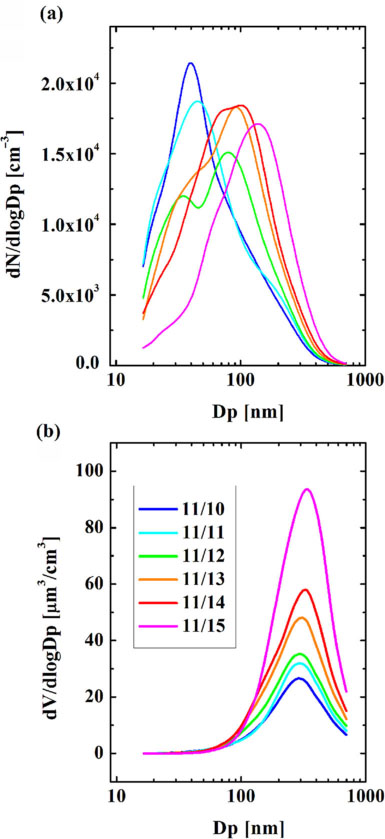
Fig. 5.
The variations of (a) the relative contribution of different components, with PM1 mass concentration; (b) the relative contribution of particle number concentration in different modes, with primary species (BBOA and BC) mass concentration.
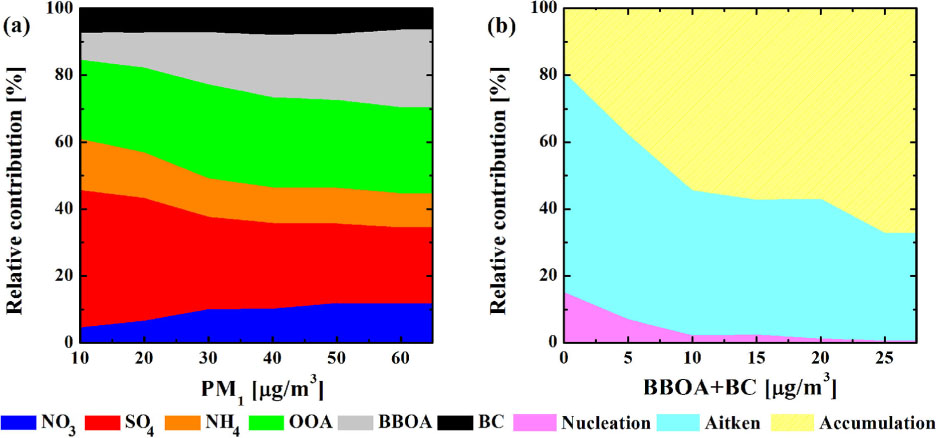
Fig. 6.
Scatter plot of the total particle number concentration (N) versus the primary emissions (BBOA+BC). S 1 and S 2 indicate the lines of the minimum and maximum slopes which comprise the N-vs.-Pri. data, respectively.
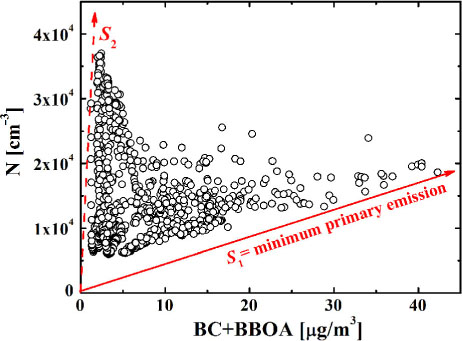
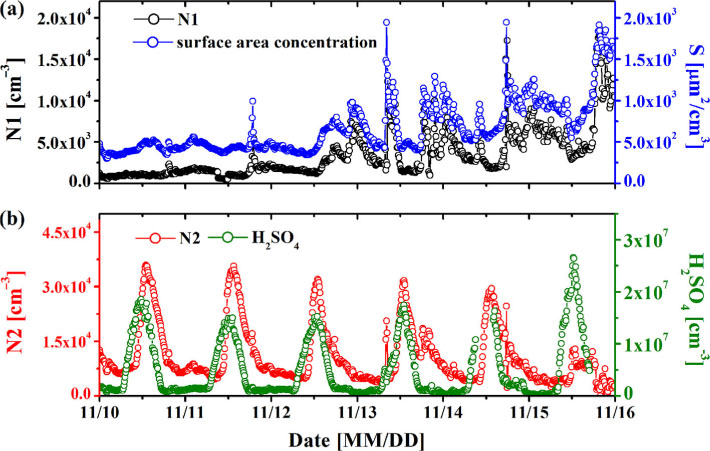
Fig. 7.
Time series of (a) N1 (black) and particle surface area concentration (blue); (b) N2 (red) and sulphuric acid concentration during the episode (green).