
>Table 1
Refractive index of mineral dust for 16 long-wave spectral bands used in the WRF/Chem model
Long-wave (µm)RealImaginary3.1–3.81.510.0183.8–4.21.50.00684.2–4.41.50.0084.4–4.81.4950.0114.8–5.61.4730.02455.6–6.81.4320.0616.8–7.21.4470.1057.2–8.51.2420.0938.5–9.31.5570.3739.3–10.22.9170.6510.2–12.21.8220.2612.2–14.31.9110.31914.3–15.91.5080.26315.9–20.01.7480.46220.0–28.62.9040.85728.6–10002.3400.7
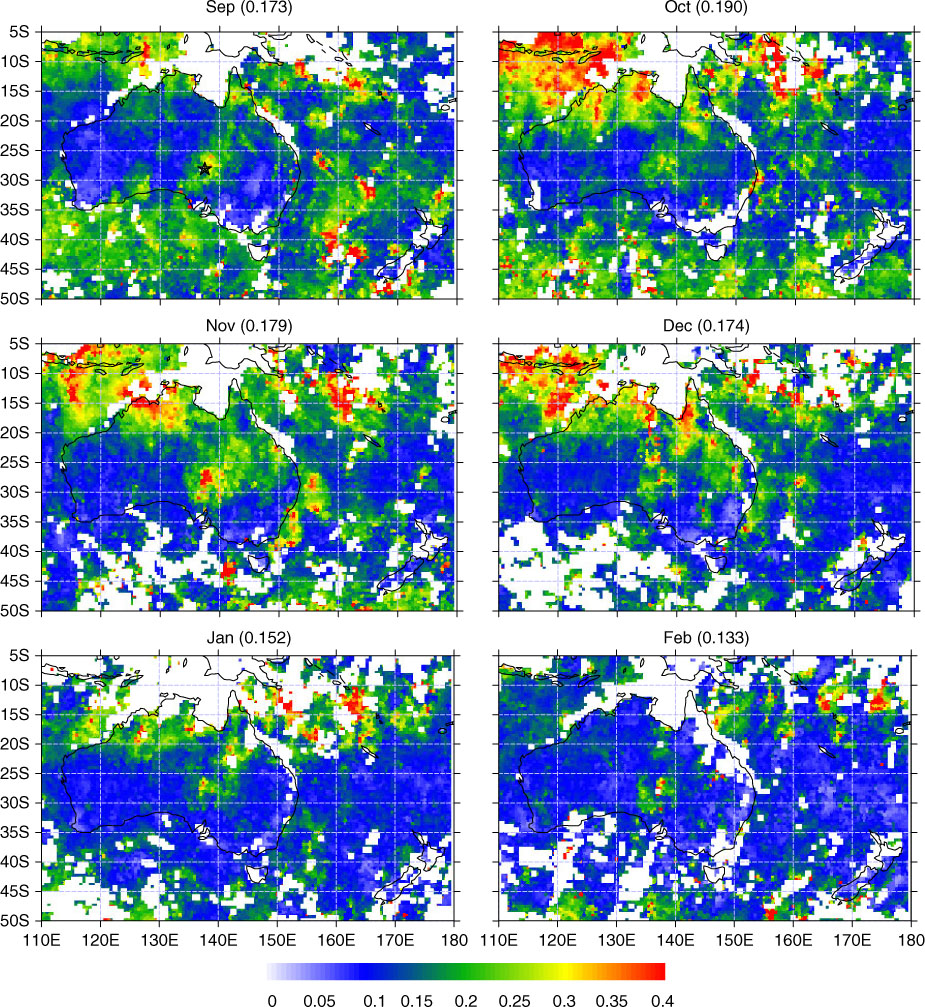
Fig. 1
Aerosol optical depth (AOD) at 0.55 µm from September 2009 to February 2010 retrieved from the MISR instrument. Domain averaged (5–50°S and 110–180°E) monthly mean AOD is indicated in brackets for each panel. The location of Lake Eyre Basin is shown by the star.
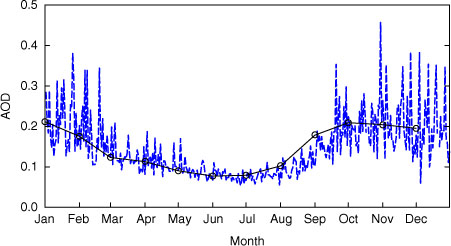
Fig. 2
Daily (blue) and monthly mean (black) variation of AOD over Lake Eyre Basin (26–29°S and 137–139°E) retrieved from the MISR satellite instrument and averaged for the period 2001 to 2011.
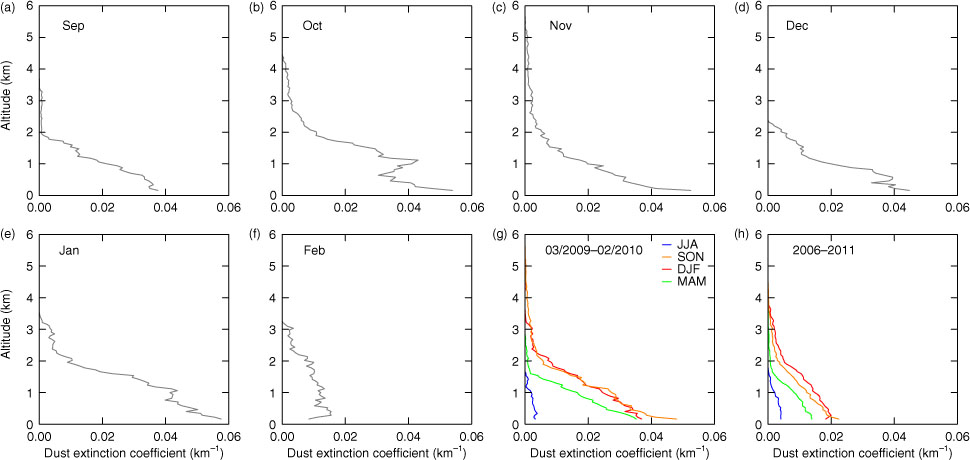
Fig. 3
Dust extinction coefficient (km−1) profiles at 0.532 µm from (a–f) September 2009 to February 2010, (g) in different seasons from March 2009 to February 2010 and (h) seasonally averaged for the 6-yr period (2006–2011) over Lake Eyre Basin (28°S and 137.5°E), retrieved from CALIOP satellite lidar.
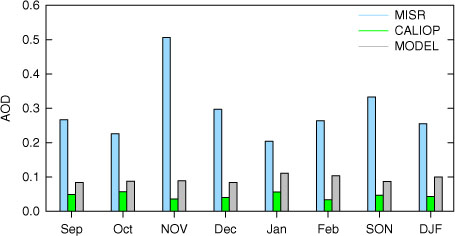
Fig. 4
Monthly average AOD observed by the MISR and CALIOP satellite instruments and simulated by the WRF/Chem model over Lake Eyre Basin (28°S and 137.5°E) from September 2009 to February 2010.
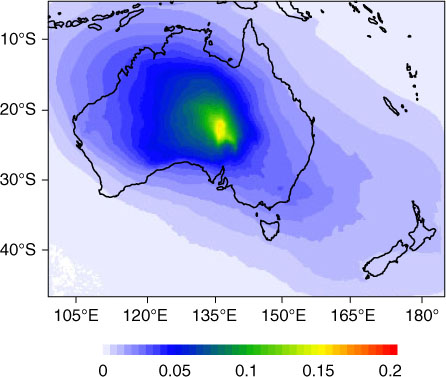
Fig. 5
Simulated dust optical depth (DOD) at 0.55 µm averaged for a 6-month period from September 2009 to February 2010.
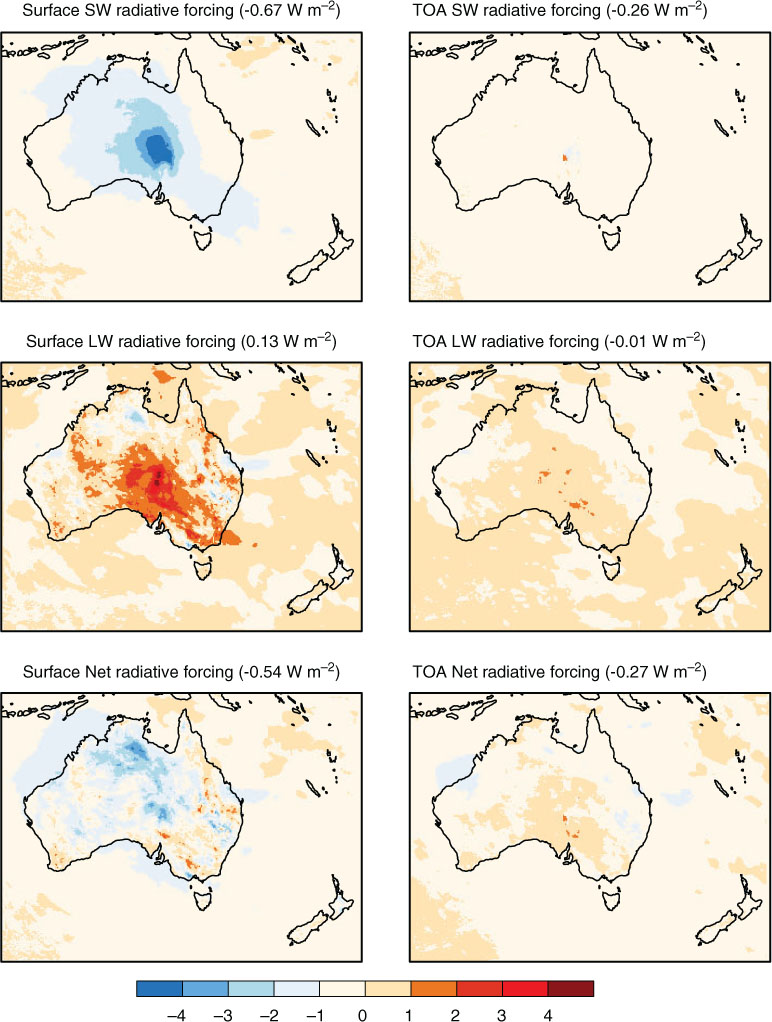
Fig. 6
Simulated clear-sky short-wave, long-wave and net (short-wave + long-wave) direct radiative forcing (W m−2) by dust aerosols at the surface and TOA averaged from September 2009 to February 2010. The domain averaged radiative forcing by dust averaged over the simulation period is indicated in brackets for each panel.
Table 2
Simulated clear-sky monthly averaged shortwave, long-wave and net (short-wave + long-wave) direct radiative forcing (W m−2) by dust aerosols at the surface and TOA over Lake Eyre Baisn (28°S and 137.5°E)
SurfaceTOASurfaceTOASurfaceTOASep−5.61−1.563.350.32−2.26−1.24Oct−6.35−1.593.670.5−2.68−1.09Nov−6.47−1.444.421.05−2.05−0.39Dec−7.14−1.363.750.38−3.39−0.98Jan−9.83−1.626.782.26−3.050.64Feb−8.05−1.684.491.16−3.56−0.52Mean−7.24−1.544.410.94−2.83−0.6
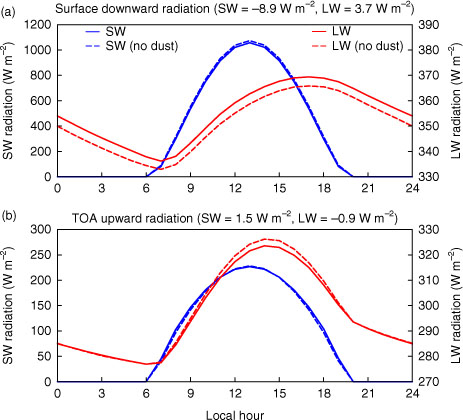
Fig. 7
Clear-sky diurnal cycle of (a) downward short-wave and long-wave radiation (W m−2) at the surface and (b) upward short-wave and long-wave radiation (W m−2) at the TOA over Lake Eyre Basin (28°S and 137.5°E) averaged for a 6-month period from September 2009 to February 2010. The daily average short-wave and long-wave radiative forcing by dust at the surface and TOA is indicated for each panel.
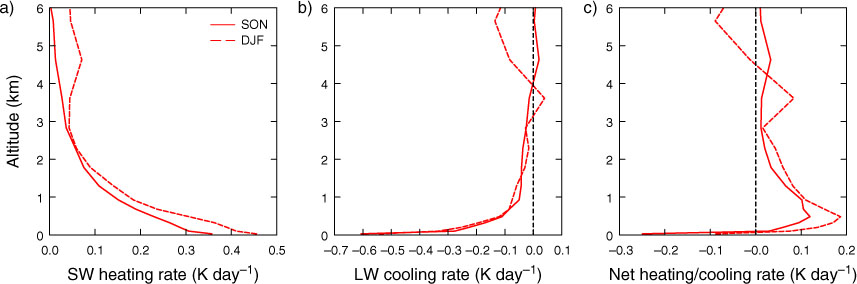
Fig. 8
Simulated atmospheric heating and cooling profiles (K d−1) due to the interaction of (a) short-wave, (b) long-wave, and (c) net (short-wave + long-wave) radiation with dust aerosols averaged for austral spring (solid red line) and summer (dashed red line) over Lake Eyre Basin (28°S and 137.5°E).