
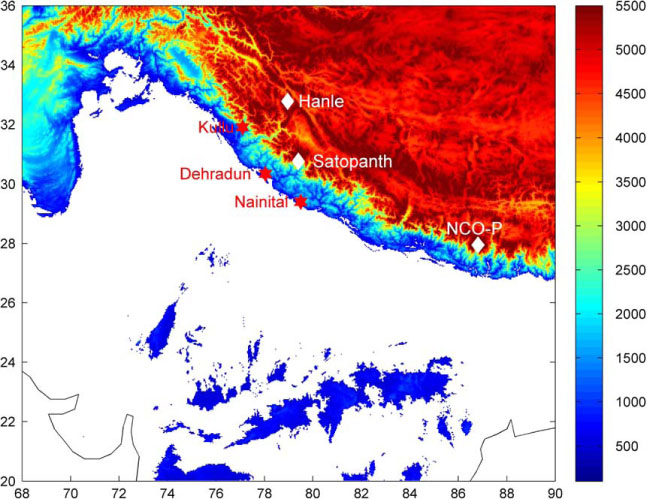
Fig. 1
Measurement locations over the Himalayas are superposed over the terrain height map (Topography from US Geological Survey's EROS data centre). Measurement sites include (i) Nainital, Dehradun and Kullu (lower Himalayan stations), (ii) Hanle and NCO-P (high-altitude stations) and (iii) Satopanth (campaign location near Satopanth glaciers).
Table 1
The details of measurement locations and period of measurements
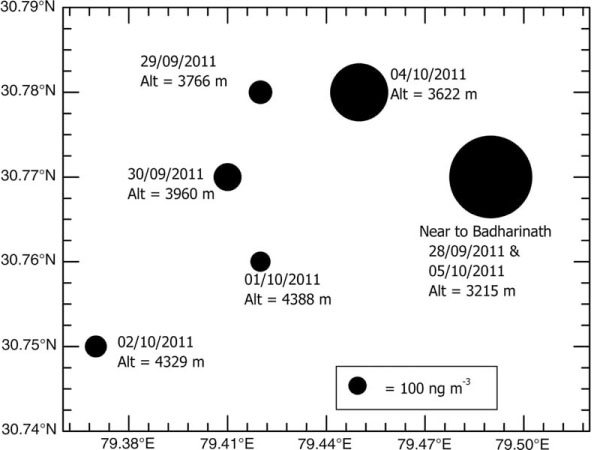
Fig. 2
Spatial pattern of atmospheric BC mass concentrations over the Satopanth region. Measurement date and altitude of observations are noted. The size of filled circles indicates the magnitude of the BC mass concentration.
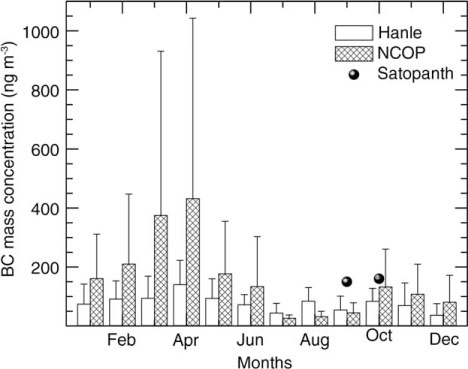
Fig. 3
Climatological monthly mean mass concentrations of atmospheric black carbon (BC) aerosols at Hanle and NCO-P. The vertical lines indicate the standard deviation of the data. The atmospheric BC values measured over Satopanth glacier is shown as filled circles.
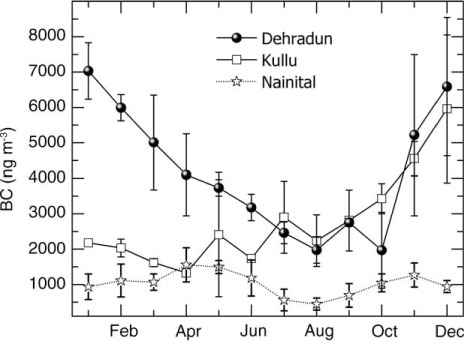
Fig. 4
Climatology of monthly variations of atmospheric BC mass concentrations at Dehradun, Kullu and Nainital.
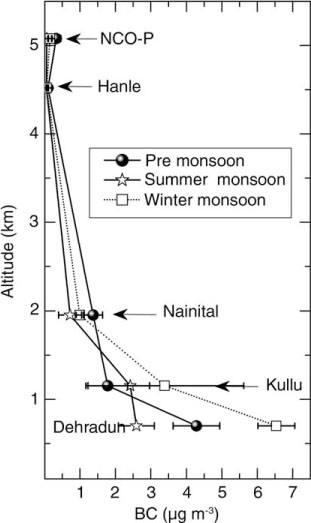
Fig. 5
Seasonal variation of atmospheric BC mass concentrations measured at Dehradun, Kullu, Nainital, Hanle and NCO-P as a function of station altitude.
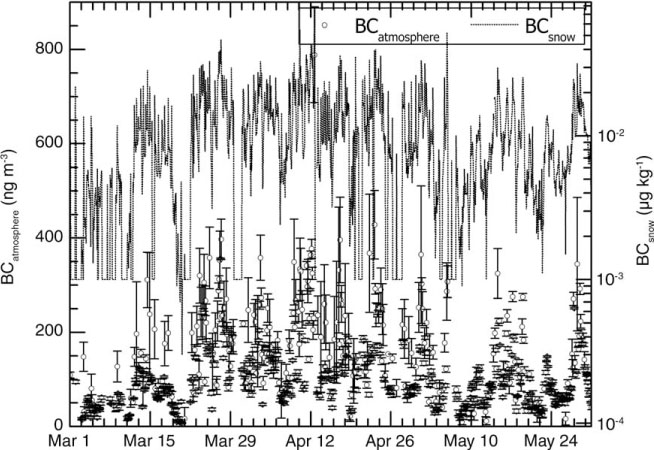
Fig. 6
Hourly mean values of BC (open circles) in the atmosphere and the estimated mass concentrations of BC in the top snow layer (dotted lines) due to dry deposition based on the dry deposition velocity used in Yasunari et al. (2010) over Hanle during pre-monsoon season, 2010.
Table 2
The estimated amount BC on snow through dry deposition over Hanle and Satopanth during pre-monsoon season
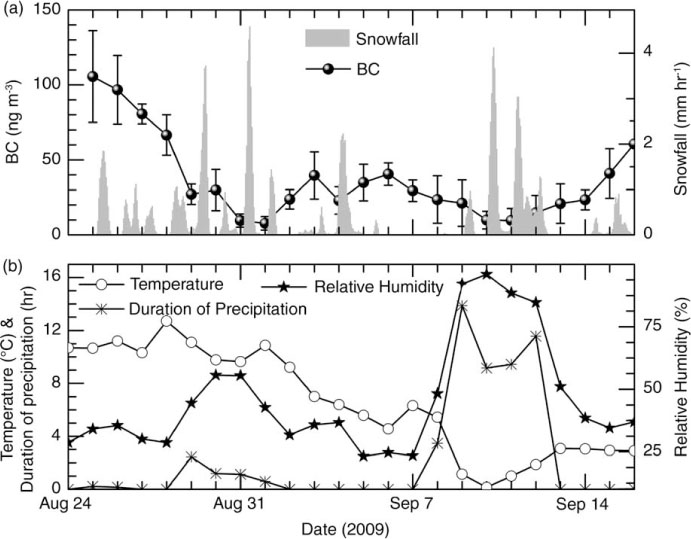
Fig. 7
Temporal variation of aerosols and meteorological parameters during the snowfall event observed at Hanle. The mass concentration of BC in the atmosphere and snowfall data from MERRA reanalysis are shown in (a) and simultaneous measurements of duration of precipitation and relative humidity are shown in (b).
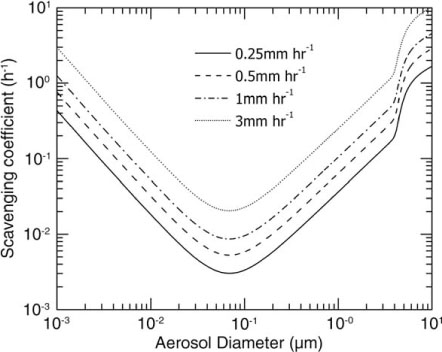
Fig. 8
Size-resolved scavenging coefficients for different snowfall rates estimated using Feng (2009).
Table 3
Table 3. Optical properties of aerosols over Hanle, NCO-P and lower Himalayan stations (Nainital, Dehradun, and Kullu) during pre-monsoon (March–May) and winter (December–February) seasons
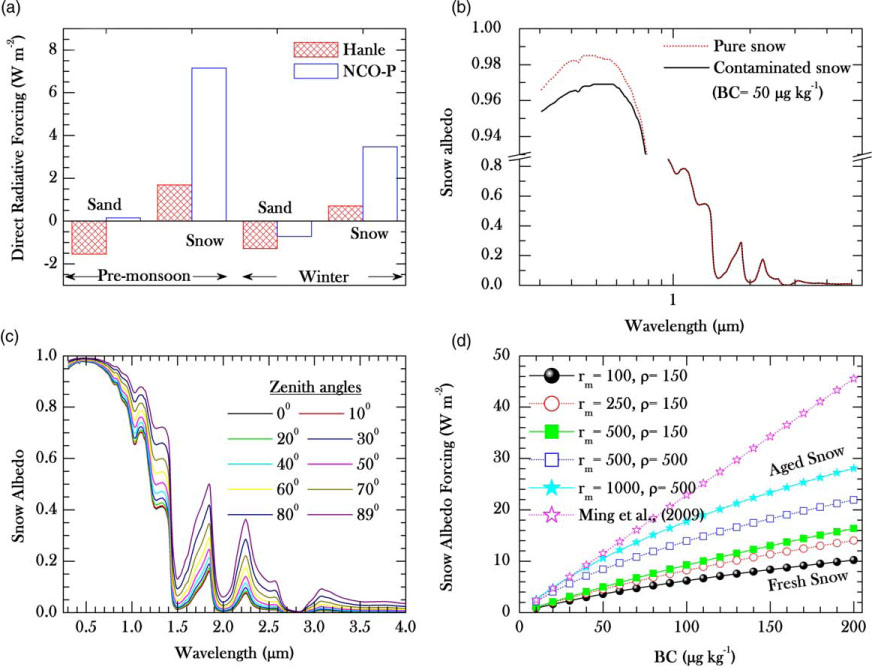
Fig. 9
(a) Direct radiative forcing due to composite aerosols on snow and sandy surfaces over Hanle and NCO-P during pre-monsoon season; (b) spectral variation of snow albedo for pure and contaminated snow (BC loading of 50 µg kg−1) simulated using SNICAR model; (c) spectral variations of pure snow albedo for different zenith angle conditions; (d) variation of snow-albedo radiative forcing (SARF) as a function of BC concentration in snow for different micro-physical conditions of snow. The estimated BC values in snow for dry deposition range from 1 to 117 µg kg−1 and wet deposition accounts for 29 µg kg−1 for BC in snow.