Fig. 1.
Aerosol optical depth at 440 nm and Ångström Exponent (calculated with AOD at 440, 670, 870 and 1020 nm) temporal evolution from 17 to 26 July 2009.
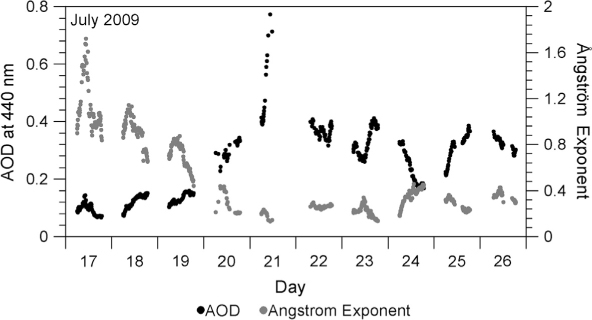
Table 1. Atmospheric characteristics in July 2009 at 9:30 UTC for different days
[i] Solar zenith angle (SZA), total ozone column (TOC), Ångström Exponent (α) and Turbidity (β) parameters, single scattering albedo at 440 nm (SSA440) and at 670 nm (SSA670), asymmetry parameter at 440 nm (g440) and Absorption Ångström Exponent (AAE). Δ340 and Δ380 are the differences between the measurements of AOD at these wavelengths and the AOD estimated using α and β calculated with AOD at 440, 670, 870 and 1020 nm linear interpolated at the time. These differences in percentage are given in parentheses. TOC is given in Dobson units (DU) and its standard deviation is given in parentheses in DU.
Fig. 2.
HYSPLIT 96-hour back trajectories at 500, 1500 and 3000 m a.g.l. for 21 July 2009 at 12:00 UTC (left panel). Geopotential height at 700 hPa (shadow) and pressure at sea level in hPa (black lines) for 21 July 2009 at 12:00 UTC (right panel).
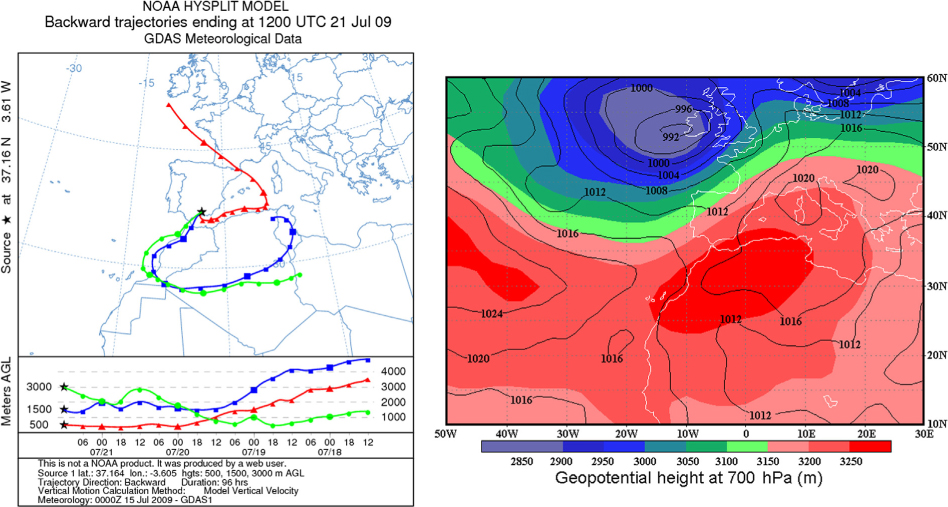
Fig. 3.
Ratio of the global (up), direct (middle) and diffuse (down) UV spectral irradiance measured 21 July 2009 at 9:30 UTC (high desert dust conditions) to the measured one at 9:30 UTC on 17, 18, 23 and 26 July 2009.
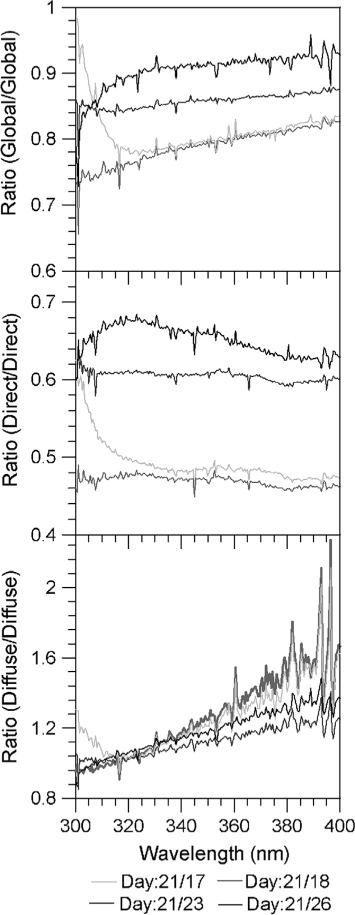
Table 2. Difference between the ratios obtained using eq. (7) and the experimental ratios of direct irradiance (day 21) to direct irradiance (days showed in the table), for the wavelengths of 340 (ΔR340) and 380 (ΔR380) nm
Fig. 4.
Spectral diffuse fraction measured different days at 9:30 UTC as a function of the wavelength.
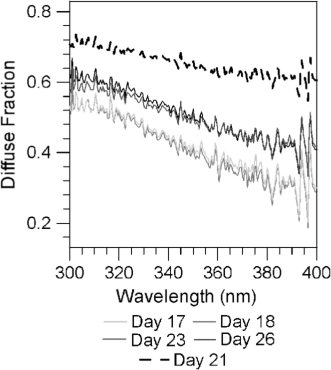
Fig. 5.
Experimental and simulated diffuse fraction under different sky conditions (up), and Rayleigh and aerosol optical depth (down) at 9:30 UTC for a clear day 17th July (left) and a strong desert dust day 21st July (right). The simulated diffuse fraction is taking into account the measured aerosols (Real Inputs), considering the real atmosphere without Rayleigh scattering (No Rayleigh) and taking into account the real atmosphere but without any aerosol (No aerosol).
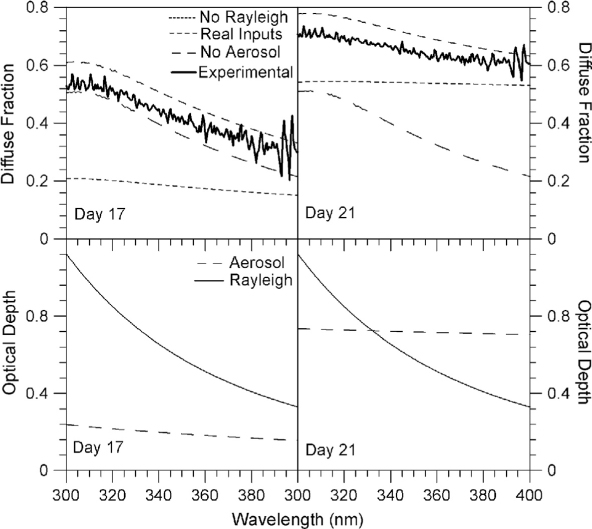
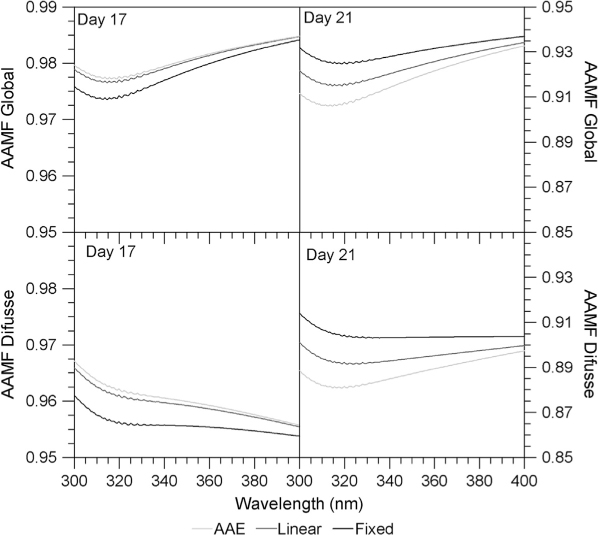
Fig. 6.
Simulated spectral aerosol absorption modification factor in the global (up) and diffuse (down) components at 9:30 UTC for a clear day 17th July (left) and a strong desert dust day 21st July (right) taking into account different SSA values in the UV range. The AAMF values are calculated considering a fixed SSA equal to the measured SSA at 440 nm (Fixed), extrapolating the SSA in the UV range considering a linear variation between the measured SSA at 440 and 670 nm (linear), and taking into account SSA values calculated in the UV range using eq. (12) and eq. (13) and the measured SSA at 440 and 670 nm (AAE).