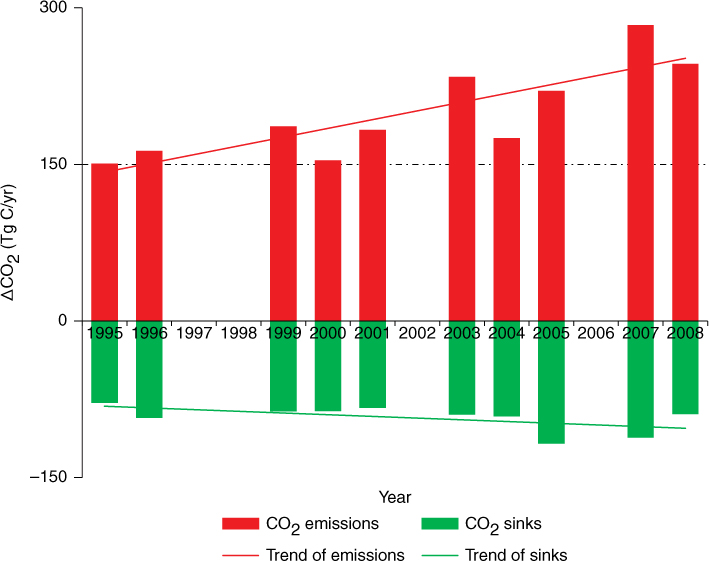
Fig. 1.
Time series of CO2 measurements between 1995 and 2008 at Waliguan identified by our modified data selection method.
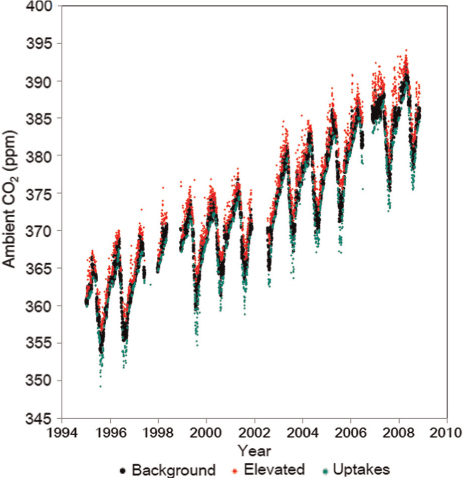
Fig. 2.
Overall long-term changes of CO2 monthly means from continuous measurements identified by Thoning et al. (2003) (red dots) and by this study (black crosses) at Waliguan during 1995–2008, and the linear trends of the monthly means for the two methods are very similar with slopes of 1.9045 and 1.8926, respectively. The differences between the Thoning method and our method (blue dots) are also shown on the left y-axis. A histogram and probability of the differences, which showed more than 90% of all points are within ±0.5 ppm, are embedded in the top and left panel of the figure.
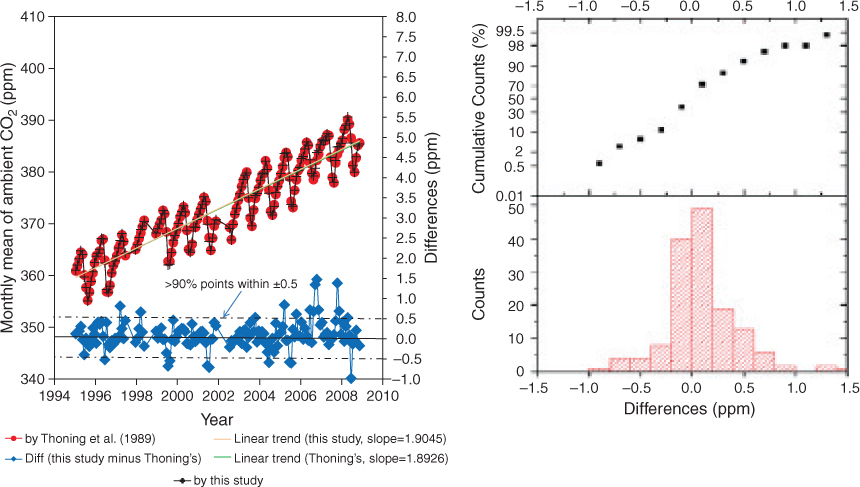
Fig. 3.
Mean CO2 seasonality identified by Thoning et al. (2003) (red circle), Zhou et al. 2003 (blue circle) and this study (black circle) during 1994–2000. The differences of seasonal trends between the method by the other's method and our method are also plotted below.
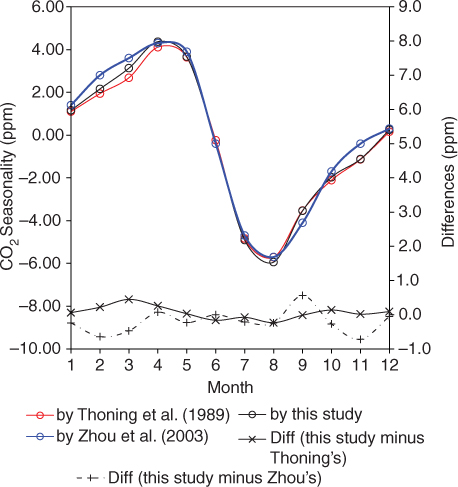
Table 1. Annual means of CO2 calculated from the hourly data identified by the three methods
Table 2. Percentage for background, polluted and sequestered CO2 data in each year
[i] *Percentages in the years not available are due to the data gaps caused by the instrument malefaction or calibrations during the measurement periods.
Fig. 4.
Trends of the percentages for background, elevated, and sequestered CO2 data.
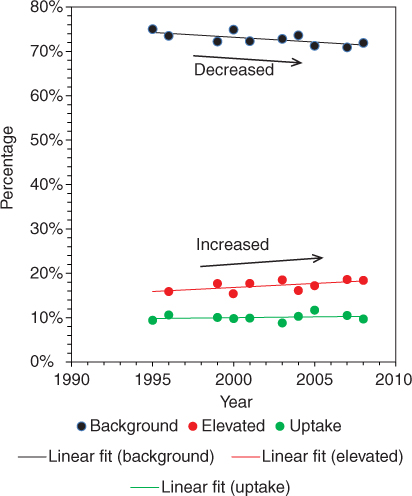
Fig. 5.
Time series of elevated and sequestered CO2 during 1995–2008.
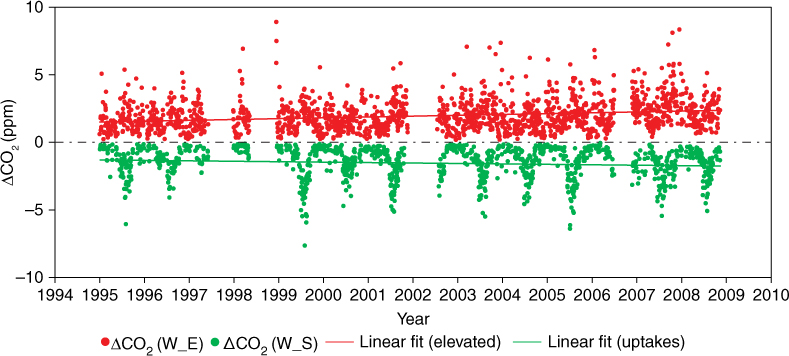
Fig. 6.
Five-day (120 h) back-trajectories at Waliguan in 2005. The different colours indicate trajectory in different seasons. The back-trajectories originating at 00:00, 06:00, 12:00 and 18:00 UTC were calculated by the Hybrid Single-Particle Lagrangian Integrated Trajectory model (HYSPLIT) (Draxler and Hess, 1998) using NCEP (National Centers for Environmental Prediction) reanalysis data. The arrival height of the trajectories was 500 m above ground level. A grid area, covered by almost trajectories of the whole year with latitude of 30°N–50°N and longitude of 70°E–110°E, has been identified, as include most of the region of western China.
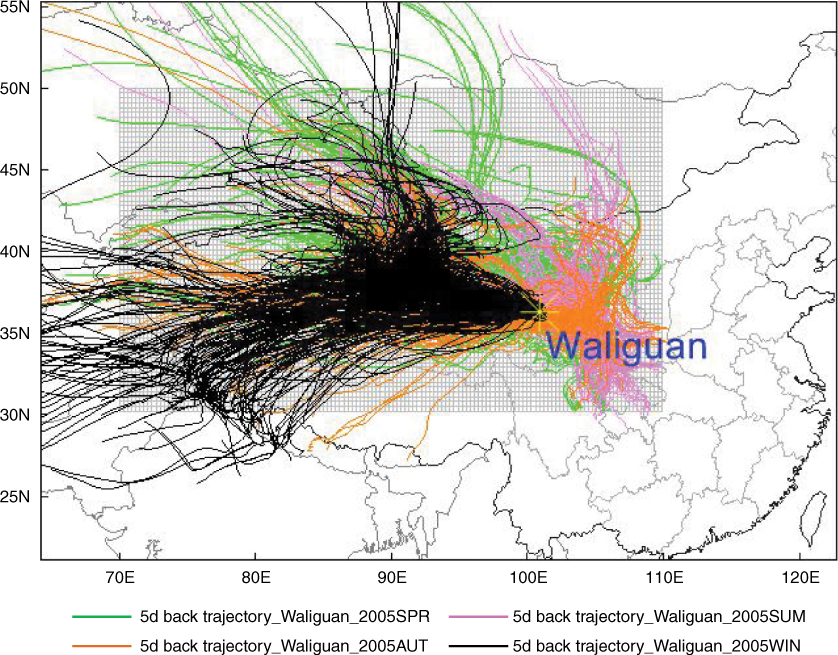
Fig. 7.
CO2 emission changes estimated from the weighted amounts of elevated CO2 in different seasons between 1995 and 2008 in western China.
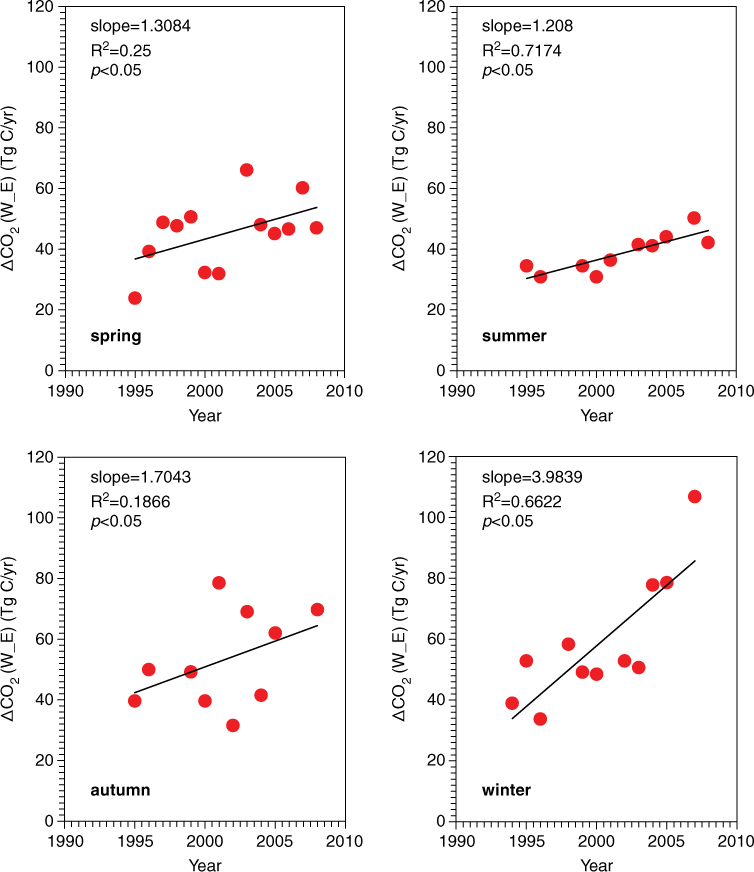
Fig. 8.
CO2 sink changes estimated from the weighted amounts of sequestered CO2 in different seasons between 1995 and 2008 in western China.
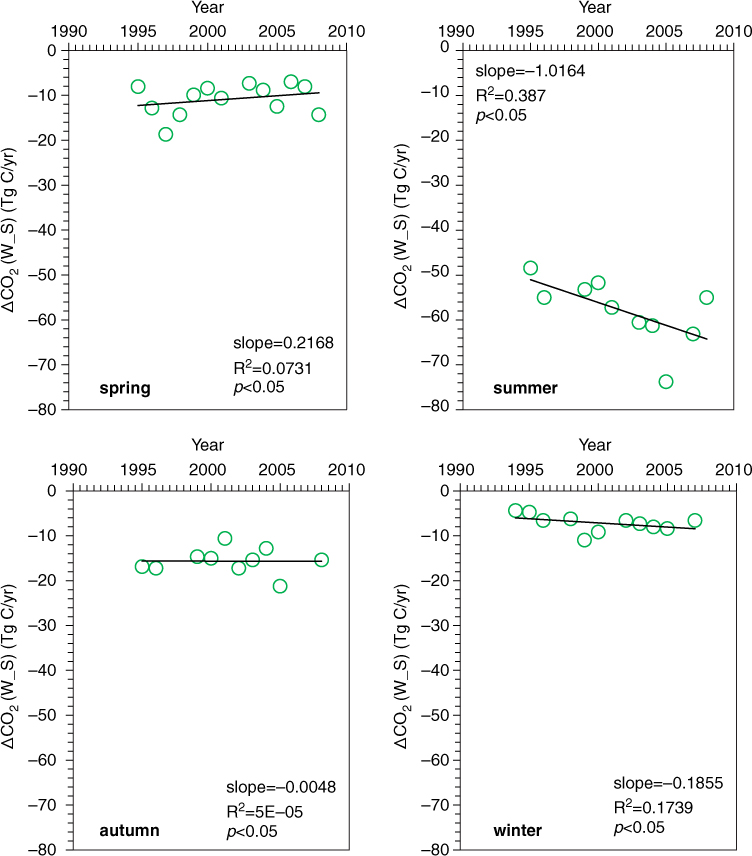
Fig. 9.
Trend of CO2 emissions and sinks estimated from the observed elevated and sequestered CO2 during 1995–2008 in western China.