
Fig. 1.
Variations in the cloud droplet spectral dispersion as the functions of cloud droplet number concentration for MG07, RL03, GB98 and DM07.
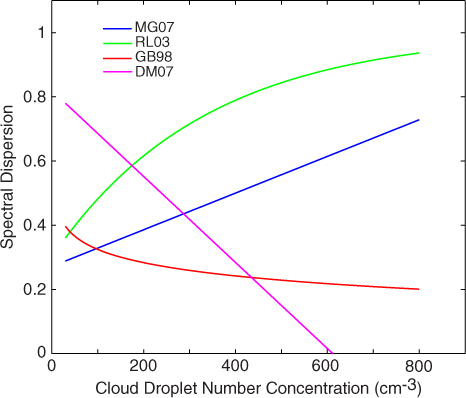
Fig. 2.
Dependence of autoconversion rate P on the cloud droplet number concentration for the different ɛ−N c relationships: MG07, RL03, GB98 and DM07 (at given L c = 1 g m−3).
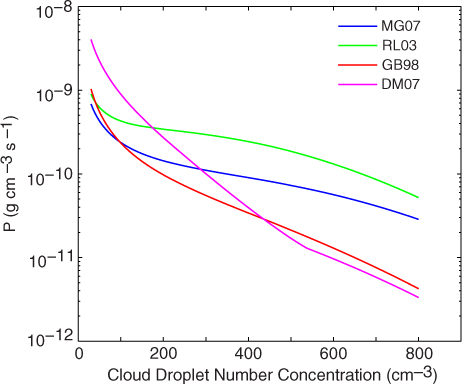
Fig. 3.
Initial profiles of temperature (T), dew point (Td), water vapour mixing ratio (W) and horizontal winds U and V.
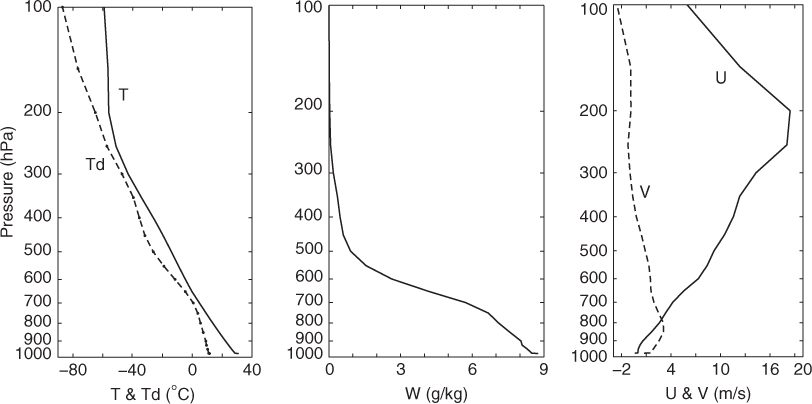
Table 1. Summary of the experiments
Table 2. Liquid cloud microphysical properties obtained from whole domain-averaged values during a 3-hour integration time period
[i] Cloud droplet number concentration (CDNC, 1.e5 m−3), cloud water content (CWC, 1.e−4 g m−3), mean volume radius of cloud droplet (MVRCD, µm), rain drop number concentration (RDNC, m−3), rain water content (RWC, 1.e−4 g m−3) and mean volume radius of raindrops (MVRR, µm).
Table 3. Rates of the microphysical processes obtained from whole domain-averaged values during a 3-hour integration time period
[i] PRC represents autoconversion rate of cloud droplets to rain; PRA is accretion rate of cloud droplets by rain; PRE is evaporation rate of rain; NPRC1 is autoconversion rate of rain drop number concentration; NSUBR is evaporation rate of rain drop number concentration; NRAGG is rate for self-collection of rain drop number concentration; PIMMI is rate for immersion freezing of cloud water to form cloud ice; PSACWS is rate for accretion of cloud water by snow; PRACG is rate for accretion of rain by graupel.
Fig. 4.
Schematic diagram showing the aerosol-induced changing trends of liquid cloud microphysical properties, including cloud droplet number concentration (CDNC), cloud water content (CWC), mean volume radius of cloud droplet (MVRCD), rain drop number concentration (RDNC), rain water content (RWC) and mean volume radius of raindrops (MVRR).
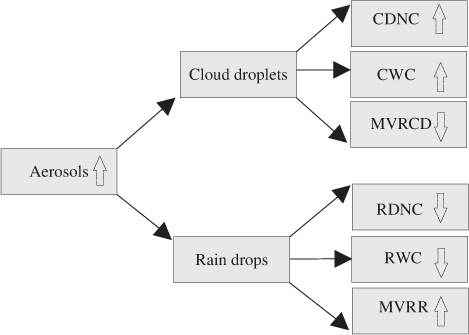
Fig. 5.
Vertical profiles of liquid cloud microphysical properties obtained from the horizontal domain-averaged values during a 3-hour integration time period, including (a) cloud droplet number concentration, (b) cloud water content, (c) rain drop number concentration and (d) rain water content for the different types of the ɛ−N c relationships. Note that MG07-m and MG07-c cases represent the results of ɛ−N c positive relationships, while GB98-m and Gb98-c cases represent the results of the ɛ−N c negative relationships.
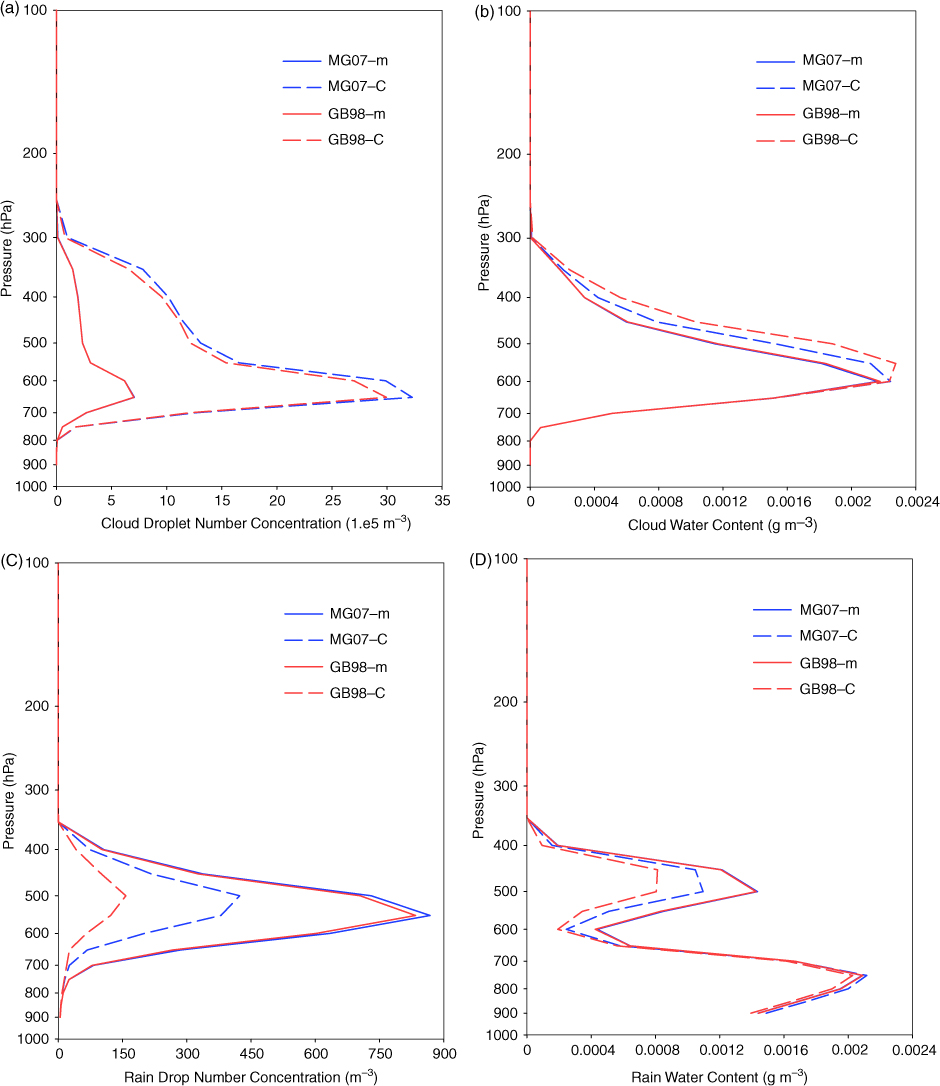
Table 4. Hydrometeor species of ice phase obtained from whole domain-averaged values during a 3-hour integration time period
[i] Ice content (IC, 1.e−3 g m−3), snow water content (SWC, 1.e−3 g m−3), graupel water content (GWC, 1.e−3 g m−3), total water content of ice phase (TWC, 1.e−3 g m−3).
Fig. 6.
Same as Fig. 5, but for (a) ice content, (b) snow water content and (c) graupel water content.
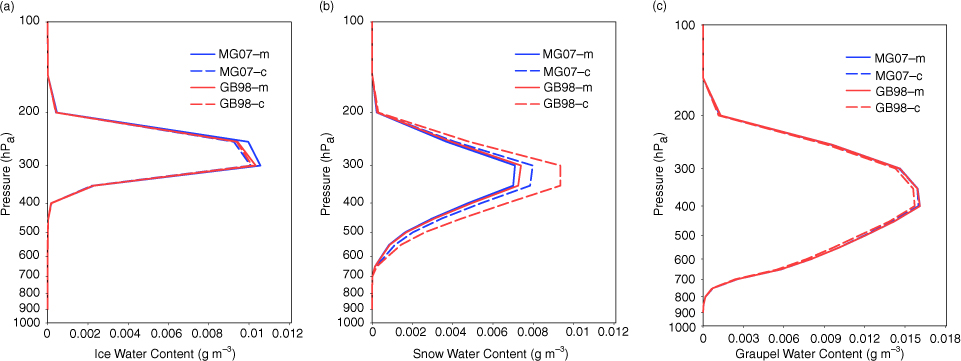
Fig. 7.
Domain-maximum vertical velocity (m s−1) as functions of time in maritime and continental backgrounds for MG07, RL03, GB98 and DM07.
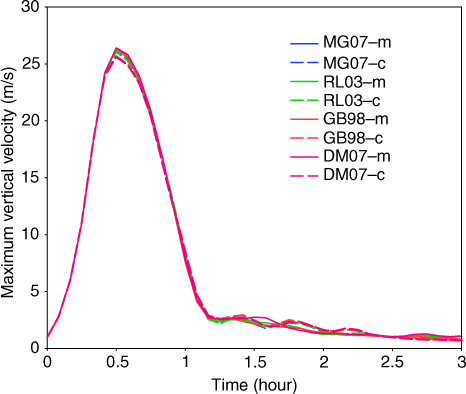
Fig. 8.
Vertical profiles of the horizontally averaged convective mass flux MF c within convective cores at 0.5 hours in the clean maritime and polluted continental backgrounds for (a) MG07, (b) RL03, (c) GB98 and (d) DM07.
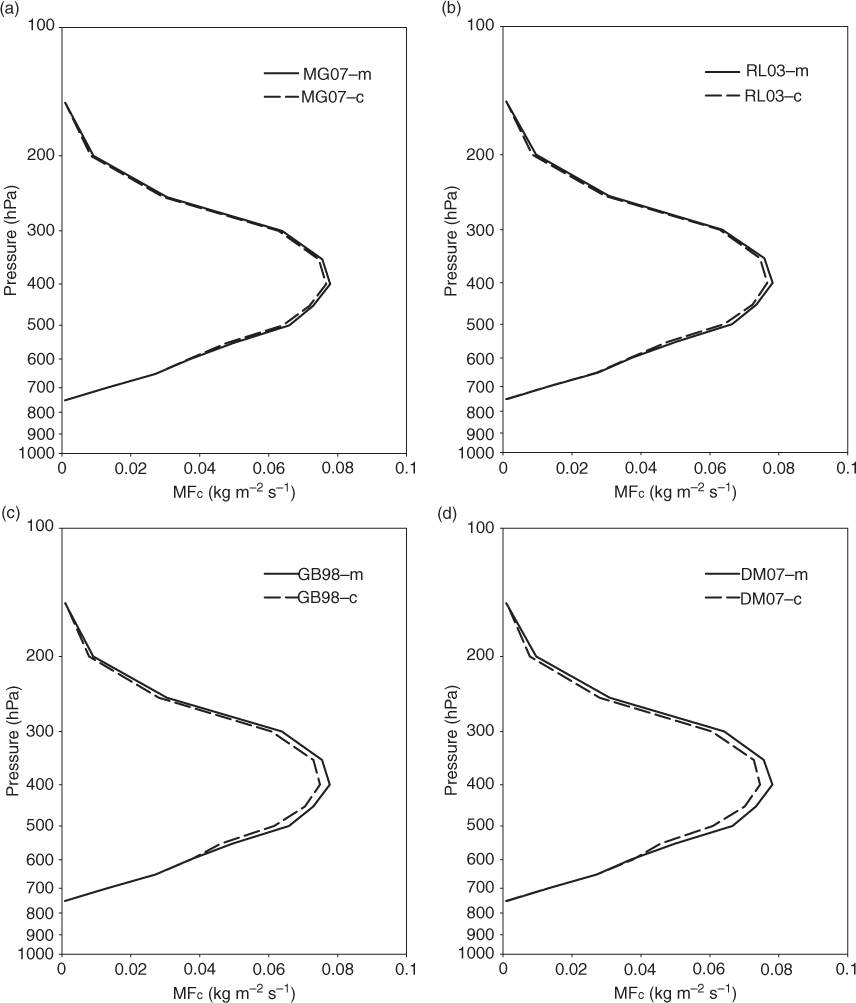
Table 5. Averaged domain-maximum vertical velocity (Wmax, m s−1) over the whole simulation time (3 hours) in maritime and continental backgrounds
[i] Relative differences are calculated by ((Wmax-c)−(Wmax-m))/(Wmax-m)×100%. ‘m’ refers to a maritime concentration of aerosols (i.e. clean background) and ‘c’ refers to a continental concentration of aerosols (i.e. polluted background).
Table 6. Averaged domain-maximum vertical velocity (Wmax, m s−1) during the first 1.5-hour integration time in maritime and continental backgrounds
[i] Relative differences are calculated by ((Wmax-c)−(Wmax-m))/(Wmax-m)×100%. Abbreviations are as in Table 5.
Table 7. Average convective mass flux MF c within convective cores between 700 hPa and 200 hPa (0.01×kg m−2 s−1) at 0.5 hours in maritime and continental backgrounds
[i] Relative differences are calculated by [(MF c -c)−(MF c -m)]/(MF c -m)×100%. Abbreviations are as in Table 5.
Fig. 9.
Temporal evolution of the model-estimated domain average accumulated precipitation (mm) in the clean maritime and polluted continental backgrounds for (a) MG07, (b) RL03, (c) GB98 and (d) DM07. The point for time=0 is referred to the start time of simulation.
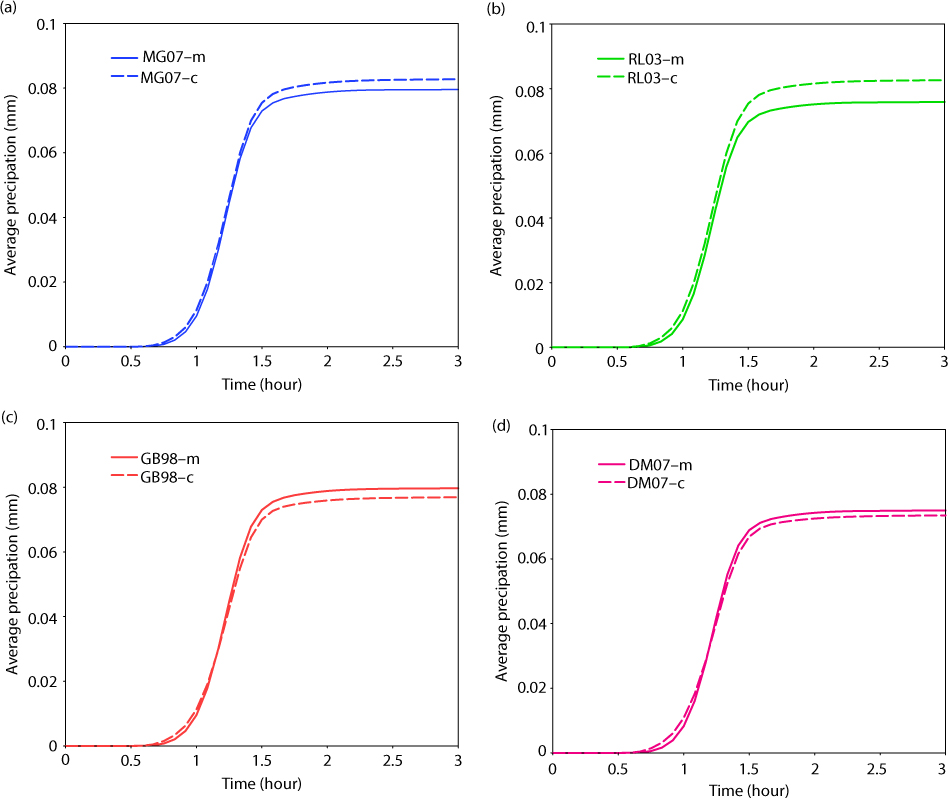
Table 8. Model-estimated domain average accumulated precipitation (mm) obtained during 3 hours of simulations
[i] Relative differences are calculated by ((Precipitation-c)−(Precipitation-m))/(Precipitation-m)×100%. Abbreviations are as in Table 5.
Table 9. Model-estimated domain average accumulated precipitation (mm) from simulations with maximum θ′ of the thermal to initiate convection of 2.5, 3 and 3.5 K
[i] Relative differences are calculated by ((Precipitation-c) − (Precipitation-m))/(Precipitation-m)×100%. Abbreviations are as in Table 5 .