Have a personal or library account? Click to login
Chemical signature of Saharan dust on dry and wet atmospheric deposition in the south-western Mediterranean region Cover

Chemical signature of Saharan dust on dry and wet atmospheric deposition in the south-western Mediterranean region

Open Access
|Jan 2013

Figures & Tables

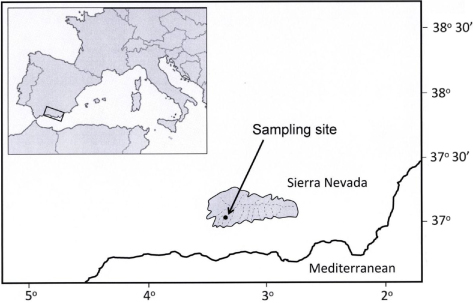
Fig. 1

Location of the study site, in the south-western Mediterranean Region.

Table 1. Number of weeks with absence of rain (dry weeks) and with presence of rain (rainy weeks), affected or not by Saharan dust intrusions, during the 2-year study period

No intrusionIntrusionTotalDry weeks233154Rainy weeks242549Total4756103

Table 2. Daily mean values and range (m−2 d−1) of dry, wet and total deposition from December 2000 to December 2002

Dry depositionWet depositionTotal depositionSome reported values of total depositionrationMean (min–max)nMean (min–max)Dry/wetnMean (min–max)PM, mg10823.6 (0.3–105.8)1096.8 (0.0–95.8)3.4910830.4 (0.83–132.2)34.21TP, µmol1081.0 (0.03–3.1)1080.6 (0.0–9.7)1.811071.6 (0.1–10.8)3.51SRP, µmol1090.4 (0.0–2.1)1040.1 (0.0–1.0)3.51040.5 (0.0–2.4)0.05–5.32; 0.27–0.363TN, µmol10549.3 (6.6–306.3)10764.0 (0.0–517.2)0.78103115.2 (17.2–533.8)–NO3-N, µmol10710.2 (0.4–43.7)10818.2 (0.0–128.8)0.5610628.8 (0.4–134.5)49.6–130.74SiO2-Si, µmol1062.34 (0.39–8.08)1062.2 (0.0–28.4)1.041044.7 (0.7–31.8)315; 59.66Ca2 +, µmol10768.5 (13.4–169.2)10744.1 (0.0–440.9)1.55105114.0 (13.9–559.8)67.97nss Ca2+, µmol10766.8 (12.6–167.1)10742.6 (0.0–438.6)1.57105110.8 (13.2–556.2)Na+, µmol10558.2 (21.4–432.1)10867.1 (0.0–704.8)0.87106123.4 (21.4–770.9)146.3–175.18; 1309.69Mg2+, µmol10710.1 (0.8–94.6)1088.0 (0.0–56.2)1.2610618.1 (0.8–94.6)11.2–15.98; 156.29nss Mg2+, µmol1074.7 (0.00–90.6)1082.4 (0.0–43.3)1.911066.9 (0.0–90.6)K+, µmol10713.1 (2.2–124.7)1088.1 (0.0–362.8)1.6210620.9 (2.6–381.4)40.8 to 62.58; 35.69nss K+, µmol10711.7 (0.0–123.9)1086.8 (0.0–358.7)1.7010618.2 (0.0–376.4)Cl , µmol10627.4 (2.4–300.0)10829.3 (0.0–533.3)0.9310557.5 (3.6–597.3)152.9 to 194.88; 1079.59SO42−-S, µmol1028.8 (1.4–74.6)10411.0 (0.00–87.5)0.809919.9 (1.6–110.7)30.1 to 36.28nss SO42−-S, µmol1026.0 (0.00–70.1)1037.8 (0.0–83.0)0.779913.8 (0.0–106.7)54.89Rain, mm–1091.4 (0.0–16.3)1091.4 (0.0–16.3)

[i] The dry/wet ratio was obtained using the mean values, n: number of samples. Note that n can be greater than total weeks in Table 1 because we included the first six sampling weeks for which there were no available data on Saharan intrusions.

[ii] 1Corsica (Bergametti et al., 1992); 2western Mediterranean (Pulido-Villena et al., 2008b); 3north-eastern Iberian (Izquierdo et al., 2012); 4(NO3 +NH4 +) Mediterranean (Markaki et al., 2010); 5Mean value of the data reported by Bartoli et al. (2005) for days with rain in north-western Mediterranean; 6Agricultural area (USA) (Anderson and Downing, 2006); 7north-eastern Iberian Peninsula (Avila et al., 1998); 8northern Italy (Pieri et al., 2010); 9eastern Mediterranean (Al-Momani et al., 1995).
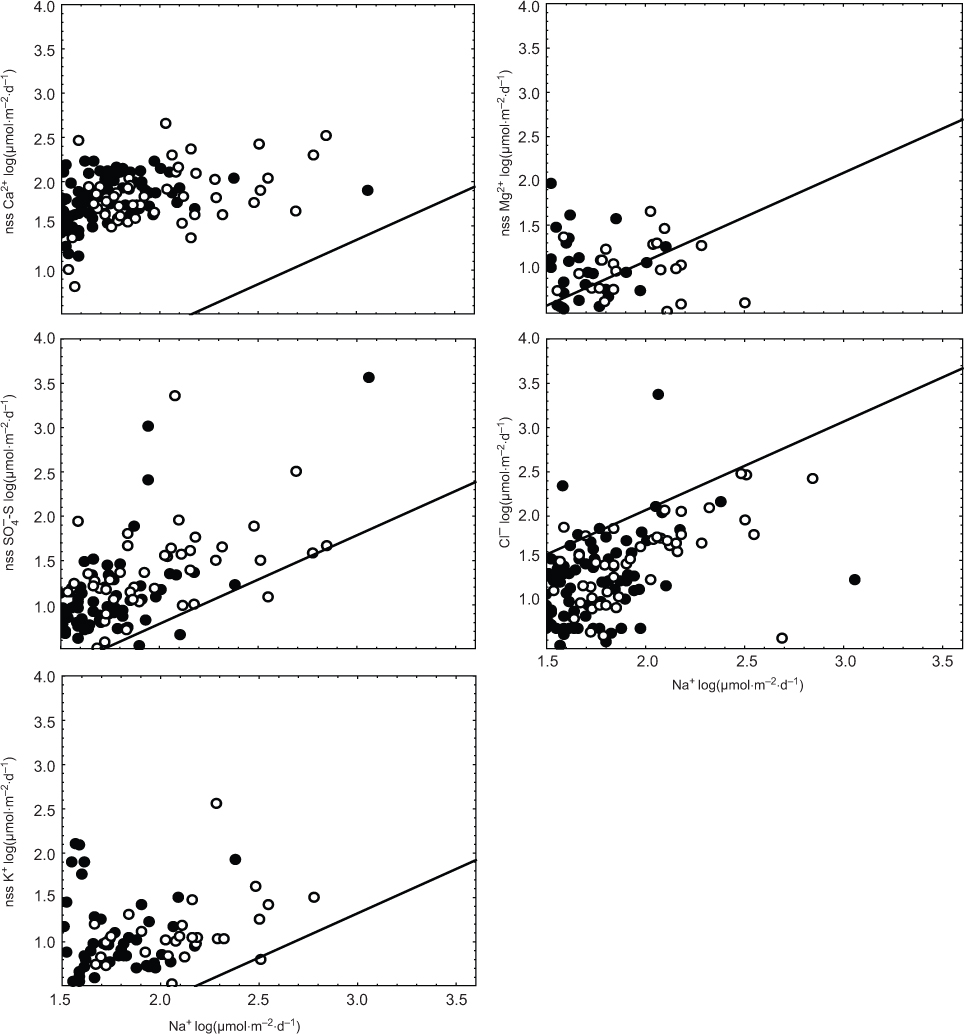
Fig. 2

Non-sea-salt (nss) Ca2+, SO4 2−, K+, Mg2+ and Cl in dry (solid dots) and wet (empty dots) deposition as function of Na+. The solid line represents the ratio of these ions to Na+ in sea water.
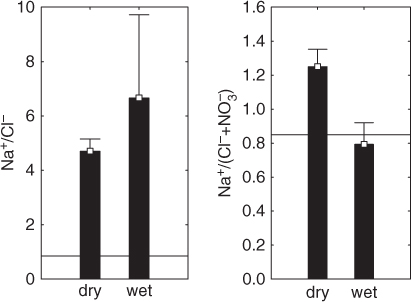
Fig. 3

Mean ratios (bars) and standard errors (whiskers) of: (A) Na+ to Cl in dry and wet deposition (not statistically different; t-test=0.887; p=0.376) and (B) Na+ to (Cl+NO3 ). These ratios in dry deposition are significantly higher than in wet deposition (t-test=2.673; p<0.01). Note the change of scale in the two plots. The solid lines represent the Na+ to Cl ratio of 0.85 in sea water.

Table 3. Mean quantities (± standard error) of the chemical species collected in dry weeks (complete absence of rain) and in rainy weeks (presence of rain) from December 2000 to December 2002. p shows probability values according to Kolmogorov–Smirnov test for mean differences

Dry weeksRainy weeksDry depositionDry depositionWet depositionSaharan intrusionsNo intrusions pSaharan intrusionsNo intrusionspSaharan intrusionsNo intrusionspPM36.7±26.222.5±15.6 < 0.02519.5±19.515.5±12.5>0.115.6±21.512.1±16.2>0.1TP1.4±0.71.0±0.9 < 0.0051.0±0.60.7±0.6>0.10.8±0.61.5±2.2>0.1SRP0.5±0.40.4±0.5 < 0.10.3±0.40.3±0.3>0.10.2±0.20.2±0.3>0.1TN50.5±25.338.3±20.1 < 0.00564.9±77.748.2±54.1>0.1117.2±108.4146.6±124.6>0.1NO 3 -N13.3±10.38.8±6.0>0.110.2±10.38.3±7.4>0.136.0±26.940.0±33.4>0.1SiO 2 -Si2.8±1.82.4±1.7>0.12.0±1.21.9±1.3>0.13.9±4.05.5±6.4>0.1Ca 2+ 96.7±42.955.6±27.6 < 0.02567.3±33.052.2±30.3>0.198.4±101.376.0±51.1>0.1nss Ca 2+ 95.5±42.754.6±27.5 < 0.02566.1±32.750.7±30.1>0.196.6±100.772.6±49.7>0.1Na + 52.9±23.845.6±22.8>0.158.7±46.169.9±84.1>0.183.4±64.4153.4±135.0 < 0.1Mg 2+ 15.5±17.97.0±6.5 < 0.0110.5±10.07.3±5.6>0.115.7±14.217.6±15.6>0.1nss Mg 2+ 9.3±18.42.6±6.3 < 0.0254.4±8.02.5±4.6>0.16.2±9.94.7±7.5>0.1K + 16.9±30.813.8±29.1 < 0.113.0±21.59.2±12.1>0.122.2±71.412.5±12.5>0.1nss K + 15.8±31.012.8±29.1 < 0.0511.8±20.97.8±11.8>0.120.4±70.89.3±10.3>0.1Cl 36.0±42.017.4±16.2 < 0.0127.4±36.727.9±59.4>0.128.6±24.187.2±124.6>0.1SO 4 2 -S10.2±8.99.4±15.0>0.19.5±13.15.7±5.6>0.118.5±18.428.7±24.2>0.1nss SO 4 2 -S7.2±8.57.0±14.4>0.16.5±13.03.0±4.5>0.114.7±18.121.2±22.5>0.1

[i] Dry deposition can be collected in both types of weeks and under the influence of Saharan dust intrusion or not. Wet deposition can be collected only in rainy weeks but with or without Saharan dust intrusions. Significant (p<0.05) and marginally significant (p<0.1) differences, are in bold. Units are µmol m−2 d−1 except PM in mg m−2 d−1.
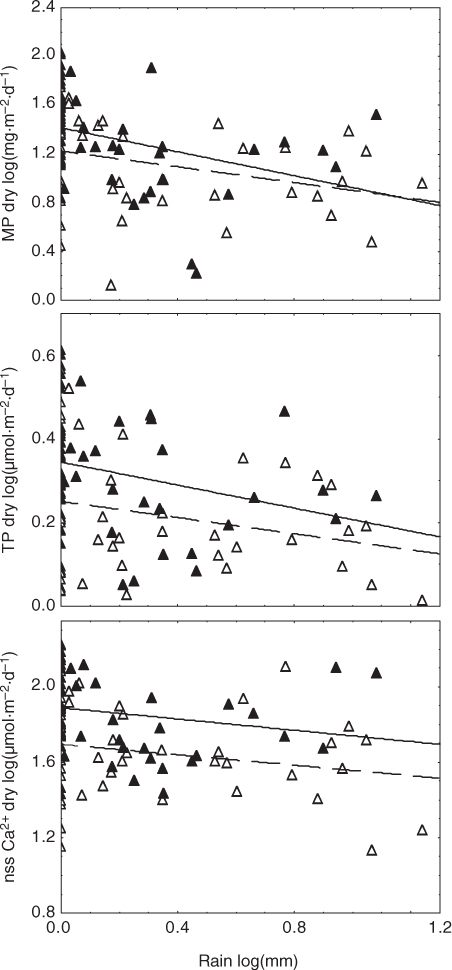
Fig. 4

Particulate matter (PM), total phosphorus (TP) and Ca2+ in dry deposition as a function of the rainfall and the presence (solid dots and continuous line) or not (empty dots and dashed line) of Saharan dust intrusions. All relationships are statistically significant according to ANCOVA results shown in Table 4.

Table 4. ANCOVA analyses of Saharan intrusions effect (categorical variable) on deposition, taking into account the amount of rain as a covariate (continuous variable). p shows the probability values of F statistic
Dry depositionWet depositionSource of variationF statisticpF statisticpPM Rain14.310.0002656.040.01779 Saharan intrusion3.490.0647390.250.61692TP Rain6.830.010346.610.01351 Saharan intrusion7.950.005810.520.47662SRP Rain4.030.0473012.410.00106 Saharan intrusion0.690.407400.020.88061TN Rain0.1260.723205.840.01988 Saharan intrusion4.880.029530.020.89492NO3 -N Rain1.970.1636618.540.00009 Saharan intrusion0.630.429020.670.41732SiO2 Rain4.000.0482311.560.00145 Saharan intrusion0.800.374710.020.87851nss Ca2+ Rain5.520.020798.080.00676 Saharan intrusion16.260.000111.220.27456Na+ Rain0.910.3435441.310.00000 Saharan intrusion0.240.627154.970.03082nss Mg2+ Rain0.040.846461.320.25663 Saharan intrusion7.720.006560.630.43111nss K+ Rain0.690.4086119.860.00006 Saharan intrusion0.530.468180.250.61606Cl Rain0.070.7963512.400.00105 Saharan intrusion0.940.335393.450.07037nss SO42−-S Rain2.120.148912.520.11988 Saharan intrusion1.540.217480.140.70759

[i] Significant (p<0.05) and marginally significant (p<0.1) values are in bold.

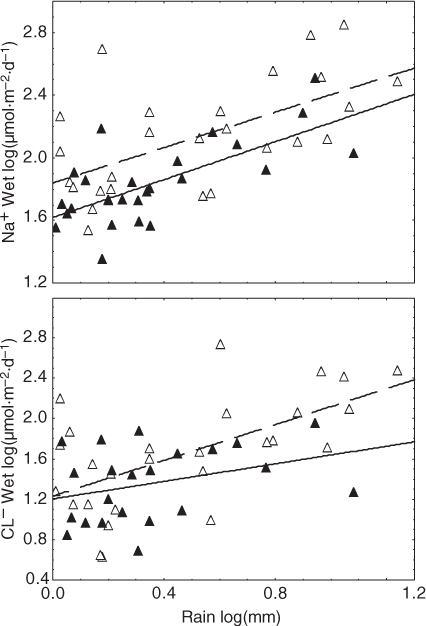
Fig. 5

Na+ and Cl in wet deposition as a function of the rainfall and the presence (solid dots and continuous line) or not (empty dots and dashed line) of Saharan dust intrusions. Na+ and Cl relationships are statistically significant according to ANCOVA results shown in Table 4.
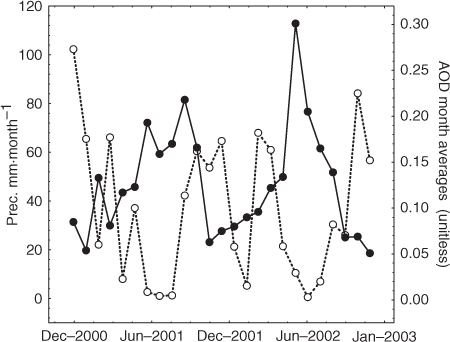
Fig. 6

Times series monthly averages of aerosol optical depth (AOD, solid line) provided by NASA Giovanni portal: (http://gdata1.sci.gsfc.nasa.gov/daac-bin/G3/gui.cgi?instance_id=MISR_Monthly_L3) and precipitation (dashed line): (http://gdata1.sci.gsfc.nasa.gov/daac-bin/G3/gui.cgi?instance_id=GPCC_Monthly). Values are integrated for the study area as shown in the frame of Fig. 1.

Language: English
Page range: 18720 - 18720
Submitted on: May 9, 2012
Accepted on: Jan 29, 2013
Published on: Jan 1, 2013
Published by: Stockholm University Press
In partnership with: Paradigm Publishing Services

© 2013 Rafael Morales-Baquero, Elvira Pulido-Villena, Isabel Reche, published by Stockholm University Press
This work is licensed under the Creative Commons Attribution 4.0 License.