Fig. 1.
Geographical locations of the observational sites of Minamitorishima (MNM) and Yonagunijima (YON).
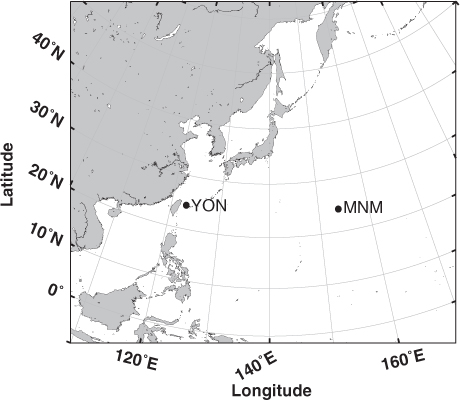
Fig. 2.
Hourly mean observed atmospheric 222Rn concentration at MNM (a), YON (b). White circles indicate monthly mean concentration of 222Rn calculated from hourly mean data.
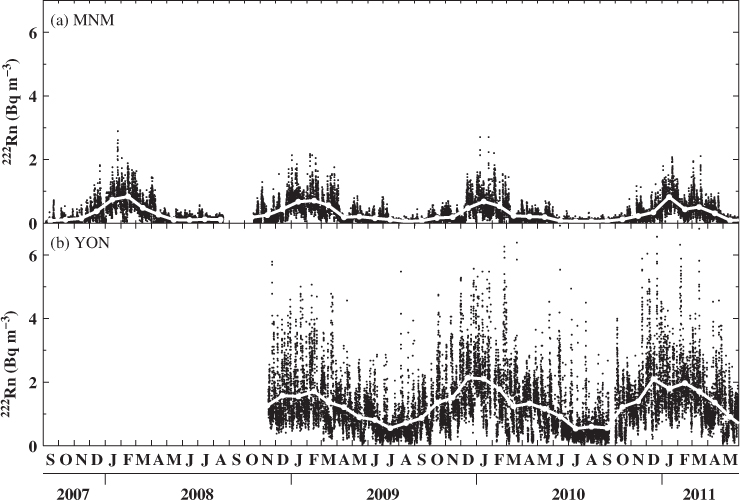
Fig. 3.
Time series of hourly mean concentrations of atmospheric 222Rn, CH4, CO2 and CO observed at MNM in January 2010. Arrows point to the peak of each enhanced 222Rn event. The dashed and solid lines for 222Rn (top panel) are the smoothed fitting curve and the upper threshold of smaller ΔRn variability, respectively. The black and grey dots represent the enhanced 222Rn (ERN) events and non-enhanced events, respectively (see text). The black dots for other gases relate to the corresponding periods of the ERN events.
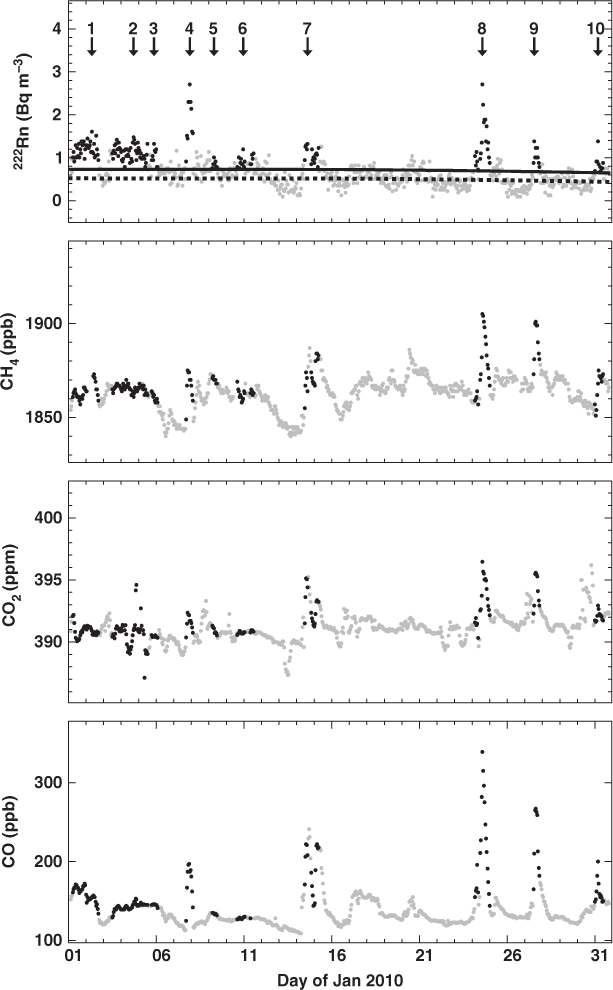
Fig. 4.
Scatter plots of ΔCH4, ΔCO2 and ΔCO as a function of ΔRn observed at MNM in January 2010. The circles, crosses, diamonds and triangles represent enhanced 222Rn events of 4, 7, 8 and 10 in Fig. 3, respectively. The solid line represents the RMA regression for each event.
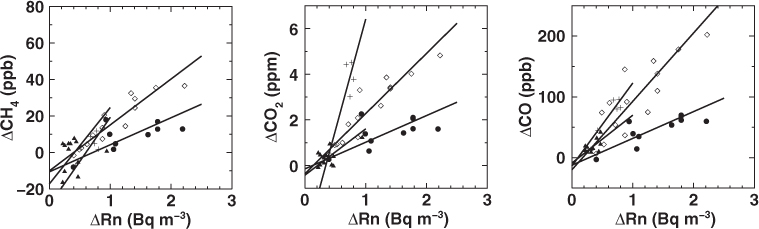
Fig. 5.
Scatter plots of ΔCH4, ΔCO2 and ΔCO as a function of decay-corrected ΔRn of the event of 4, 7, 8 and 10 in Fig. 3. The solid lines represent the RMA regressions for each plot.
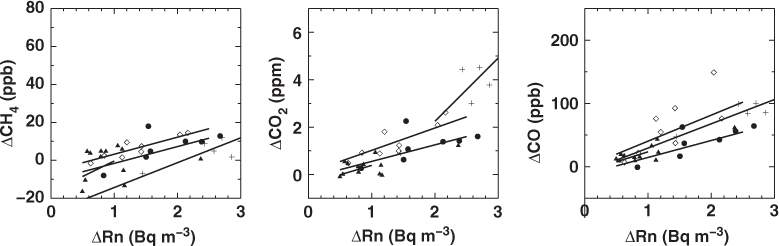
Fig. 6.
Frequency distribution of the enhancement ratios of ΔCO/ΔRn, ΔCH4/ΔRn and ΔCO2/ΔRn for the ERN events observed at MNM and YON from December to April. The open and grey bars represent the observed and preformed enhancement ratios, respectively. Data with correlation coefficients greater than 0.5 are used here.
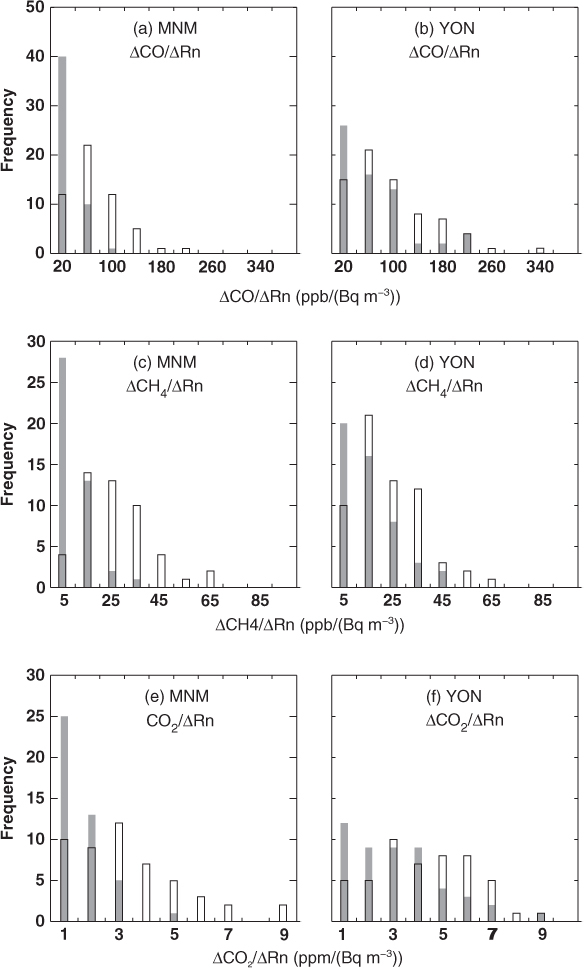
Fig. 7.
Simulated and observed atmospheric concentration of 222Rn at MNM (a) and YON (b) in 2010. The black dots represent 6-hourly mean observed 222Rn and the red solid line represents simulated 222Rn.
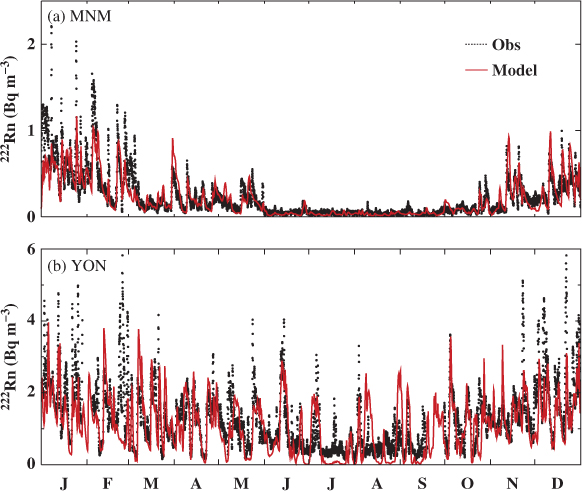
Fig. 8.
Contributive percentage and its grid-point distributions for the 222Rn tagged traced experiments for MNM (left panel) and YON (right panel). The resolutions of the grid are 5°×5° for MNM and 1.875°×1.875° for YON.
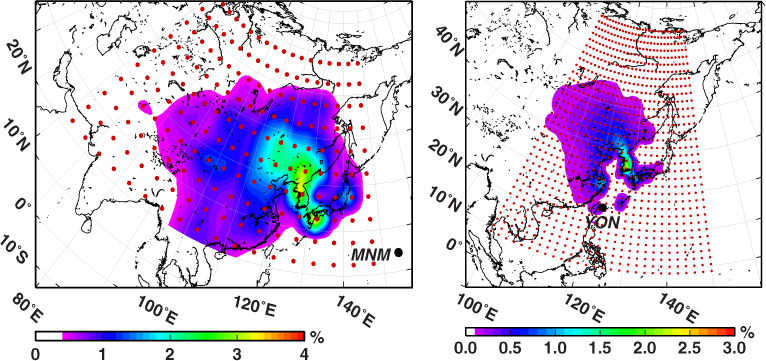
Fig. 9.
Identified catchment areas for MNM (a) and YON (b). The grey shaded area represents the identified catchment area, together with the CO emission field (red contour) of the EDGAR ver. 4.2.
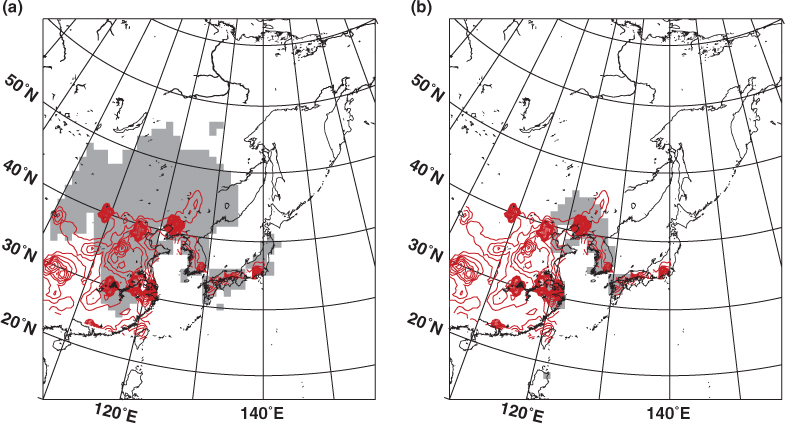
Table 1. Comparison of estimated emissions of CO, CH4, CO2 for the catchment areas of MNM and YON
[i] The error (±) represents the estimated uncertainties for the catchment areas.
[ii] *The emissions of EDGAR and CDIAC were calculated by extrapolation of the data from 2005 to 2008, and the emissions of REAS are predictions by linear interpolation between 2003 and 2010 (estimated).
[iii] **The biogenic CO2 emissions based on CASA were subtracted from the 222Rn-derived CO2 emissions.
Fig. 10.
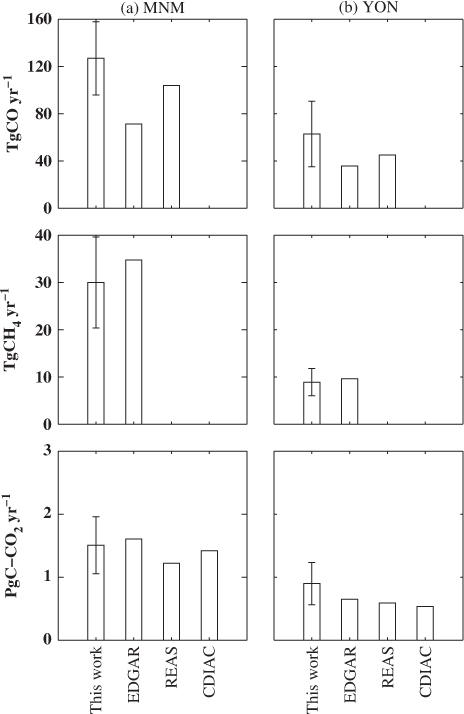
Comparisons of the estimated emissions of CO, CH4 and CO2 between this study and three emission databases for the catchment areas of MNM and YON. The databases are derived from the EDGAR ver.4.2, REAS for 2009, CDIAC ver. 2011. The error bars represent the estimated uncertainties (see text).