Have a personal or library account? Click to login
Implications of regional surface ozone increases on visibility degradation in southeast China Cover

Implications of regional surface ozone increases on visibility degradation in southeast China

Open Access
|Jan 2012

Figures & Tables

Fig. 1. 

Locations of the Hong Kong Observatory, Air Quality Monitoring Station (Central/Western) and Waglan Island.
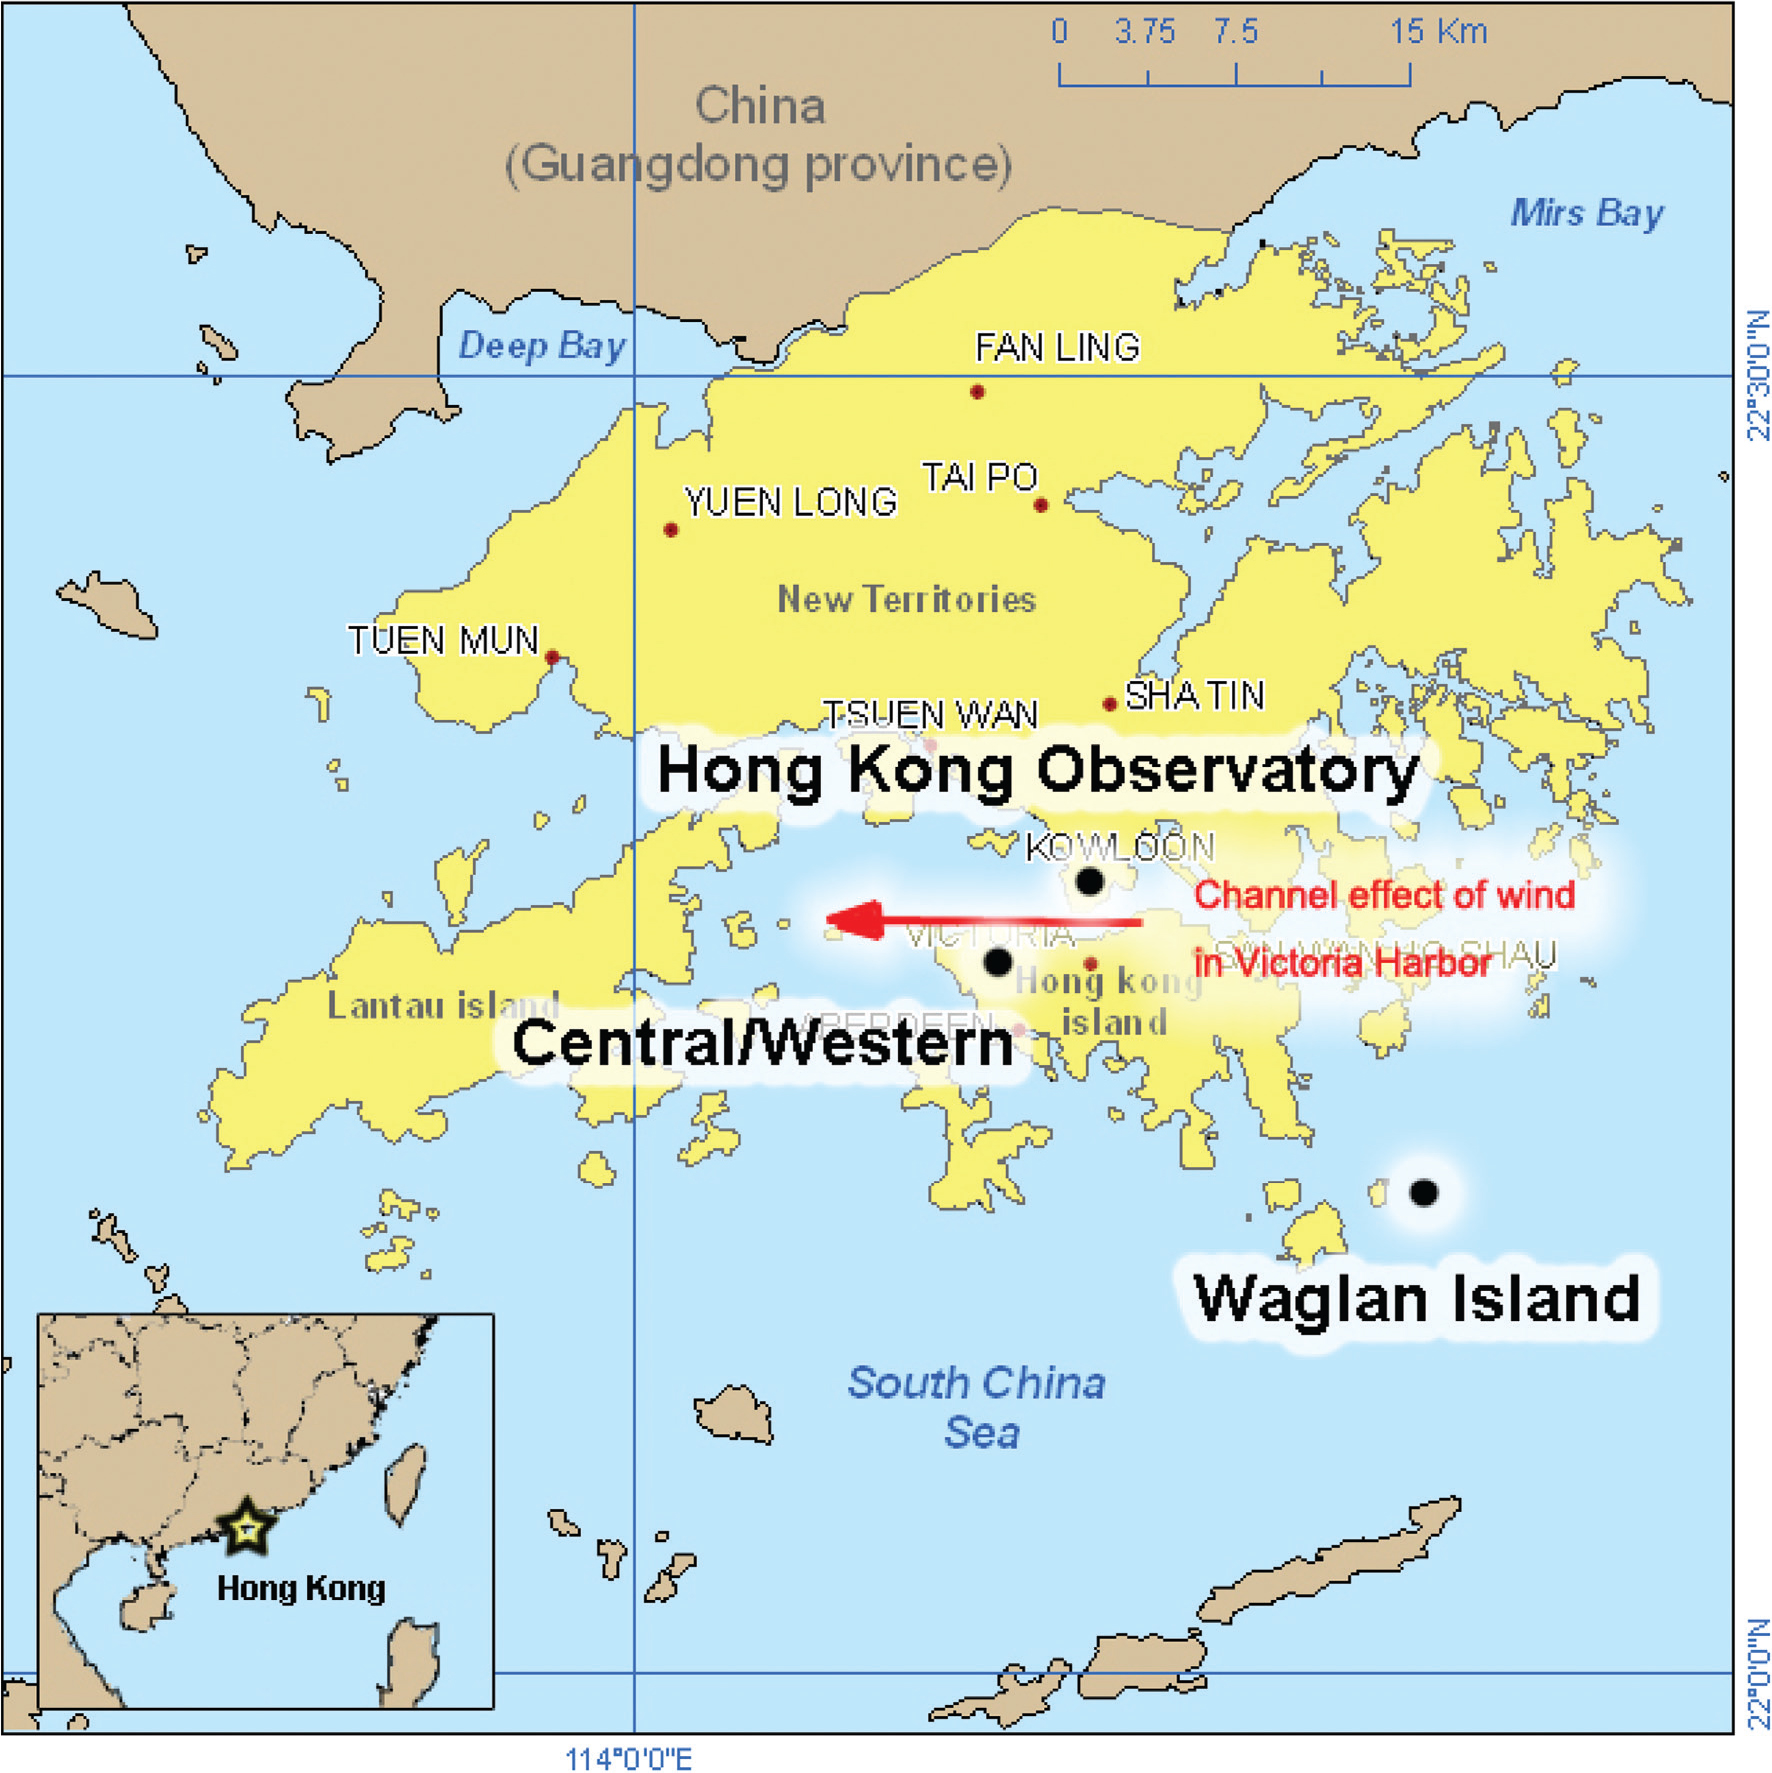
Fig. 2. 

Time series of RV occurrence, concentrations of SO2 and O3. (Bars, symbols, solid lines and dotted lines show monthly mean, annual mean, 12-month running mean and overall linear regression trend, respectively.)
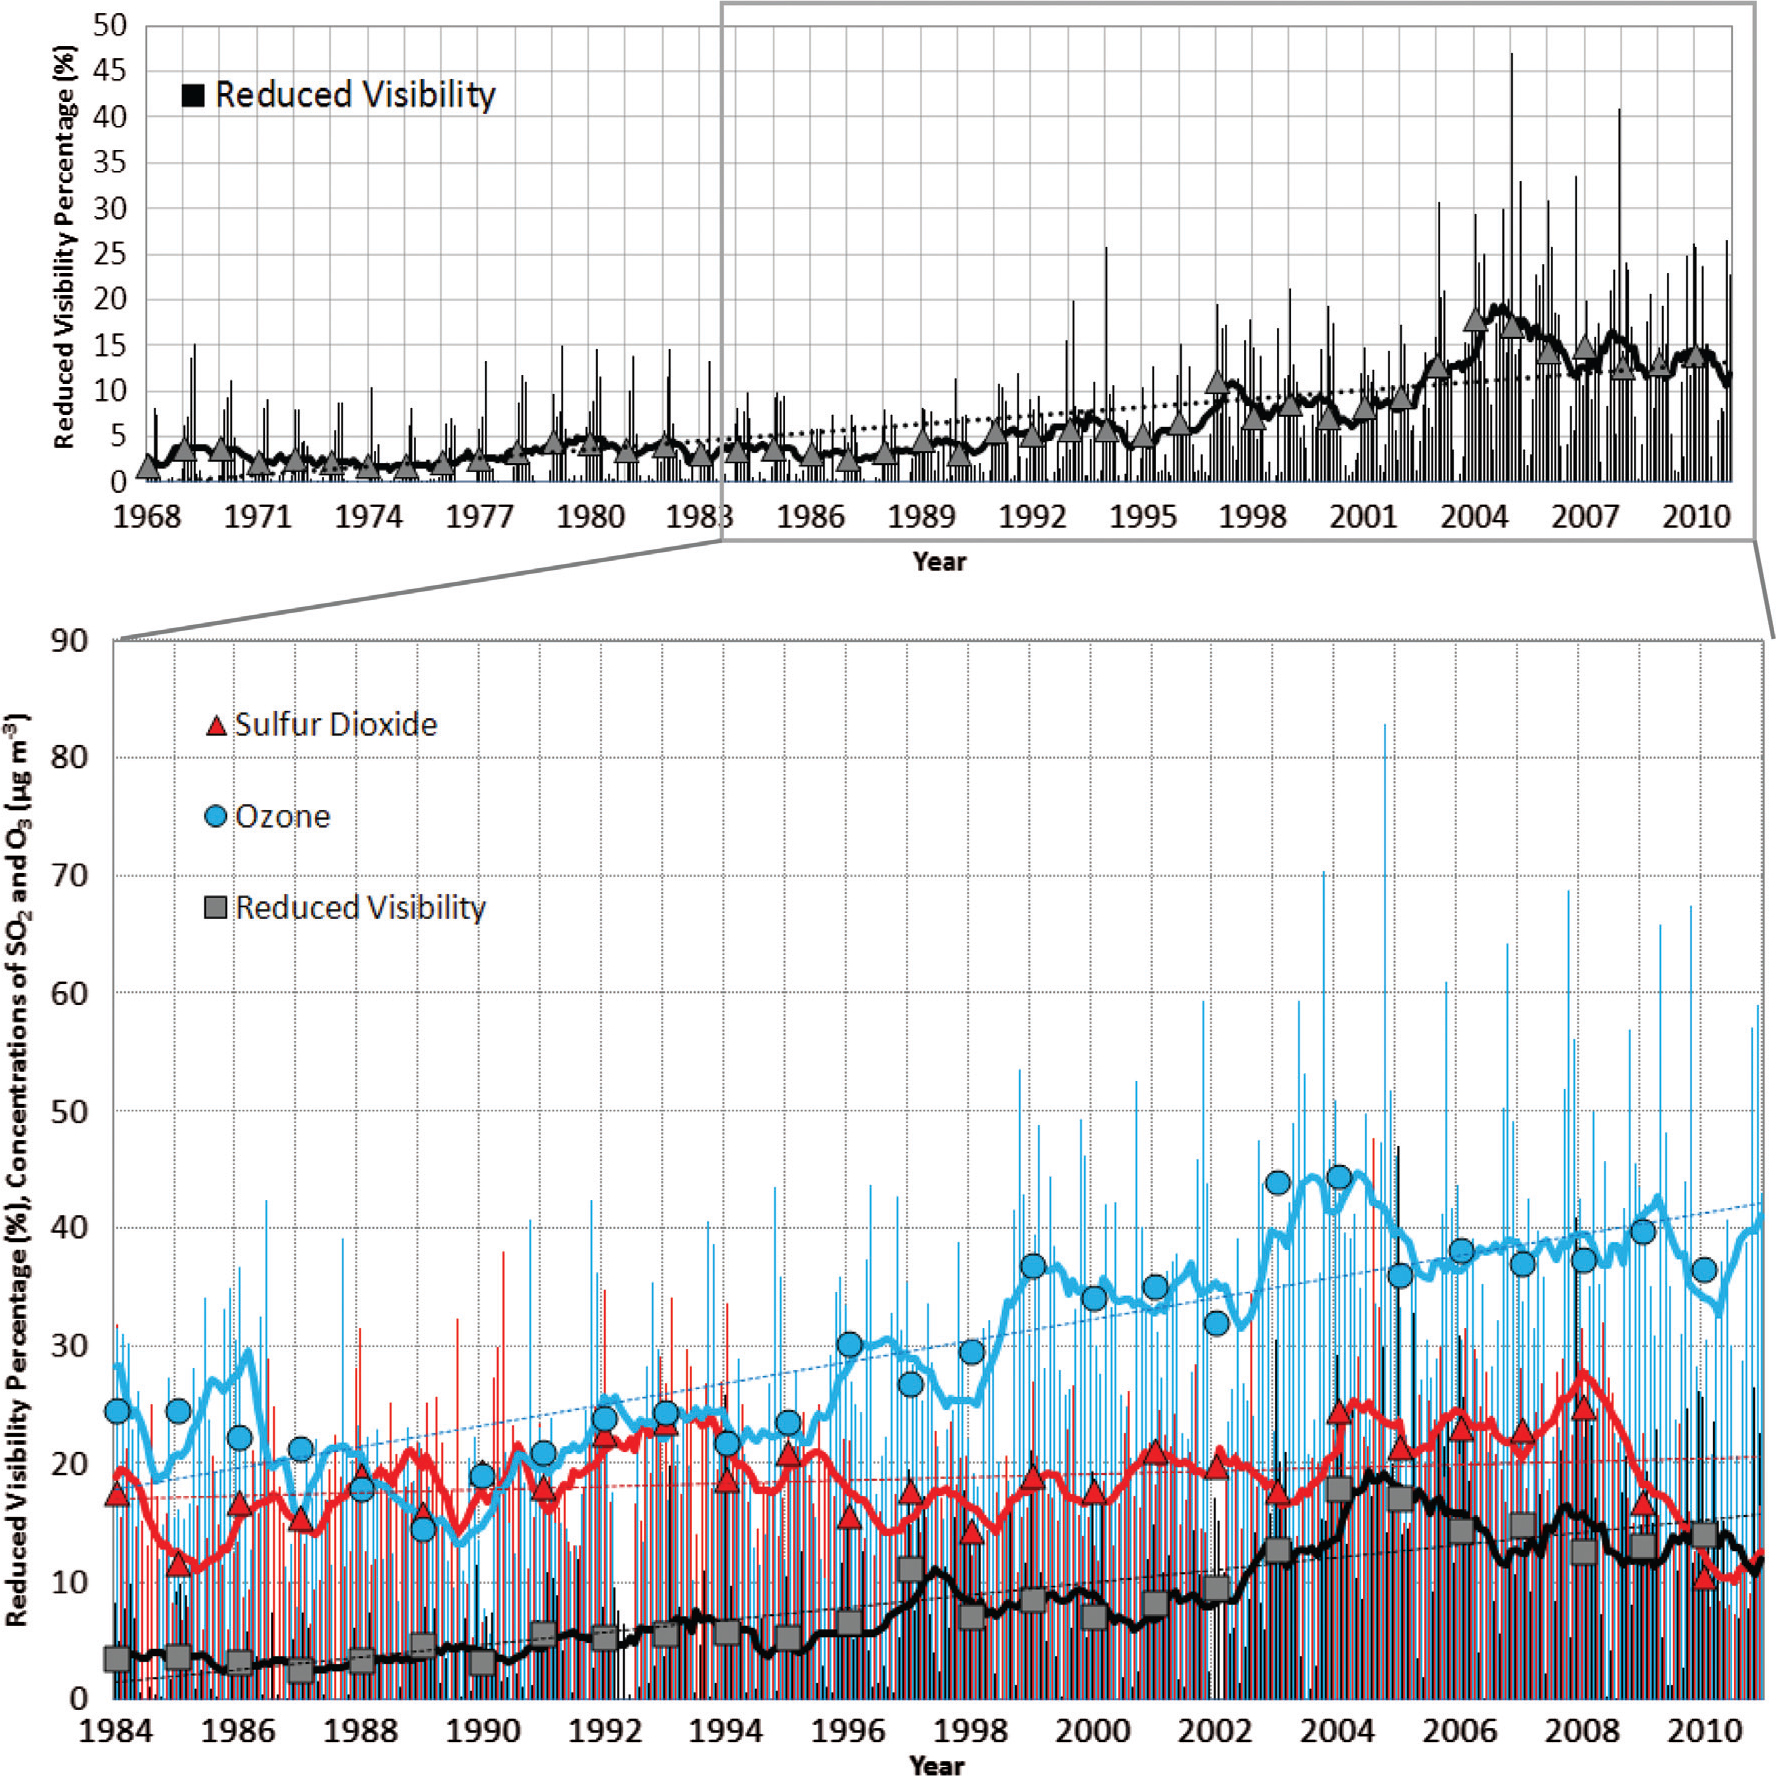
Table 1. Overall and seasonal annual trends of RV, SO2, NO2, NOx, O3, and PM10 (winter: December, January, and February; spring: March, April, and May; summer: June, July, and August; autumn: September, October, and November)

Period Overall Winter Spring Summer Autumn Reduced visibility (% per yr) 1968–2008 0.31% (p<0.001) 0.48% (p<0.001) 0.22% (p<0.001) 0.11% (p<0.001) 0.43% (p<0.001) 1990–2008 0.61% (p<0.001) 0.80% (p<0.001) 0.58% (p<0.001) No trenda 0.90% (p<0.001) O3 (µg m−3 per yr) 1984–2008 0.90 (p<0.001) 0.75 (p<0.001) 0.98 (p<0.001) 0.63 (p<0.001) 1.47 (p<0.001) 1990–2008 1.06 (p<0.001) 1.06 (p<0.001) 1.20 (p<0.001) 0.76 (p<0.001) 1.32 (p<0.001) SO2 (µg m−3 per yr) 1984–2008 No trend No trend No trend No trend 0.20 (p<0.01) NO2 (µg m−3 per yr) 1984–2008 No trend No trend No trend No trend 0.45 (p<0.10) NO x (µg m−3 per yr) 1984–2008 No trend No trend No trend No trend No trend PM10 (µg m−3 per yr) 1993–2008 No trend No trend No trend No trend No trend

[i] a‘No Trend’ indicates that the trend is statistically insignificant at the significance level of 0.10.

Fig. 3. 

Seasonal Patterns of (a) precipitation and RV, (b) concentrations of PM10, NO2, NOx, (c) SO2, and O3.
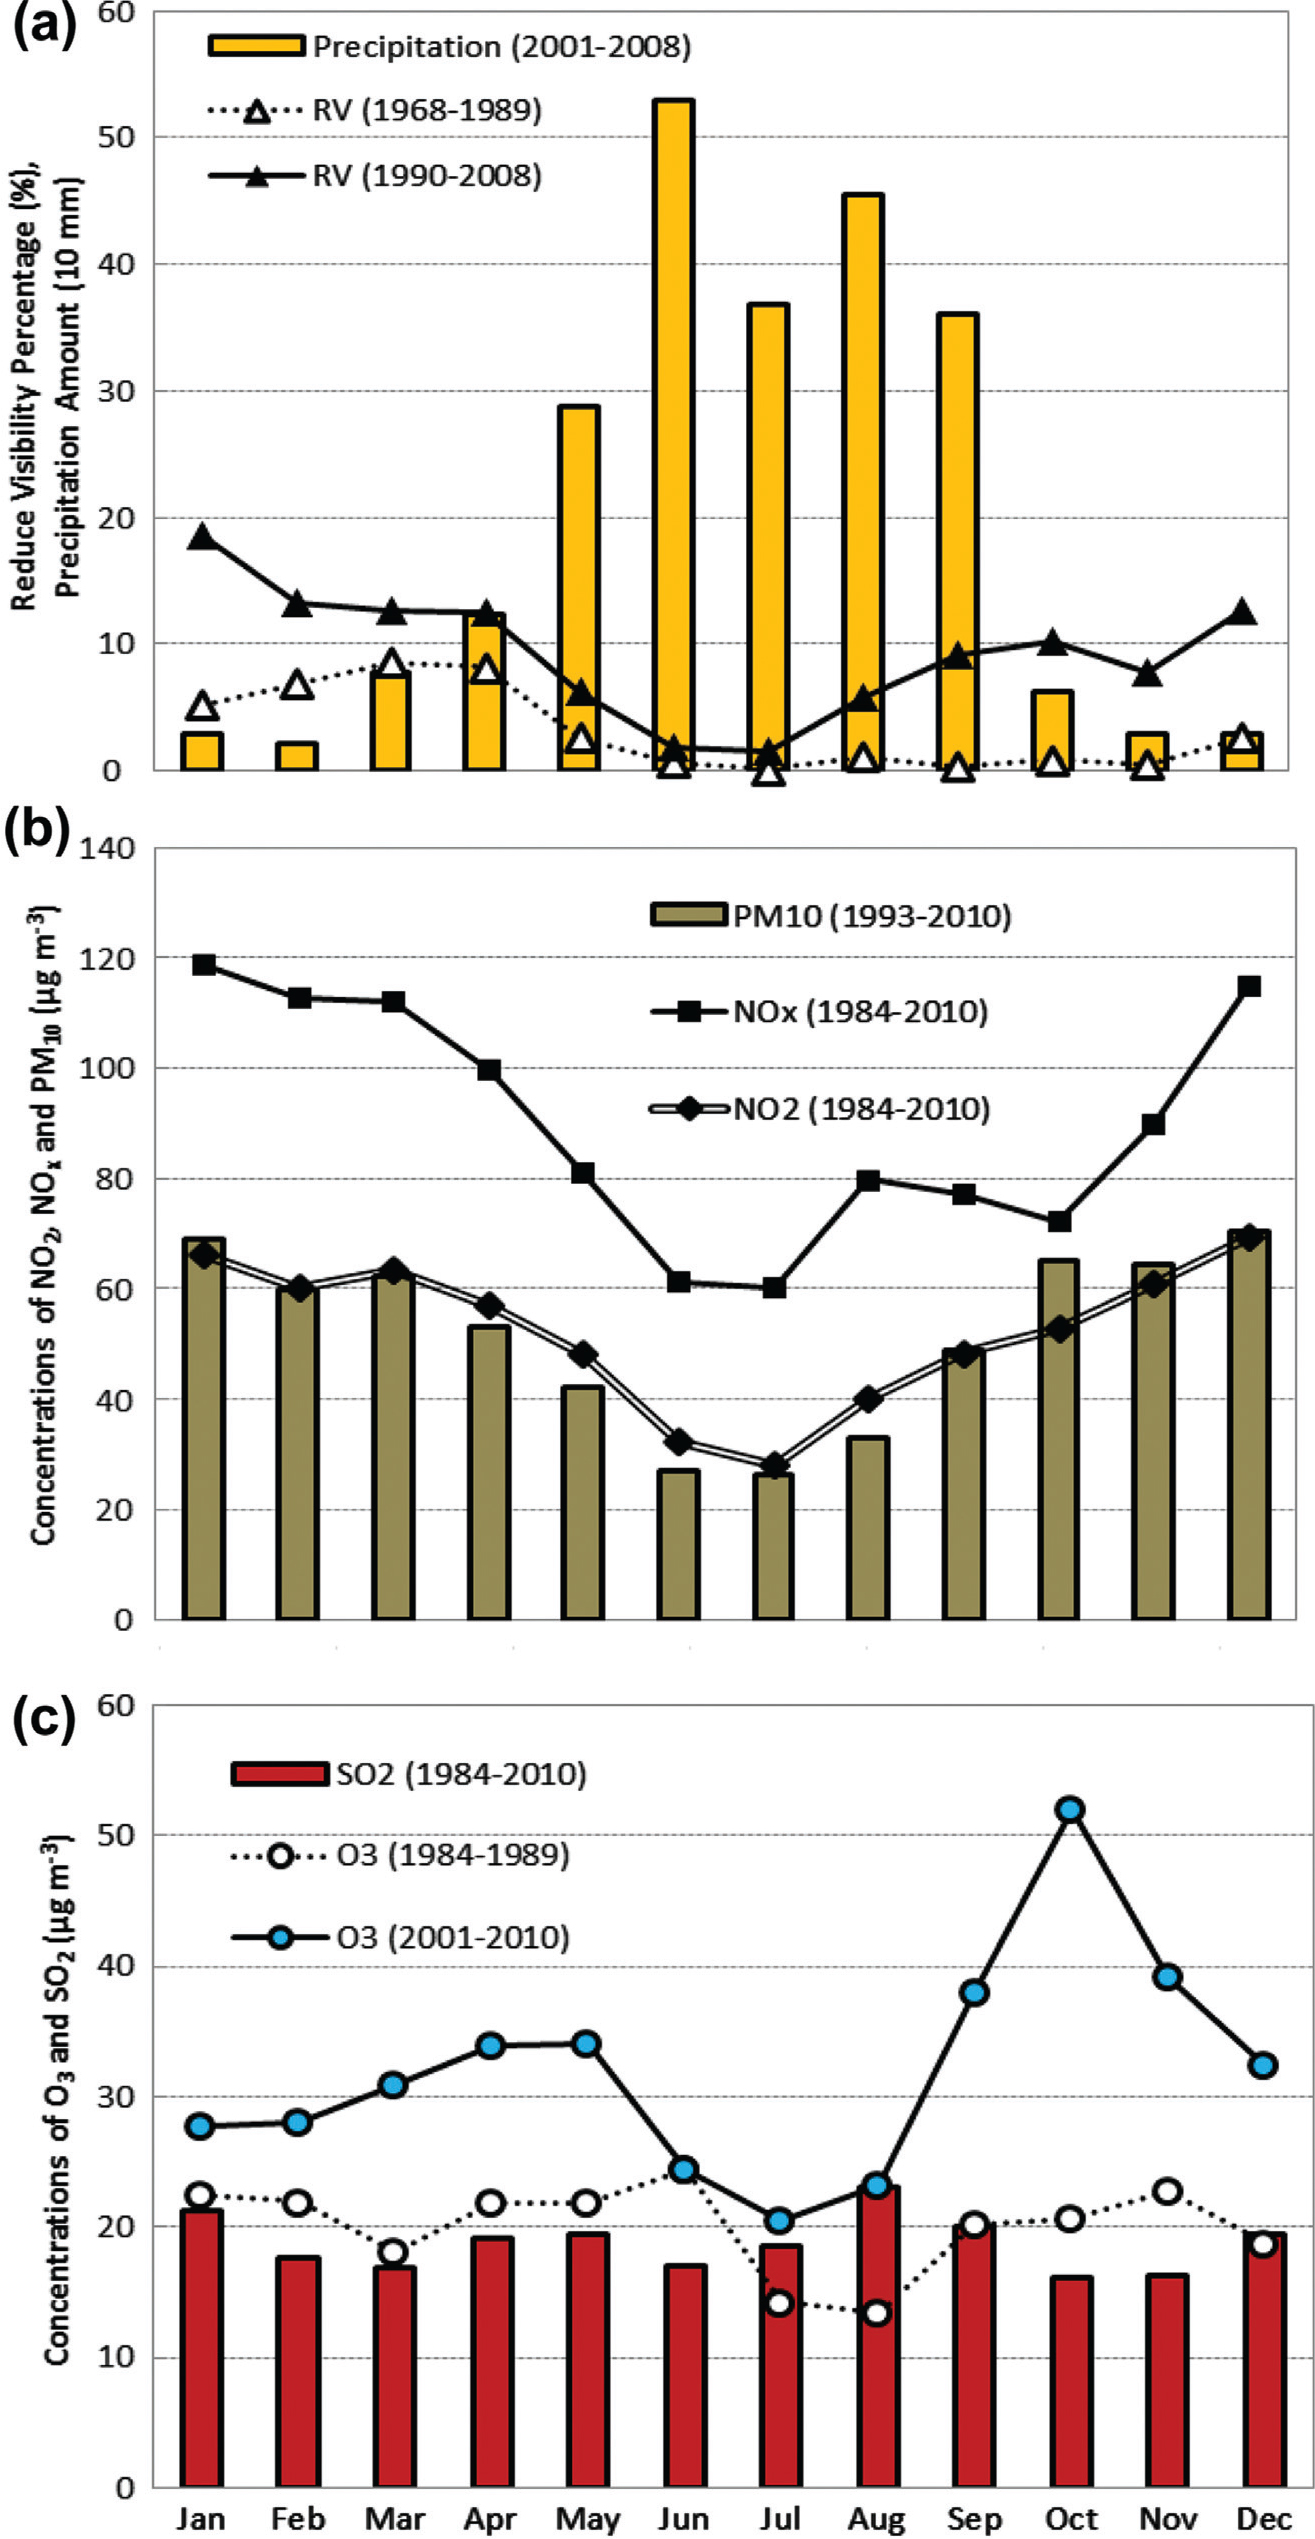
Fig. 4. 

(a, b, c) Wind roses, (d, e, f) number of moderately hazy days (light blue) and hazy days (blue) and (g, h, i) RV vs. wind direction sectors during 2001–2004.
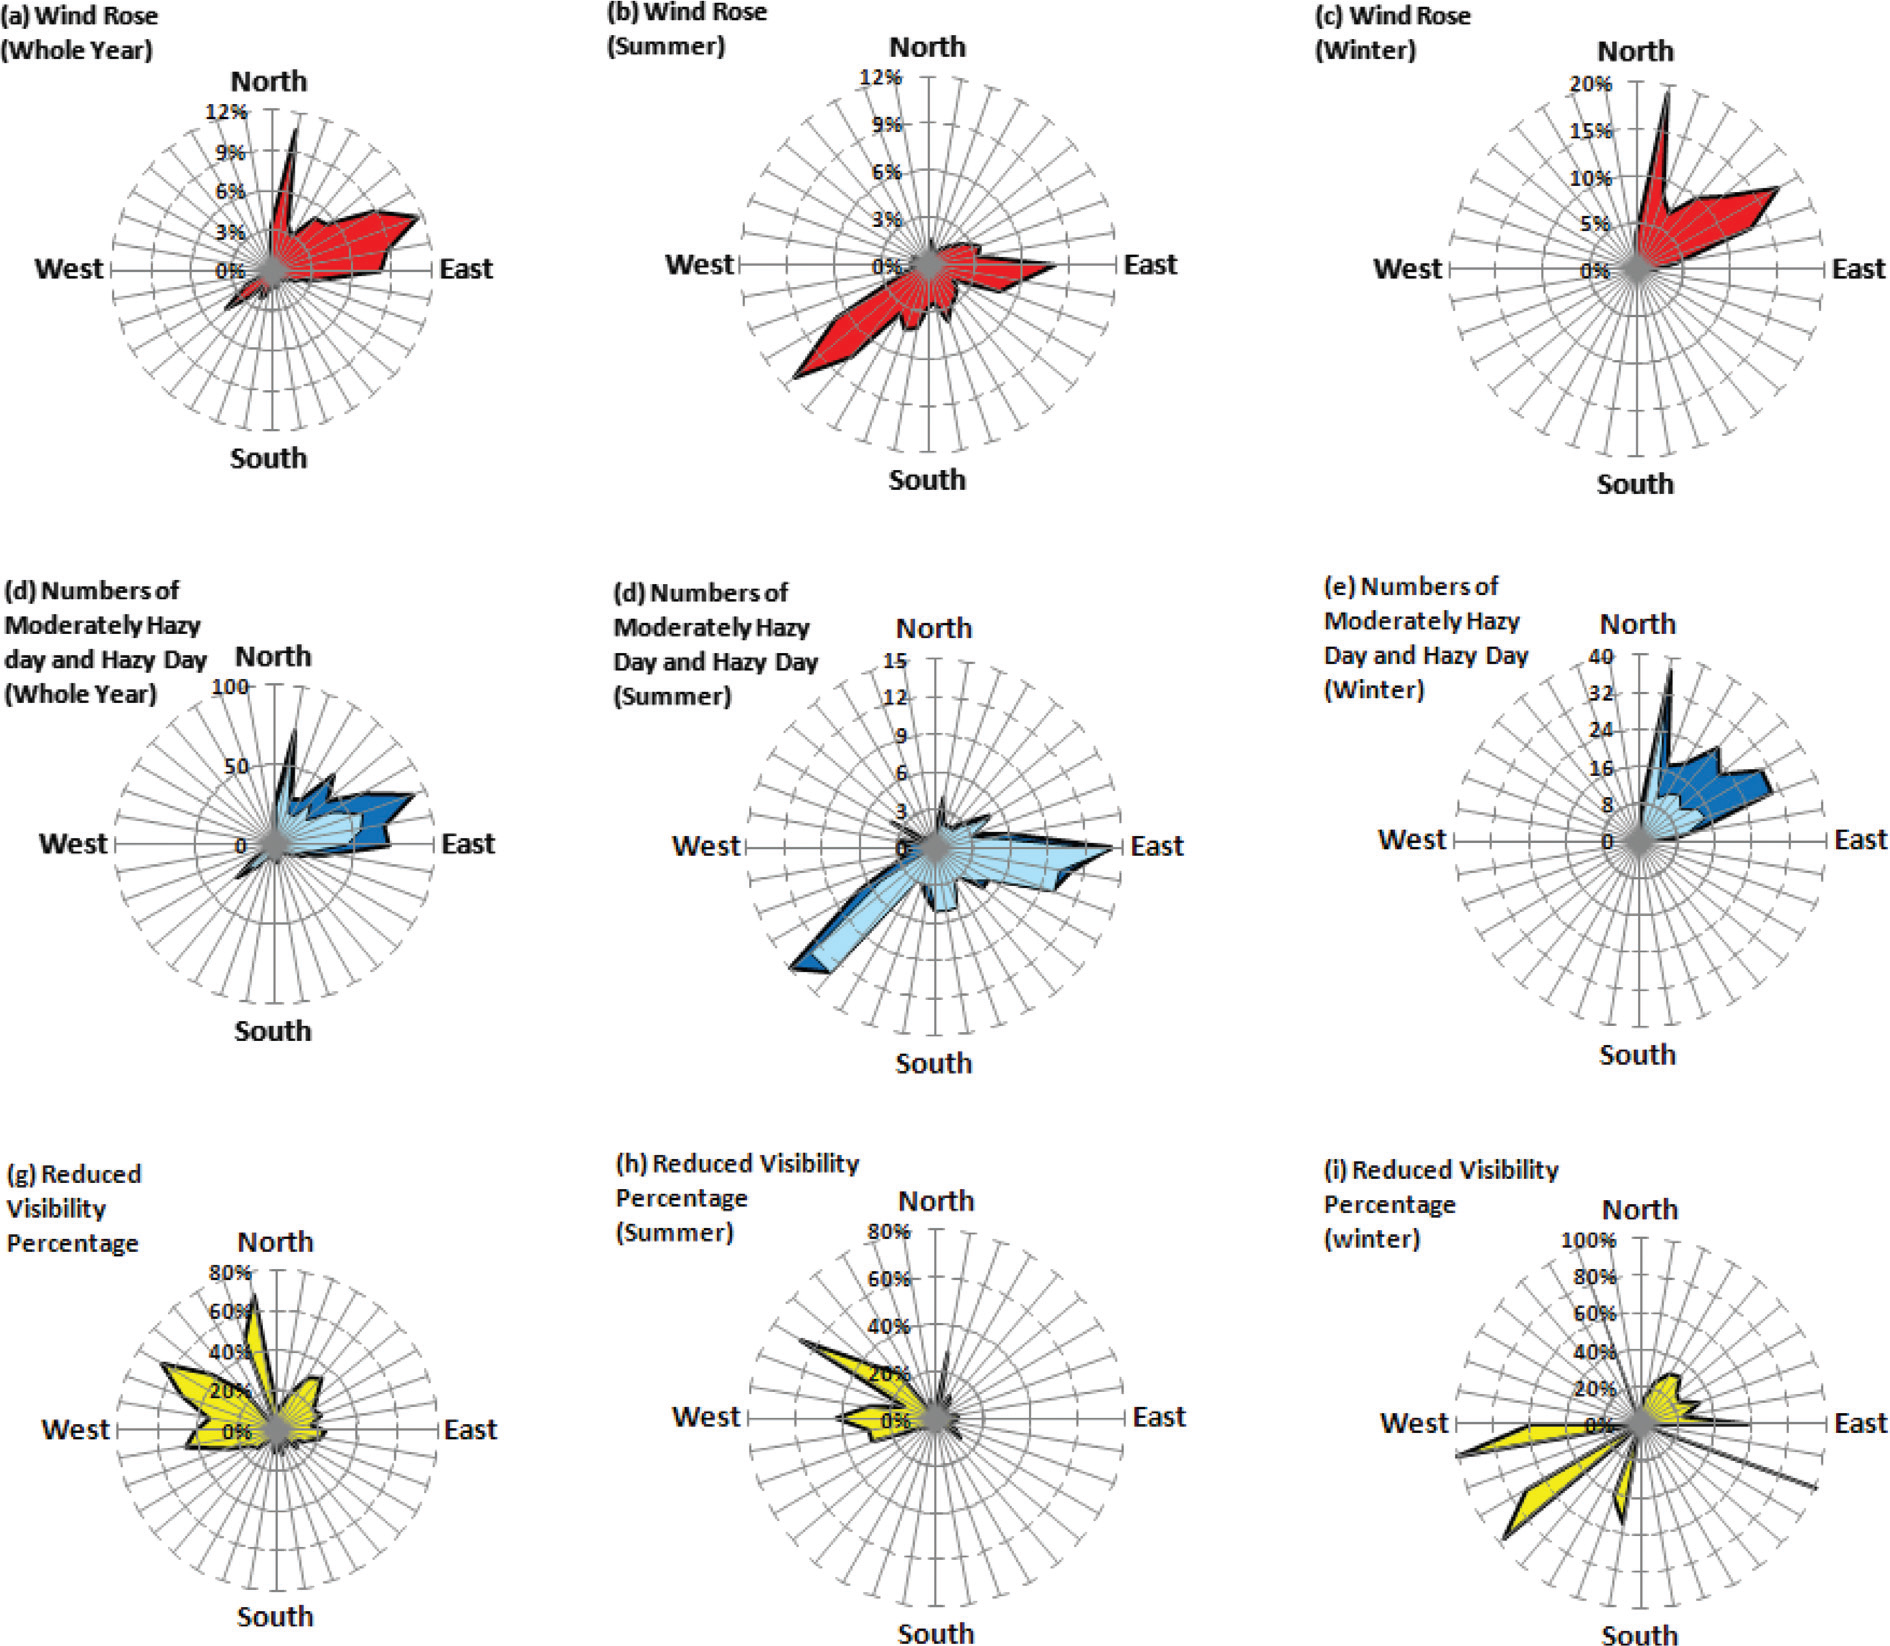
Fig. 5. 

120-h backward air trajectories on hazy days (a: summer; b: winter) and moderately hazy days (c: summer; d: winter) at Hong Kong during 2001–2004.
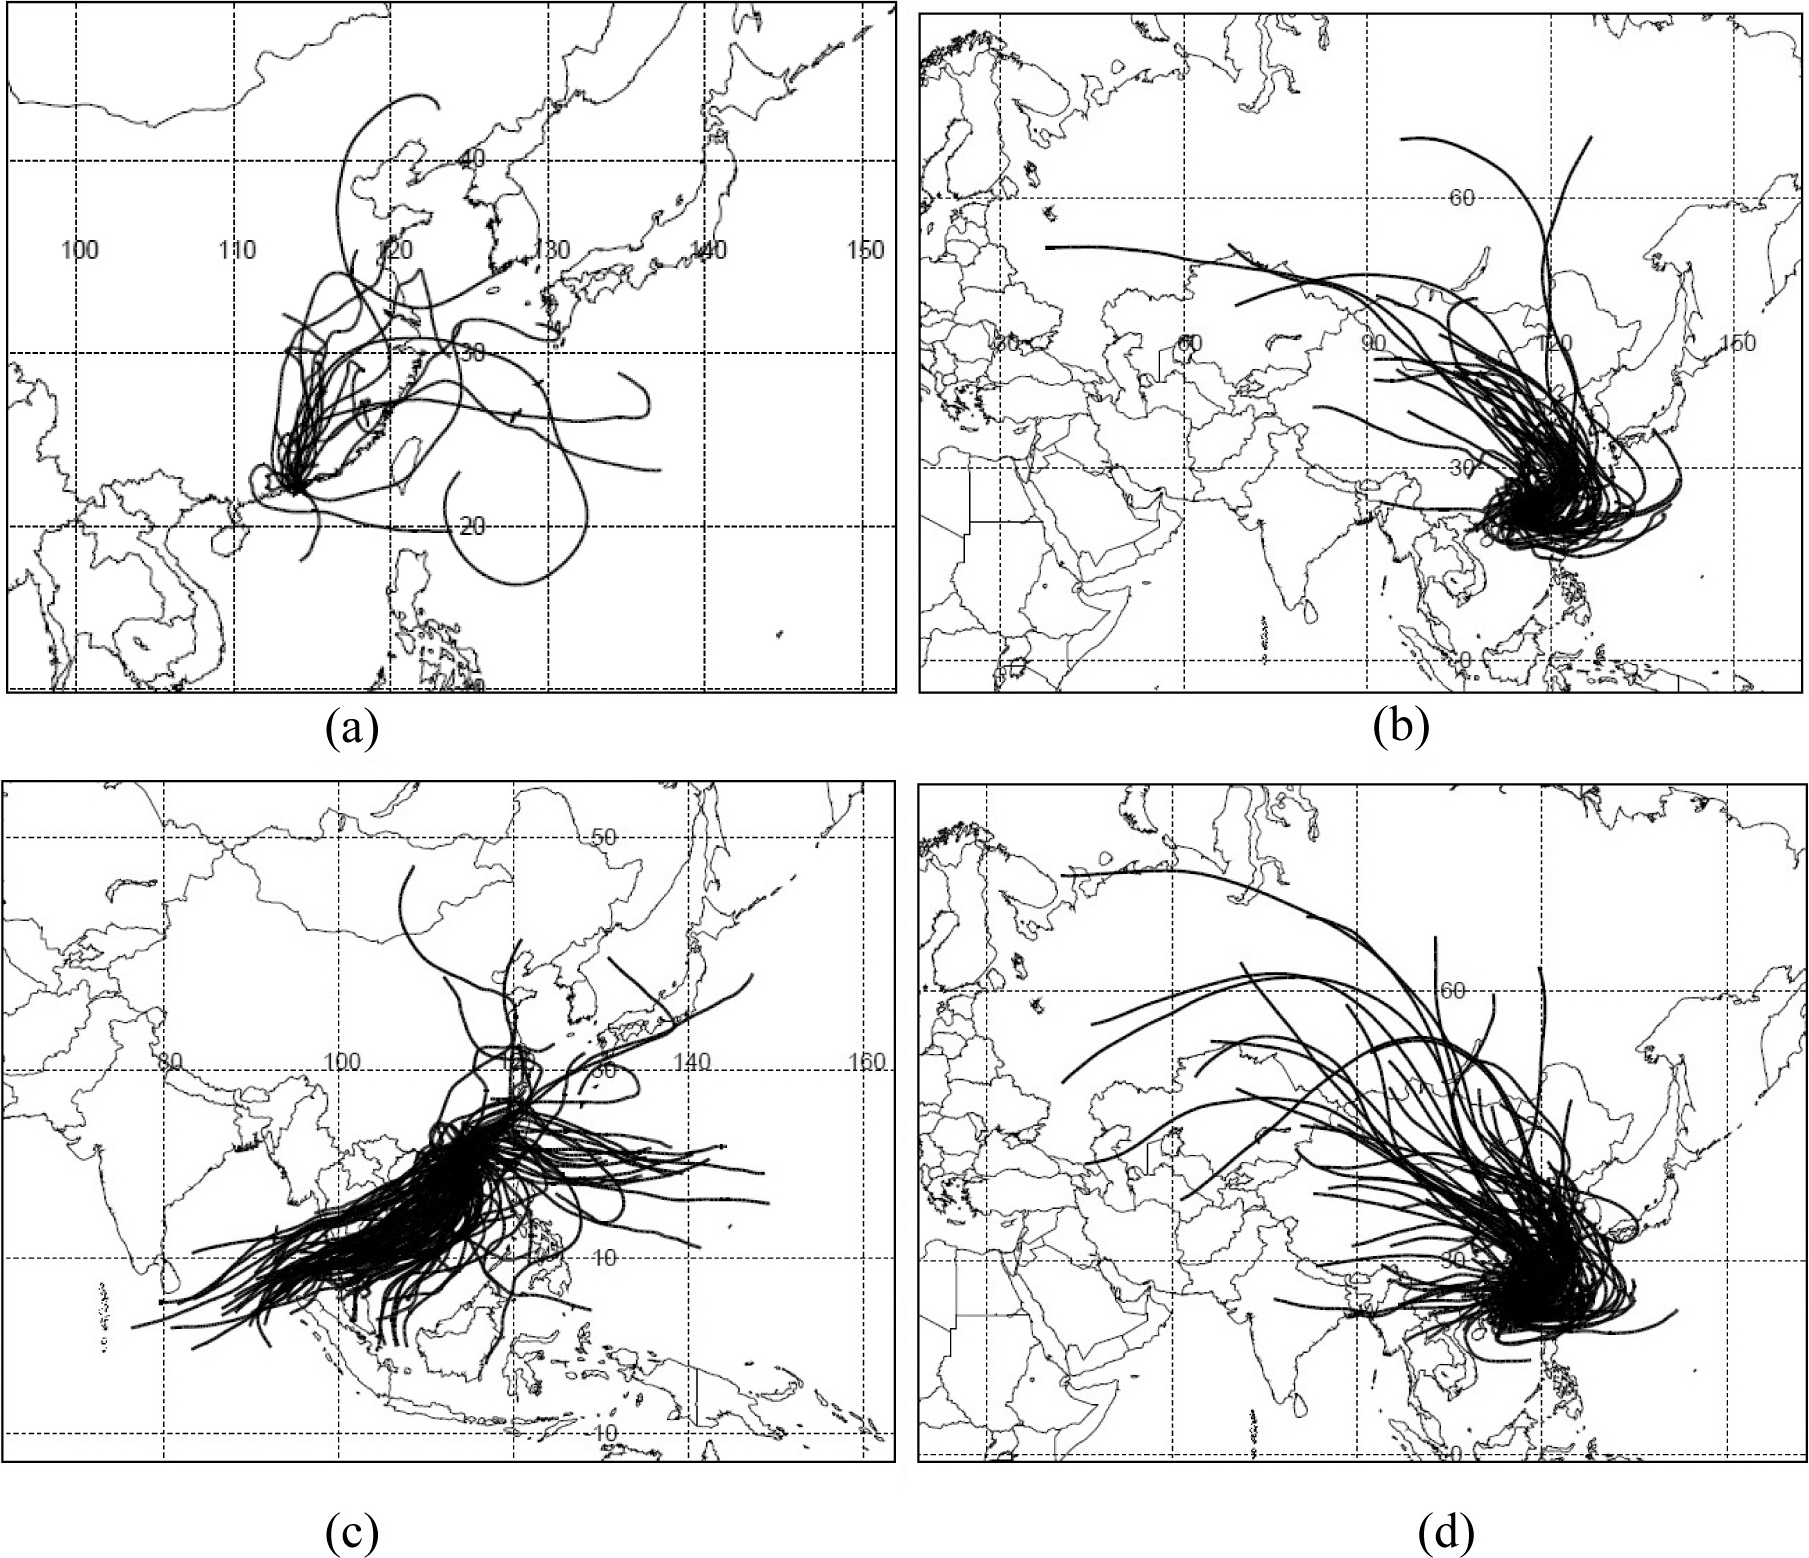
Fig. 6. 

Annual total emissions and ship emissions of SO2, NOx and PM10 (Data source: http://www.epd.gov.hk/epd/english/environmentinhk/air/data/emission_inve.html).
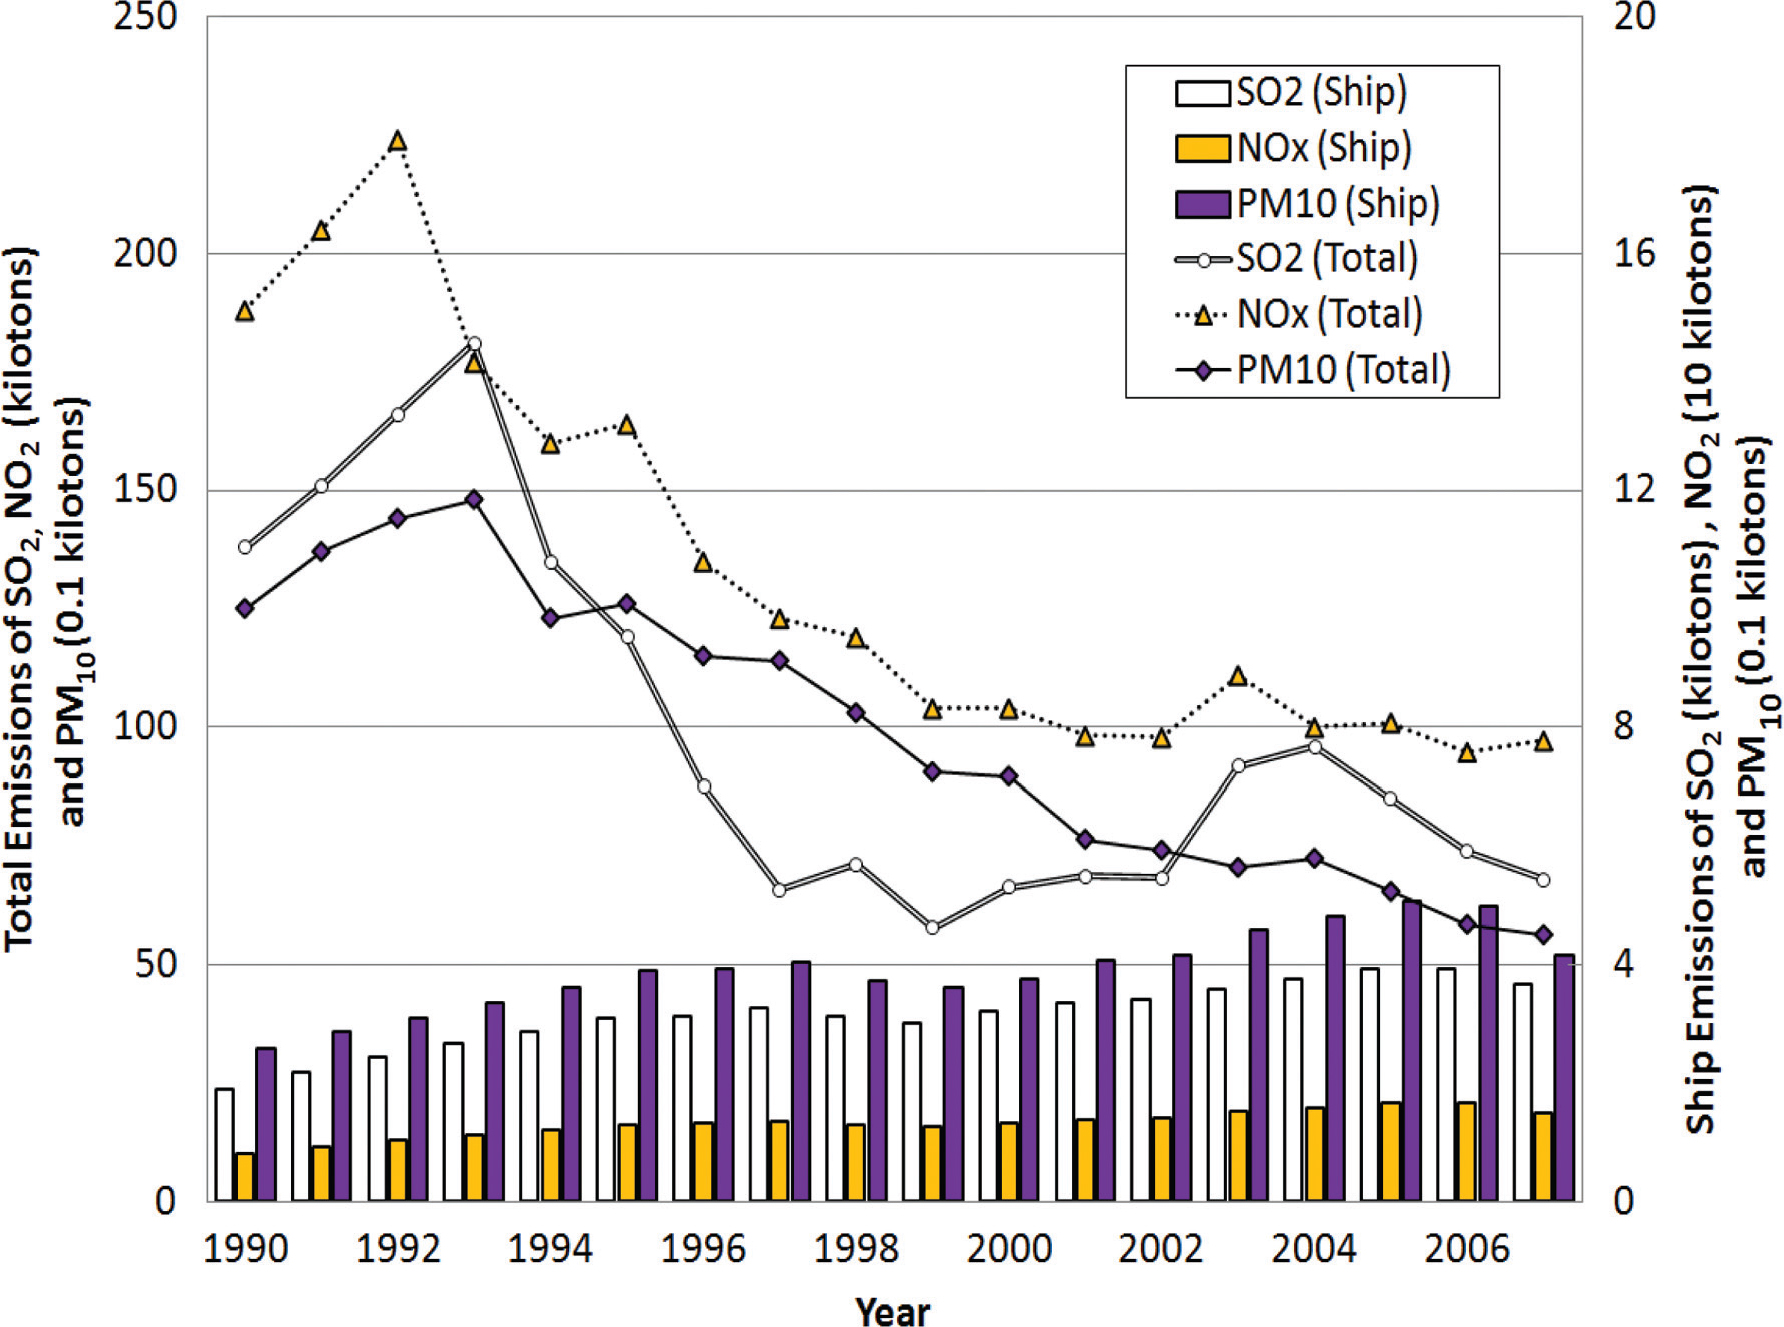
Table 2a. Summary of equations calculated by multiple linear regression method

Regression model Period Independent variables Equationa Model 1 1993–2008 O3, SO2, NO x , NO2, PM10 [RV]=0.17 [SO2]+0.31 [NO2]+0.17 [O3]−15.89 Model 2 1984–2008 O3, SO2, NO x , NO2 [RV]=0.20 [SO2]+0.11 [NO2]+0.27 [O3]−12.63 Model 3 1993–2008 O3, SO2, NO x , NO2 [RV]=0.18 [SO2]+0.32 [NO2]+0.18 [O3]−16.34 Model 4 1984–1992 O3, SO2, NO x , NO2 [RV]=0.11 [NOx]−0.09 [NO2]−1.12

[i] aUnits of RV are % and those of all air pollutants are µg m−3.

Table 2b. Summary of regression coefficients and partial correlation coefficients calculated by the multiple linear regression method

Regression model Period Independent variables Partial correlation coefficient Regression coefficient (± standard error) O3 0.25 0.17±0.05 SO2 0.16a 0.17±0.08 Model 1 1993–2010 NO x 0.01 0.00±0.03 NO2 0.28b 0.31±0.08 PM10 0.02 0.01±0.06 O3 0.38b 0.27±0.03 Model 2 1984–2010 SO2 0.16b 0.20±0.06 NO x 0.10 0.04±0.02 NO2 0.17c 0.11±0.04 O3 0.23b 0.18±0.04 Model 3 1993–2010 SO2 0.17a 0.18±0.07 NO x 0.01 0.00±0.03 NO2 0.40b 0.32±0.05 O3 −0.09 −0.04±0.04 Model 4 1984–1992 SO2 0.13a 0.06±0.05 NO x 0.43b 0.11±0.02 NO2 −0.27a −0.10±0.03

[i] aSignificance level p<0.05.

[ii] bSignificance level p<0.001.

[iii] cSignificance level p<0.01.

Fig. 7. 

Ratios of sulphate concentrations in PM2.5 to the concentrations of sulphate plus SO2 (upper panel). PM2.5 and sulphate concentration data (lower panel) were adopted from Chow et al. (2010).
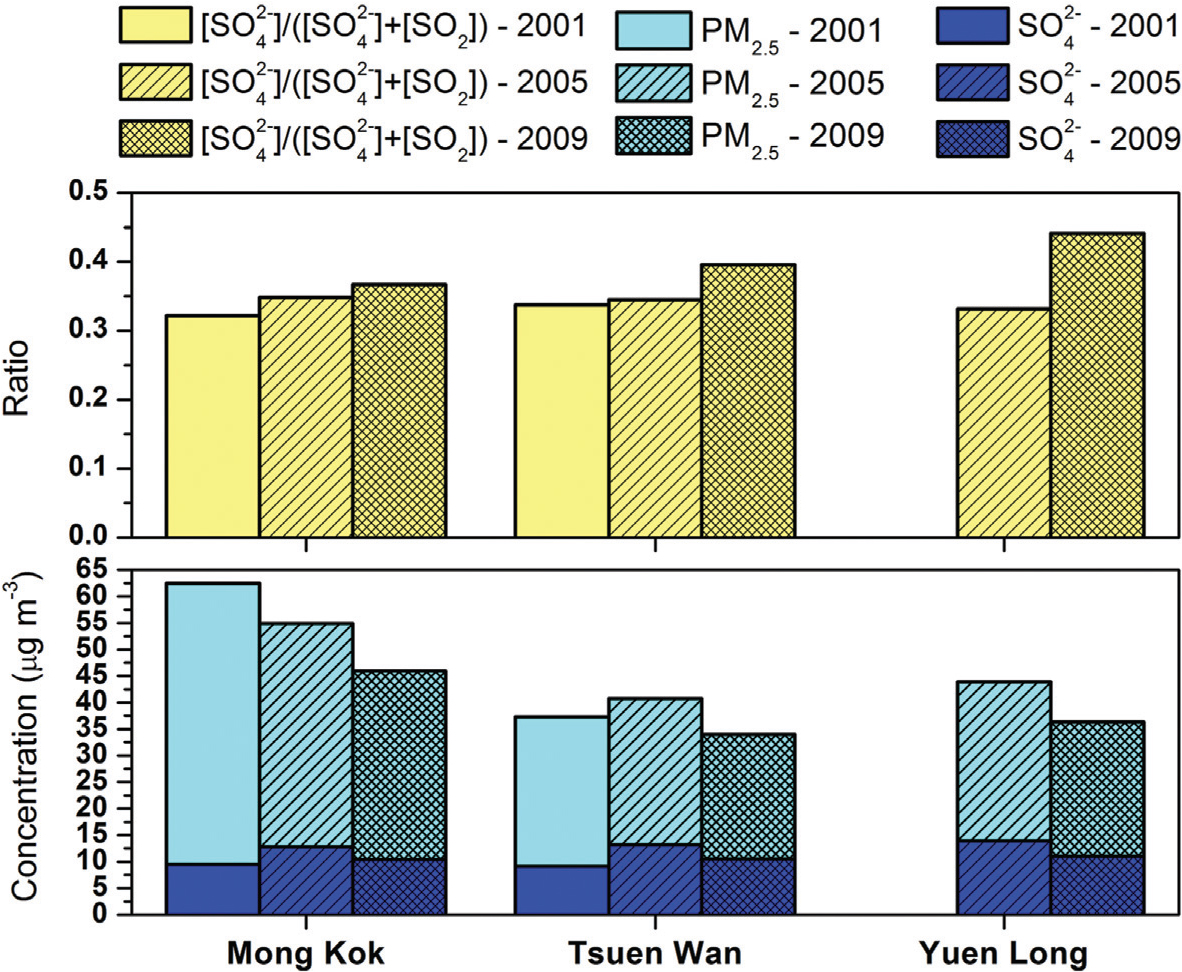
Fig. 8. 

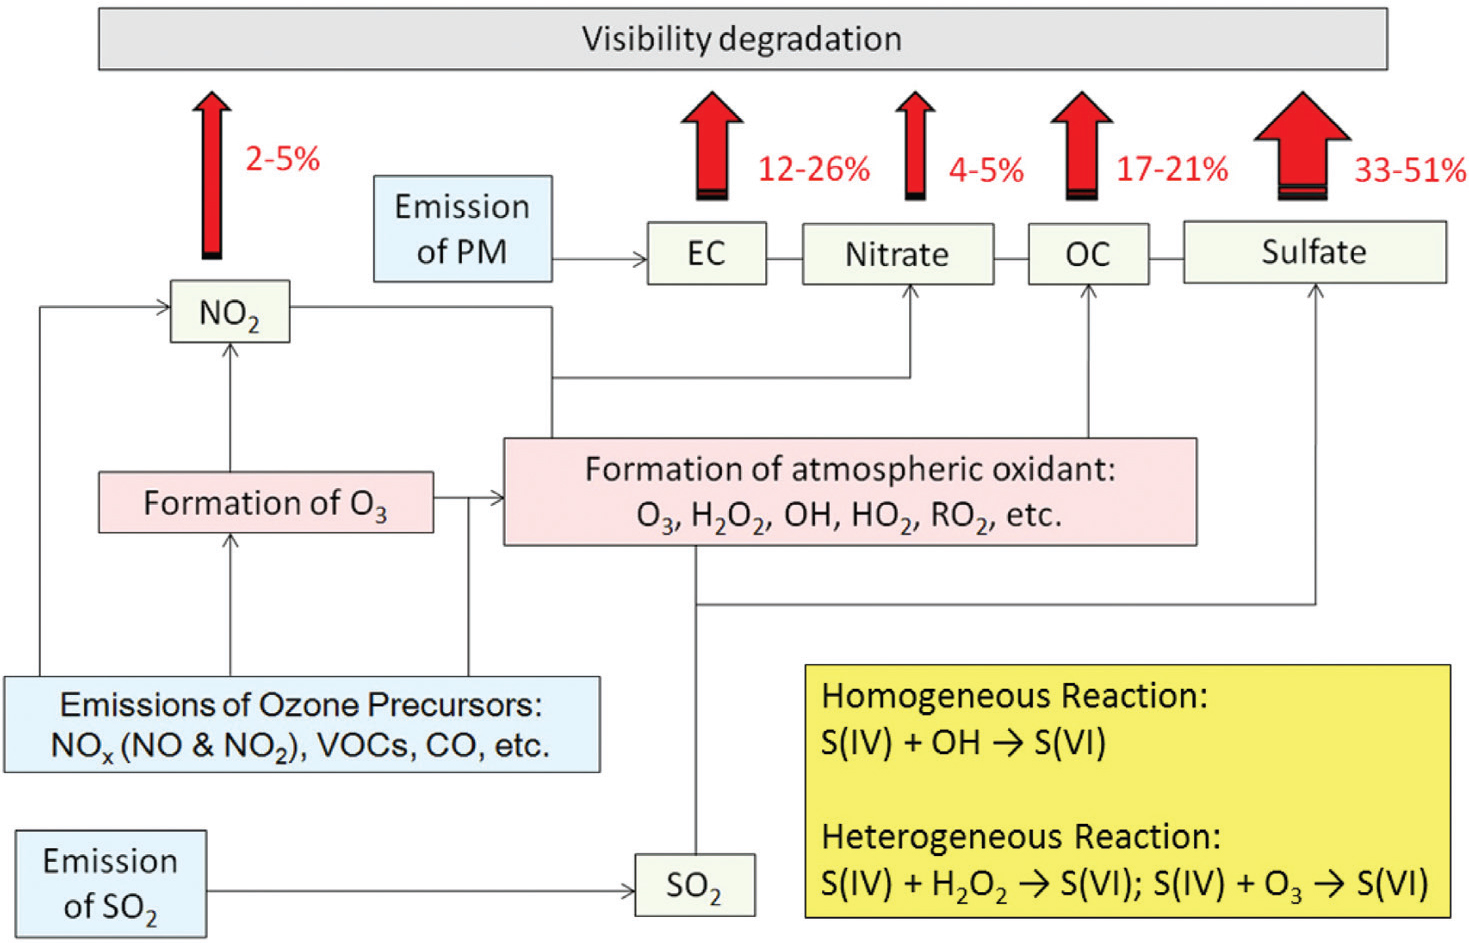
Chemical coupling among trace gases leading to impacts on visibility degradation in the Hong Kong region – see text for details. Percentage values indicate the light extinction contributions of various species given by Wang (2003).
Language: English
Page range: 19625 - 19625
Submitted on: Dec 31, 2011
Accepted on: Aug 9, 2012
Published on: Jan 1, 2012
Published by: Stockholm University Press
In partnership with: Paradigm Publishing Services

© 2012 Mang Lin, Iat-Neng Chan, Chuen-Yu Chan, Guenter Engling, William Bloss, published by Stockholm University Press
This work is licensed under the Creative Commons Attribution 4.0 License.