Fig. 1.
a) Map of the Baltic Sea showing the drainage basin and PROBE-Baltic sub-basins. b) Map of the Baltic Sea showing the transect path (dashed line), and the three validation stations (larger dots).
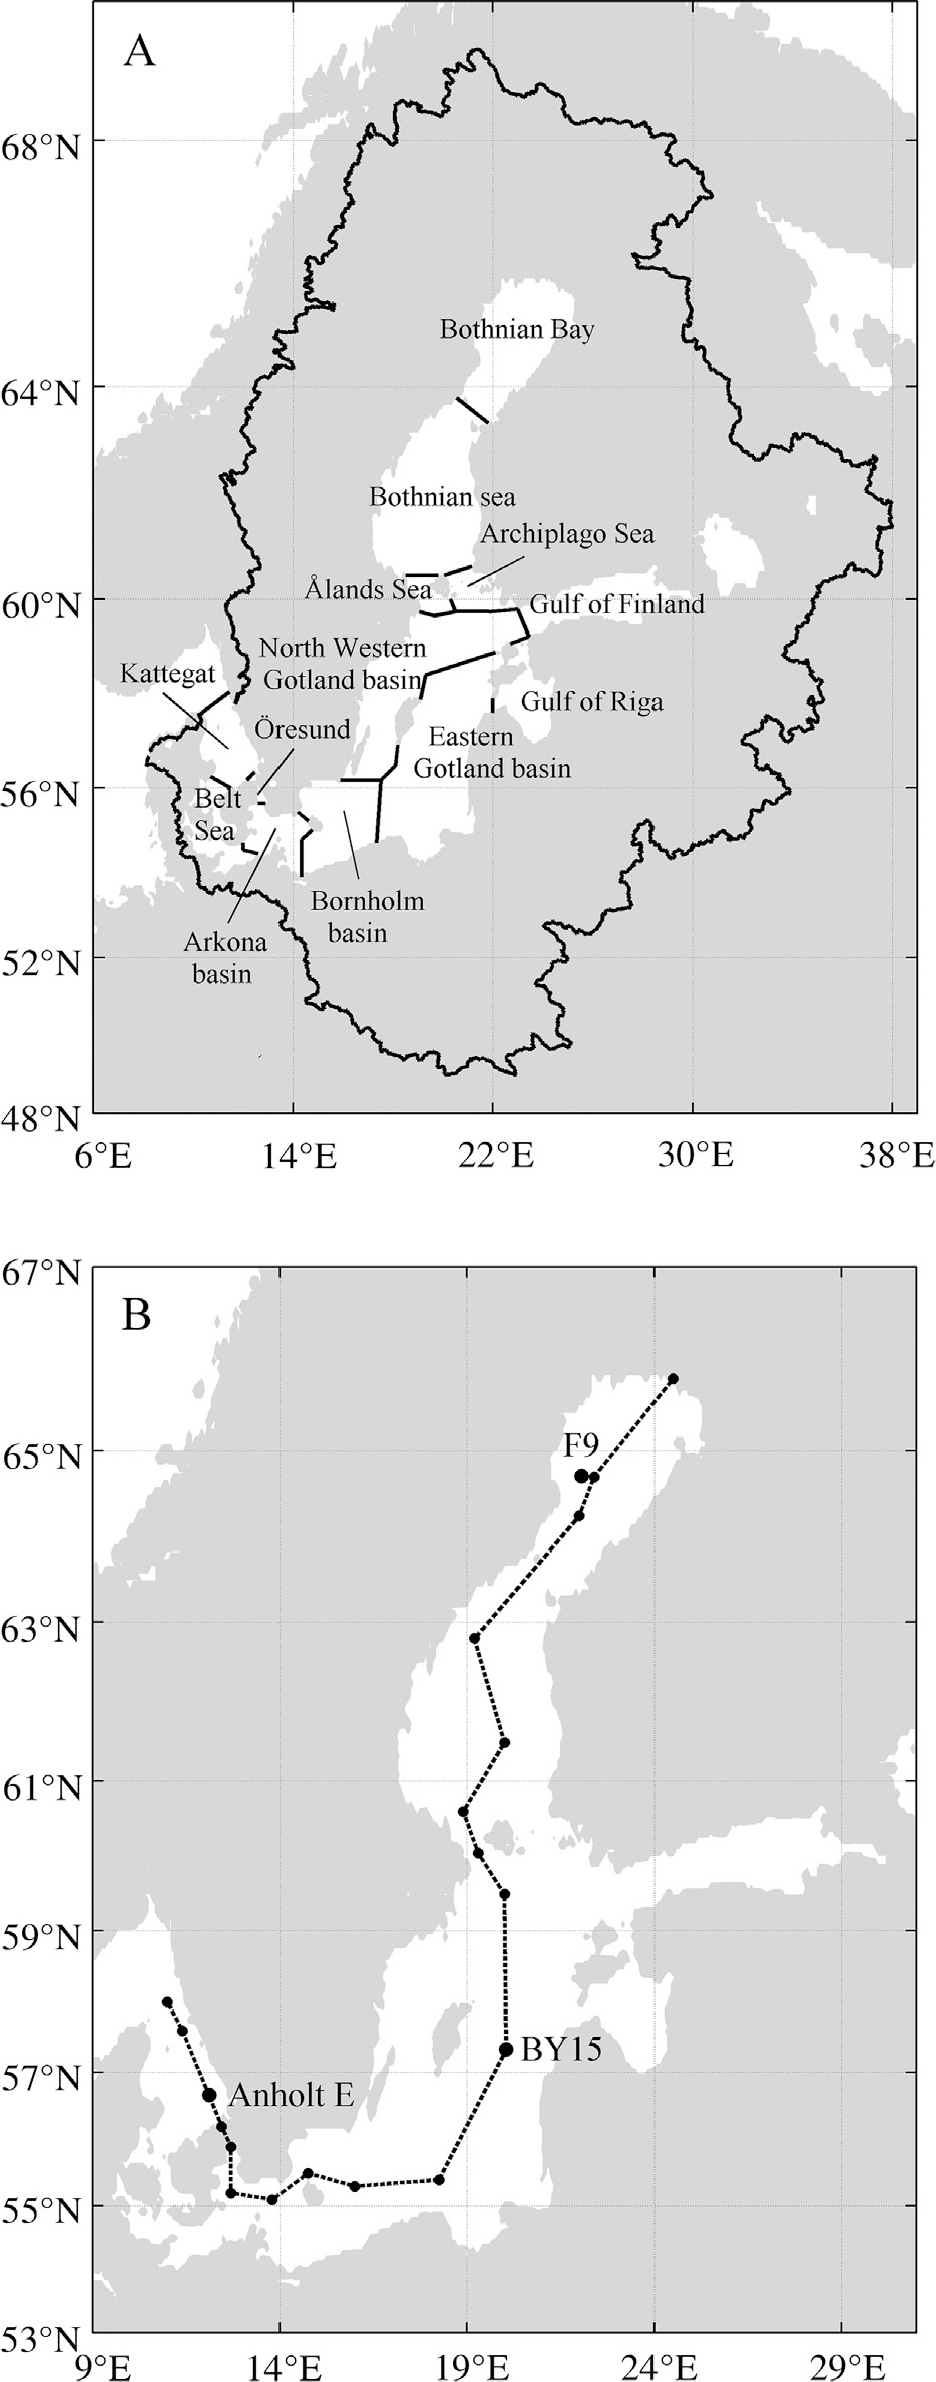
Fig. 2.
Sketch of the model system including a terrestrial carbon model (LPJ-Guess forced by land usage change, atmospheric CO2, temperatures and precipitation and exporting land cover fractions and Corg terr to CSIM), river runoff carbon model (CSIM forced by Corg terr, temperatures and precipitation and exporting runoff, total nitrogen, total phosphorous, Corg terr, CT terr and AT terr to PROBE-Baltic), and a Baltic Sea carbon model (PROBE-Baltic forced by Kattegat sea levels calculated from air pressure, wind, temperature, humidity, total cloudiness, precipitation, atmospheric CO2, runoff, total nitrogen, total phosphorous, Corg terr, CT terr and AT terr). The drainage basin and Baltic Sea models are forced by using global climate models downscaled by one regional climate model.
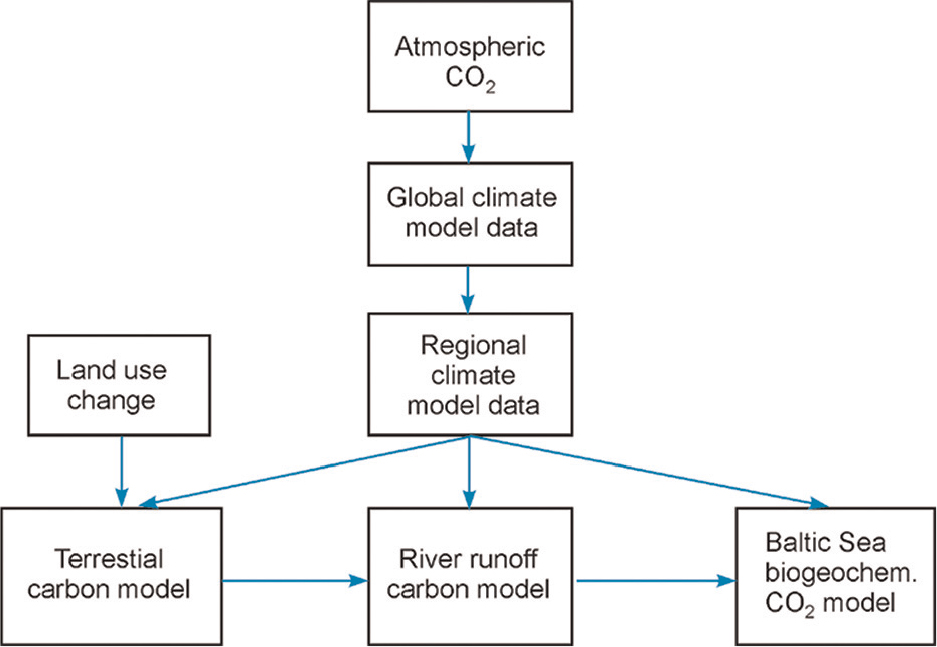
Table 1. Scenario simulations in the present study
[i] *With bias corrections for air temperature and precipitation.
Fig. 3.
Modelled trends in runoff (Qr) as well as (a, b) changes in fluxes and (c, d) concentrations of AT terr, CT terr and Corg terr over 100 yr according to the BSAP-B1 (a, c) and BAU-A2 (b, d) scenarios. Percent change compared to present day (1996–2005); only significant changes (p<0.05, Mann–Kendall test) are shown. The Baltic Sea sub-basins are denoted: Bothnian Bay (BB), Bothnian Sea (BS), Baltic Proper (BP), Gulf of Finland (GF), Gulf of Riga (GR), Danish Straits (DS), and Kattegat (KA).
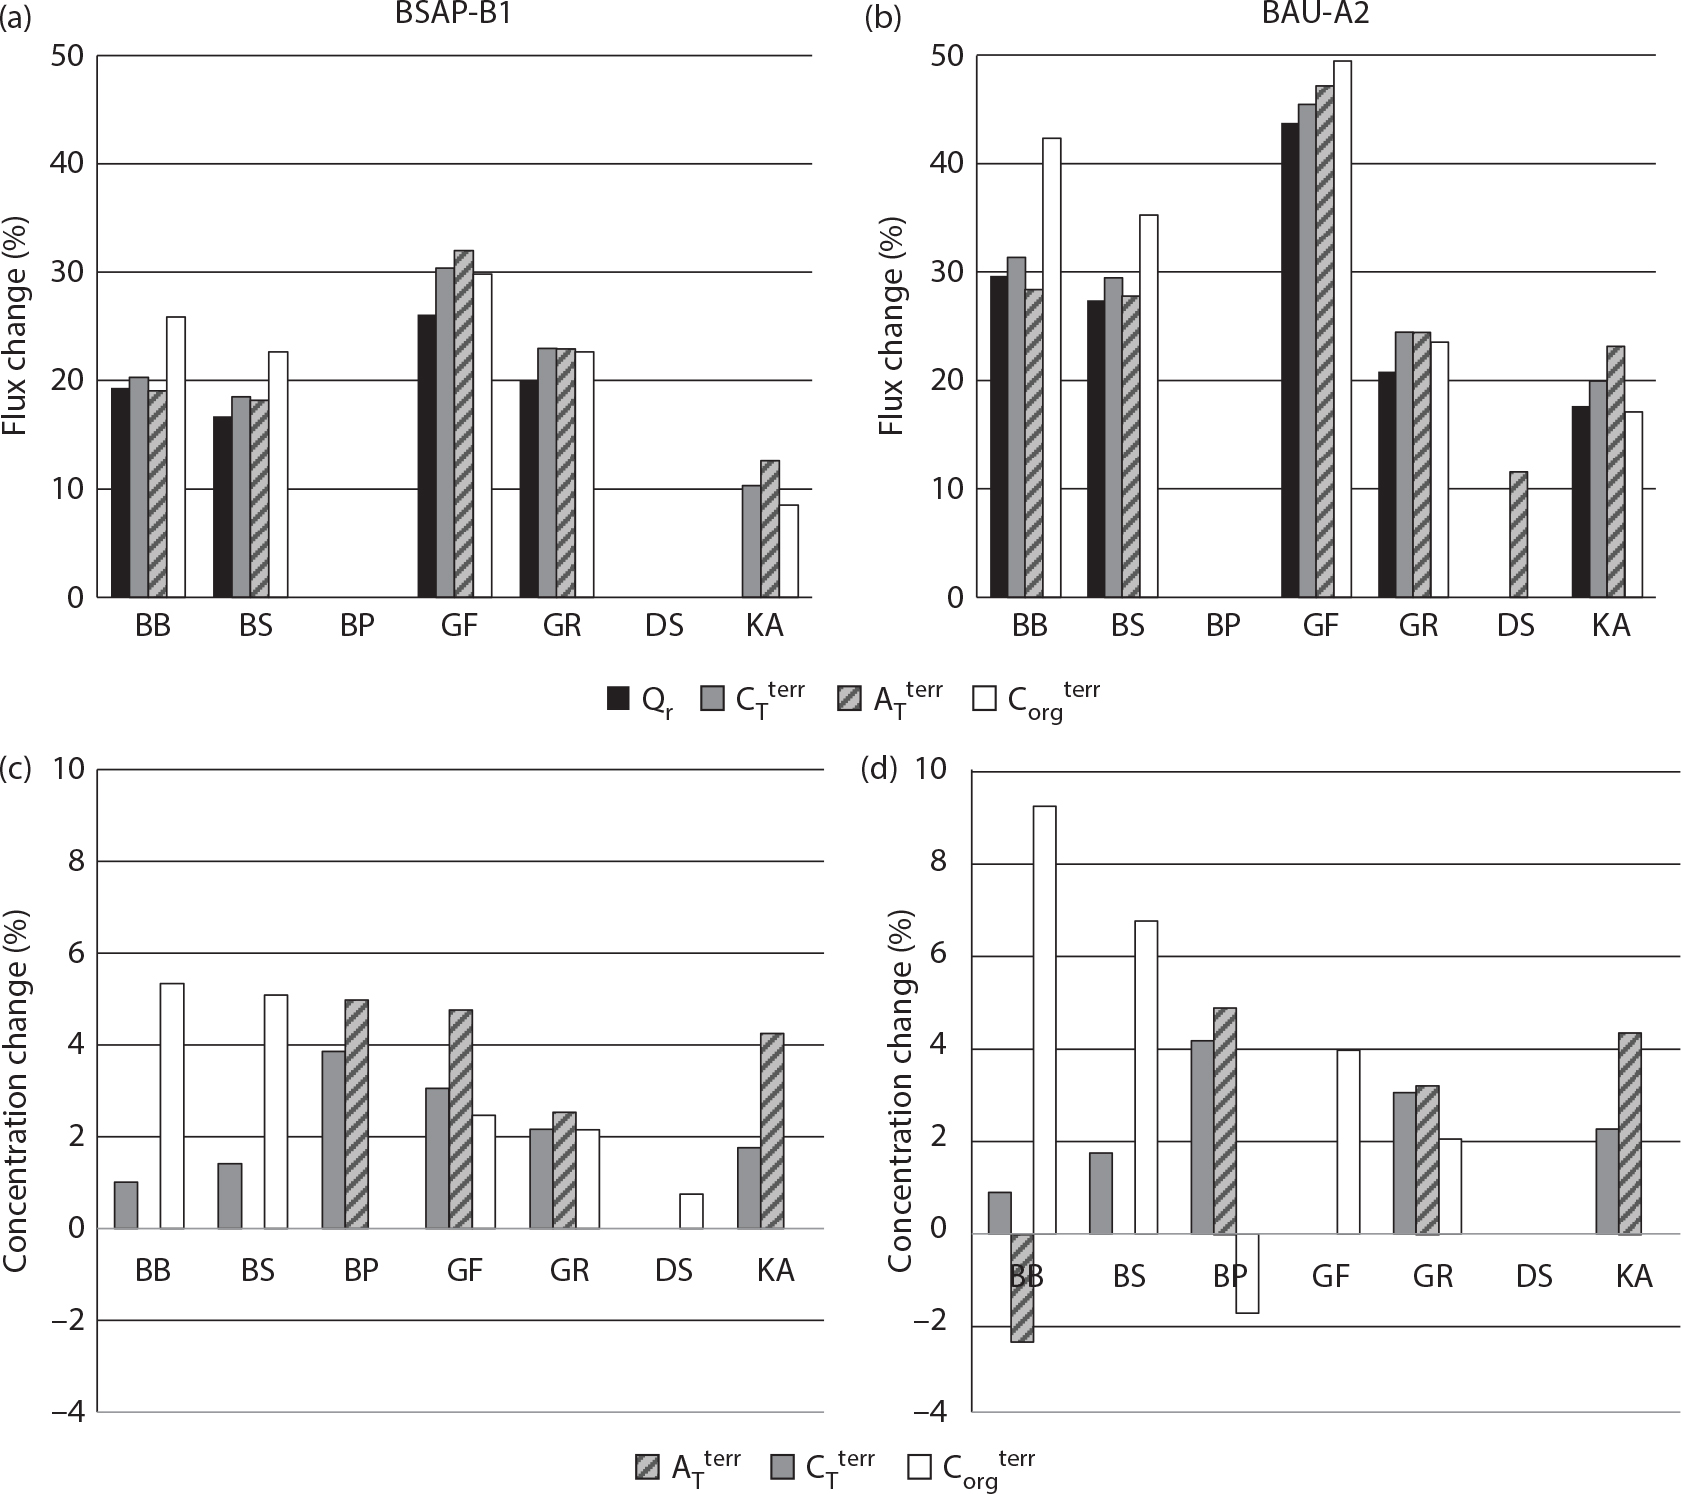
Fig. 4.
Statistical evaluation of the reference case (1995–2009) where gridded reanalysed weather data are used as forcing. The Kattegat, Eastern Gotland Basin and Bothnian Bay are represented by observations from Anholt East, BY15 and F9, respectively. The evaluated parameters are temperature (T), salinity (S), oxygen (O2), phosphate (PO4), nitrate (NO3), total alkalinity (AT) and pH, as indicated in the figure legends. The coloured circles indicate a mean based on all parameters. Calculated parameters inside the inner and outer circles are classified as good and acceptable, respectively; parameters outside the outer circle are classified as poor.
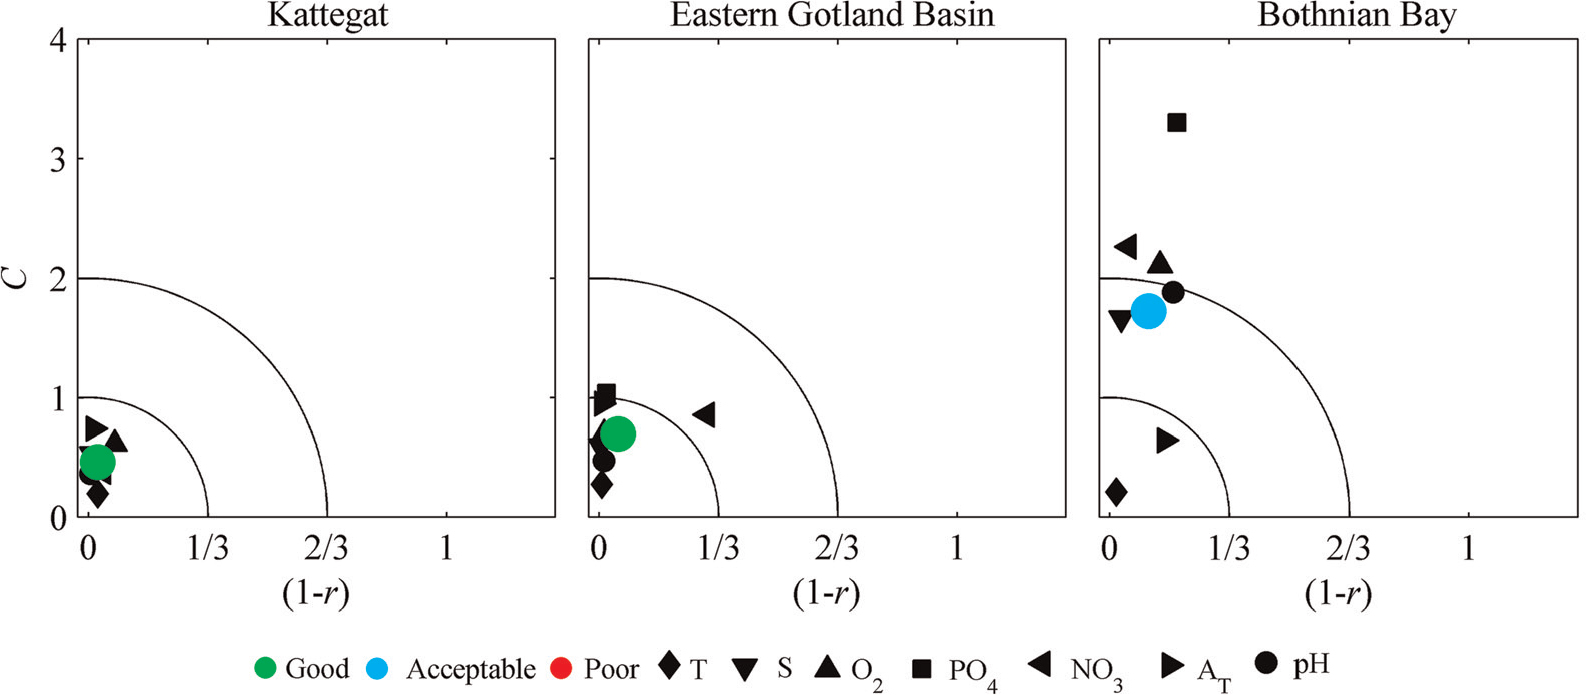
Fig. 5.
Statistical evaluation of the climate control case (1971–2000) where different climate model runs are used as forcing data and compared with the reference case. The figure illustrates the statistical mean based on seven different parameters (see Fig. 4). The various climate runs are indicated by their run numbers in the figure (see Table 1). Calculated parameters inside the inner and outer circles are classified as good and acceptable, respectively; parameters outside the outer circle are classified as poor.
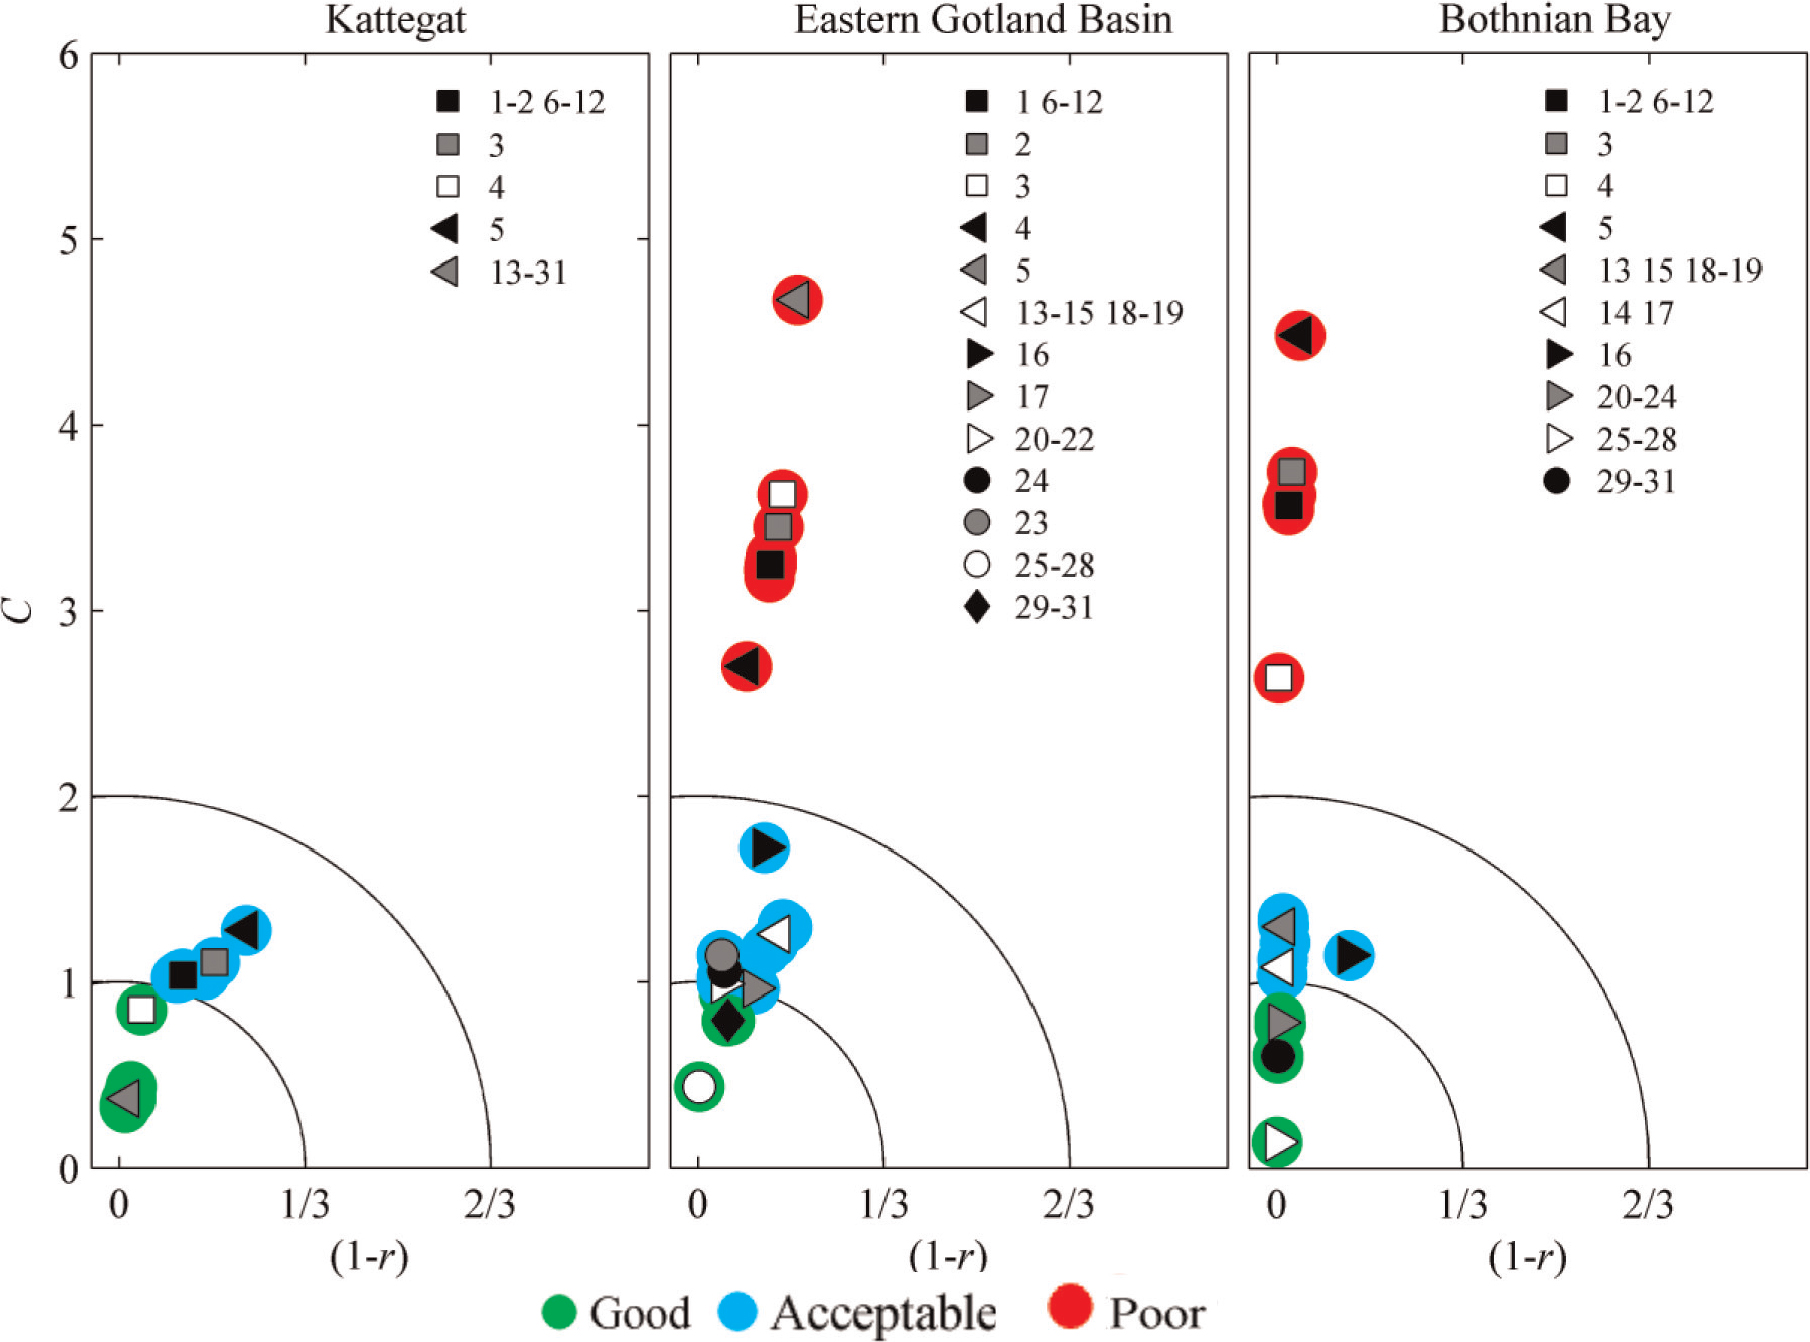
Fig. 6.
The Baltic Sea model sensitivity in pH with regard to climate model set-up, comparing 30-yr means from 1971–2000 and 2069–2098. The total pH change is shown in relation to present pH (means for 1971–2000). S and W indicate summer and winter surface means (upper 5 m), respectively, and D indicates depth water mean (from halocline to bottom).
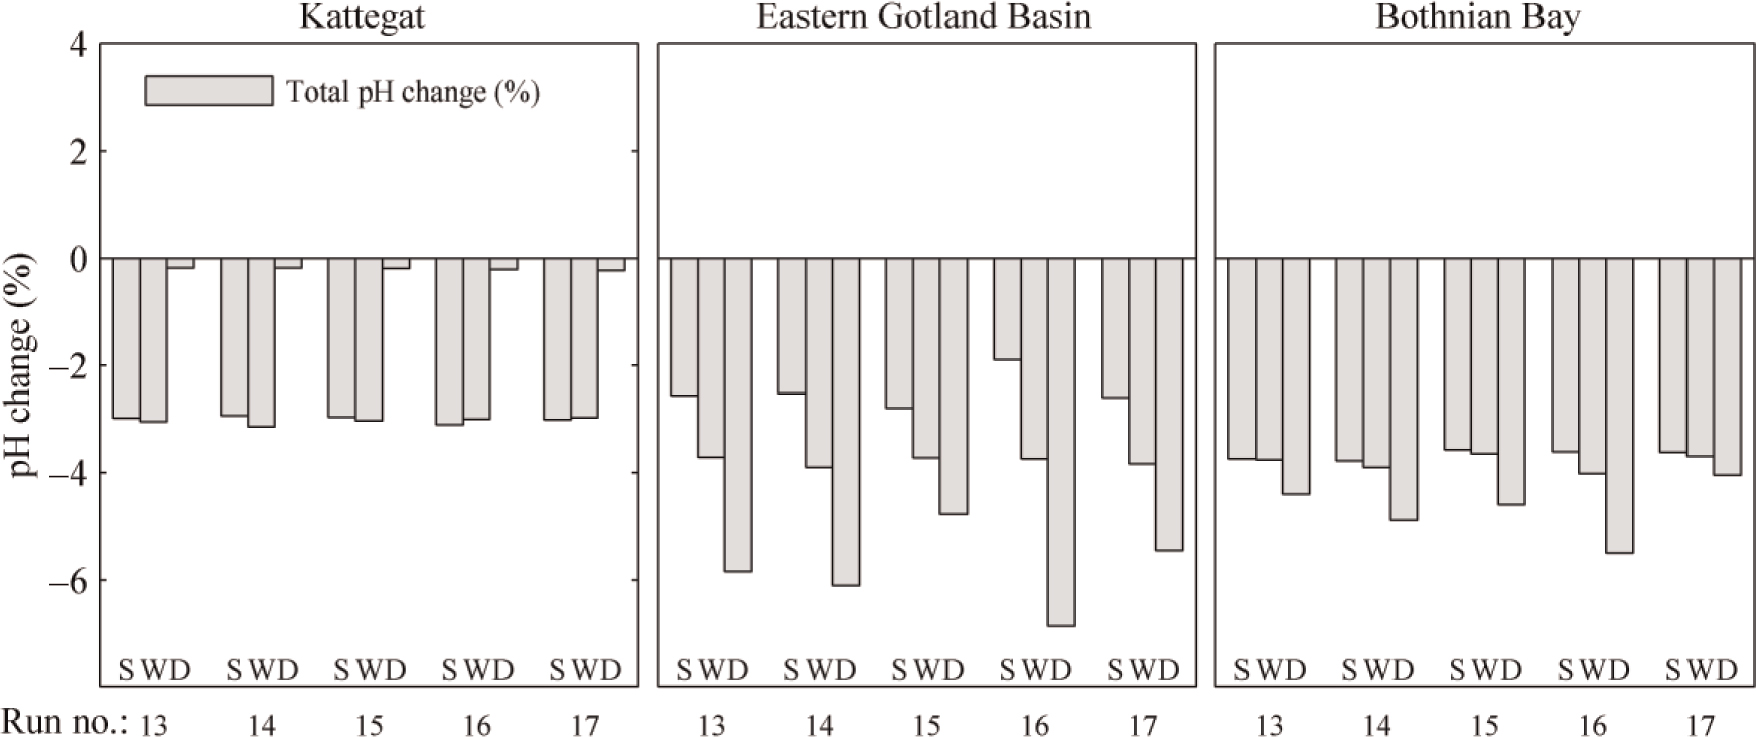
Fig. 7.
The Baltic Sea model's pH response to different forcing components, comparing 30-yr means from 1971–2000 and 2069–2098. The added pH change is the deviation from the total pH change that is caused by the added forcing. S and W indicate summer and winter surface means (upper 5 m), respectively, and D indicates depth water mean (from halocline to bottom).
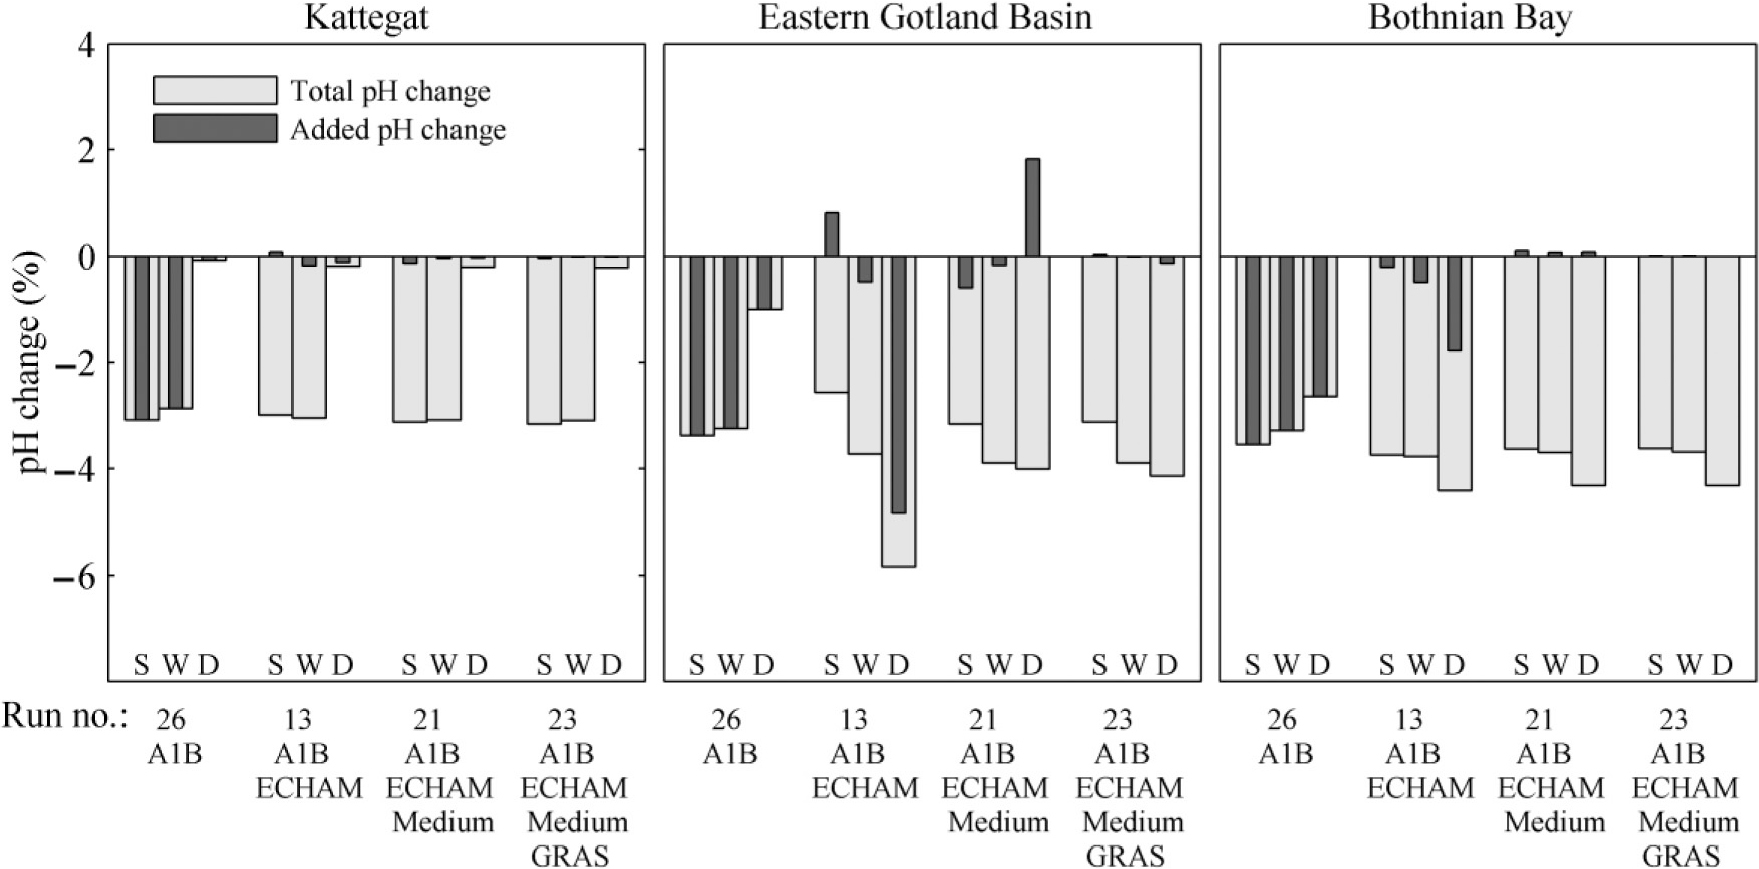
Fig. 8.
Daily pH calculations for the Eastern Gotland Basin surface water according to the BAU-A2 and BSAP-B1 projections.
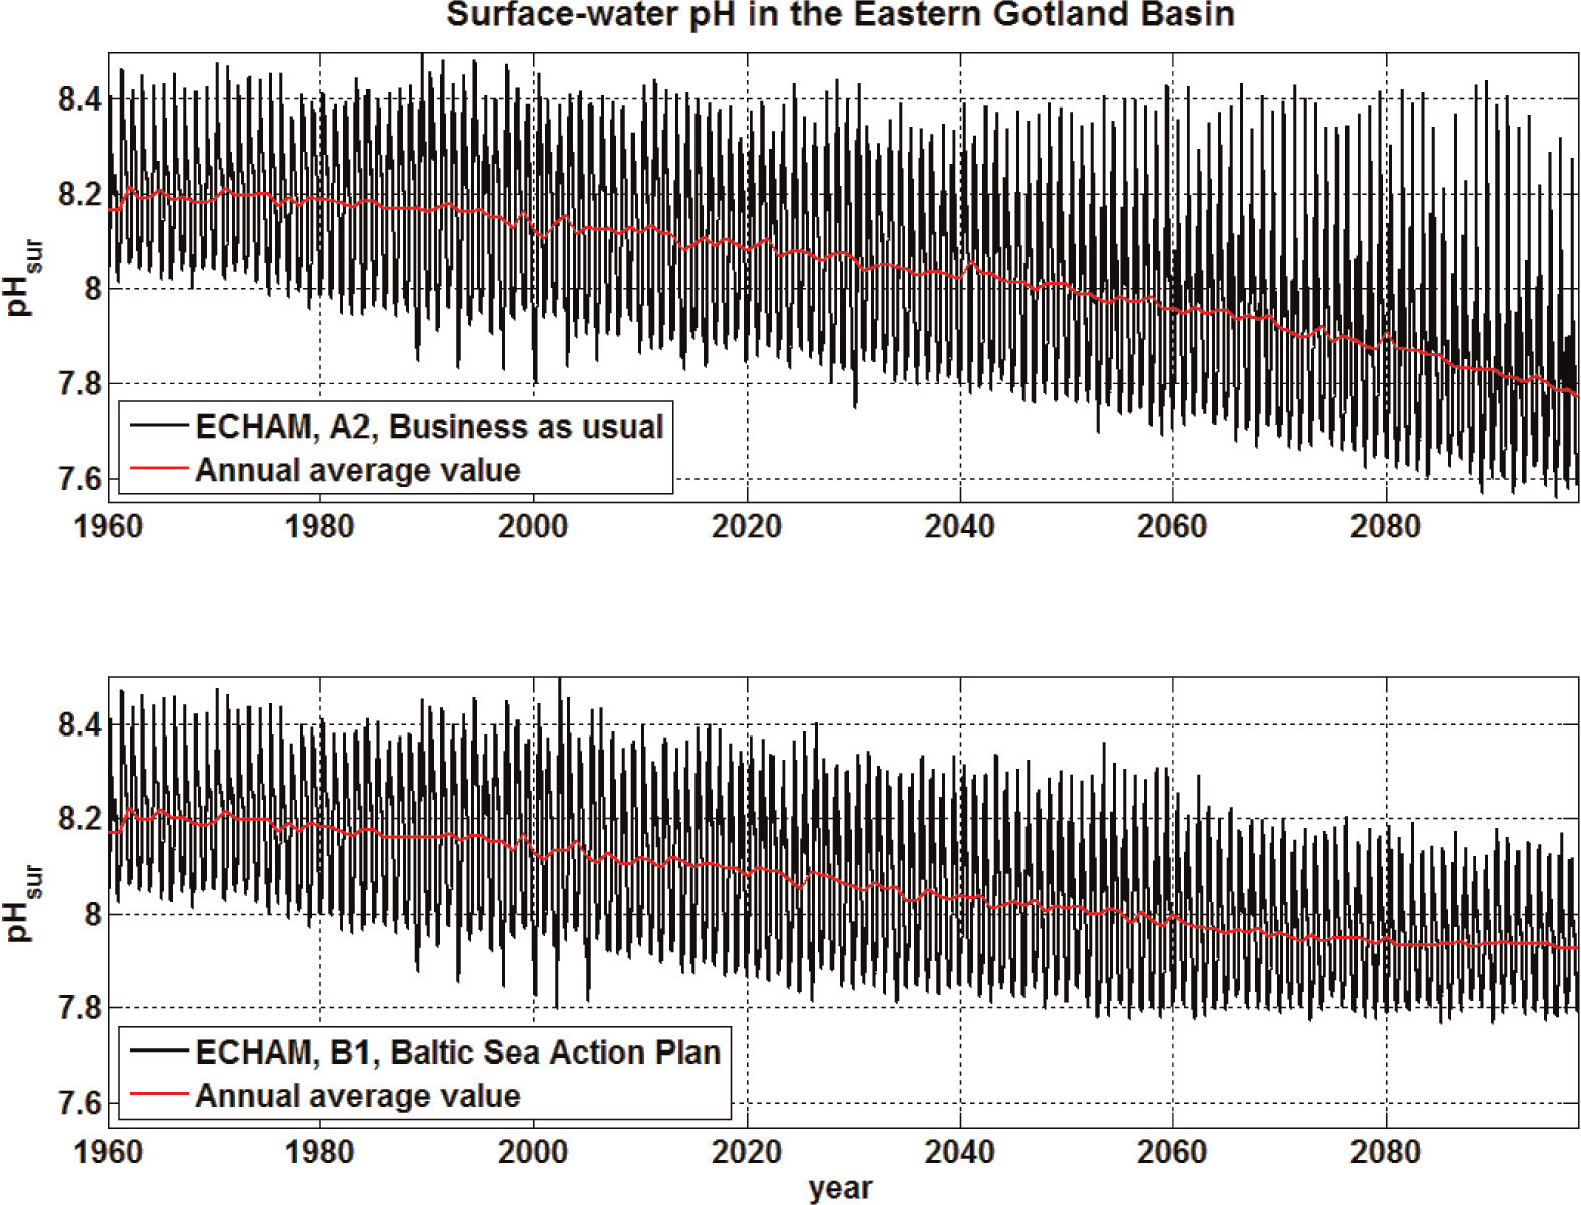
Fig. 9.
Annual pH calculations for the Eastern Gotland Basin and hypoxia in the Baltic Proper according to the BAU-A2 and BSAP-B1 projections.
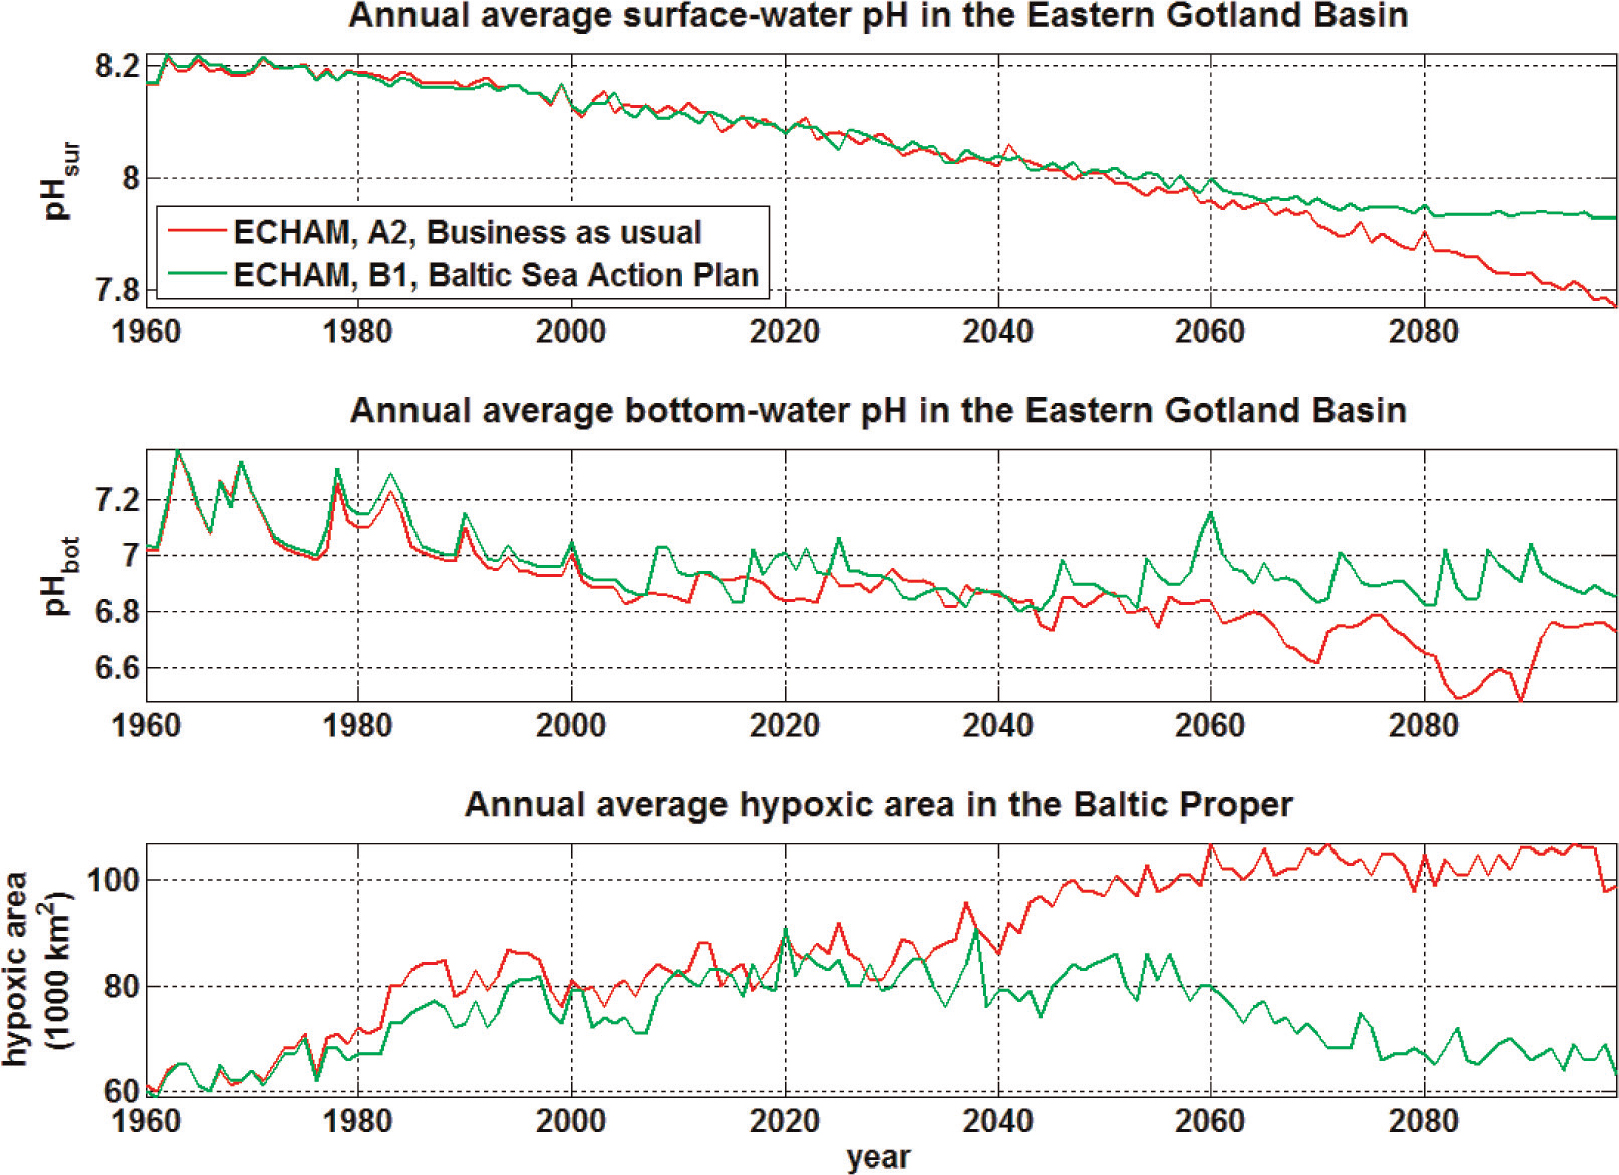
Fig. 10.
Current pH (1971–2000) and scenario pH changes (2069–2098) along a Baltic Sea transect (see Fig. 1) for the BSAP-B1 and BAU-A2 scenarios.
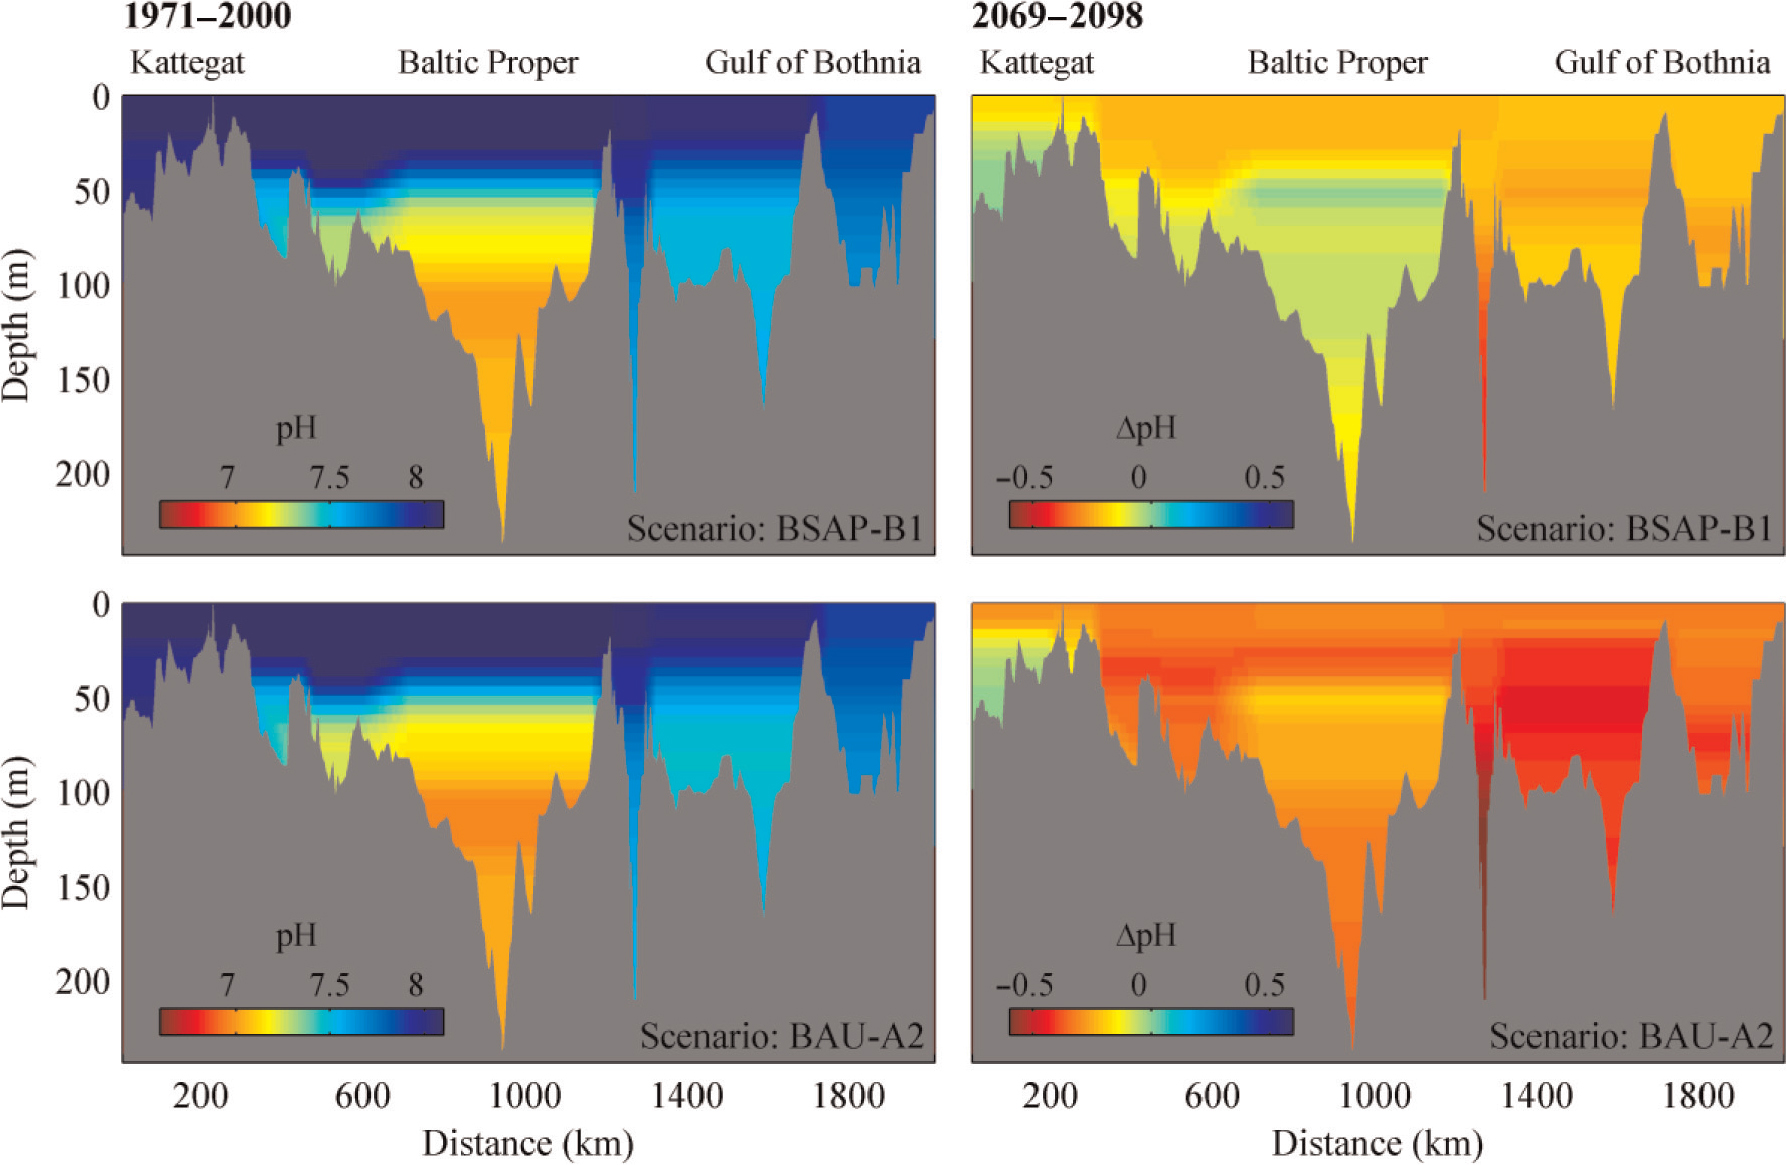
Fig. 11.
Current O2 concentration (µmol kg−1) (1971–2000) and scenario O2 changes (2069–2098) along a Baltic Sea transect (see Fig. 1) for the BSAP-B1 and BAU-A2 scenarios. The limit for hypoxic water (set as 90 µmol kg−1) is indicated by the black line.
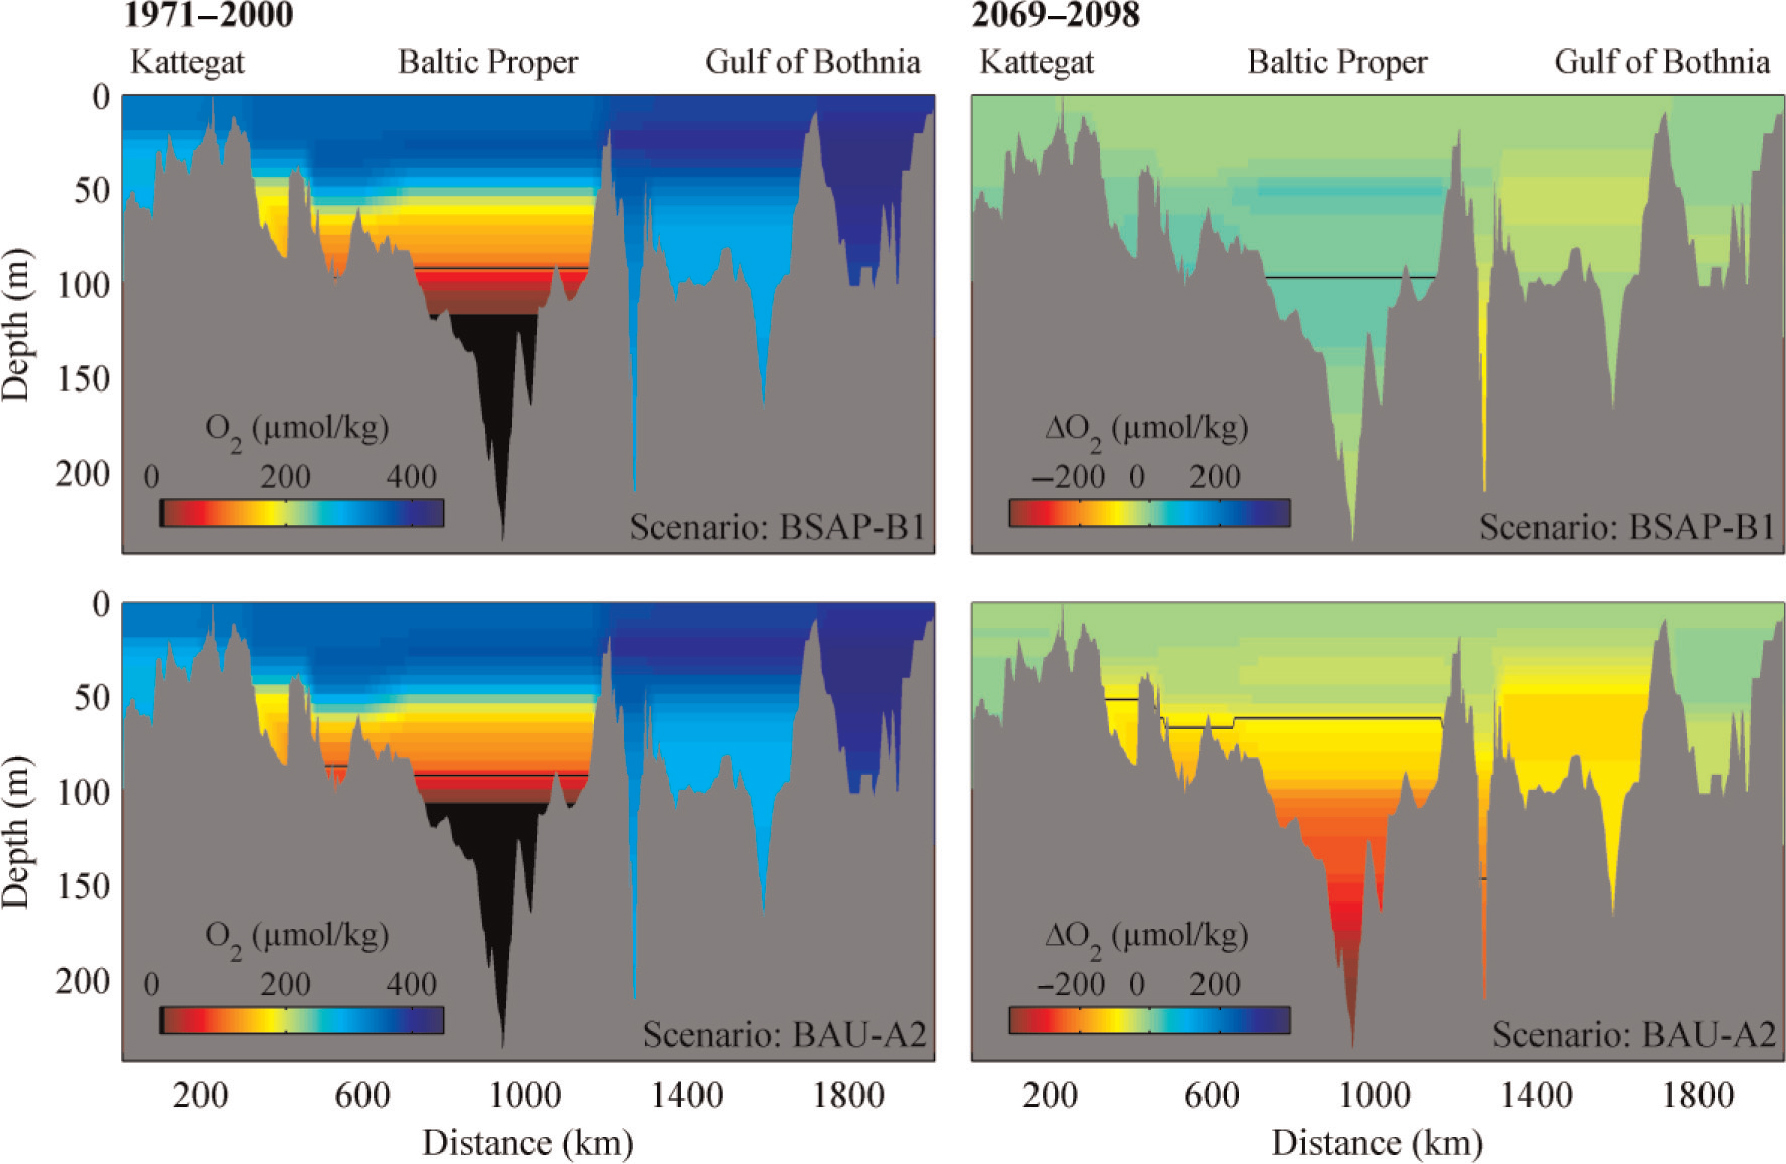
Fig. 12.
Mean changes comparing 30-yr means for 1971–2000 and 2069–2098 in environmental indices ( pH, Ω, RI, hypoxic (H) and anoxic (A) areas) for the BAU-A2, medium-A1B, and BSAP-B1 narratives. The numbers within parentheses indicate present-day values and SD indicates the standard deviation calculated from the three scenarios. S and W indicate summer and winter surface means (upper 5 m), respectively, and D indicates depth water mean (from halocline to bottom).
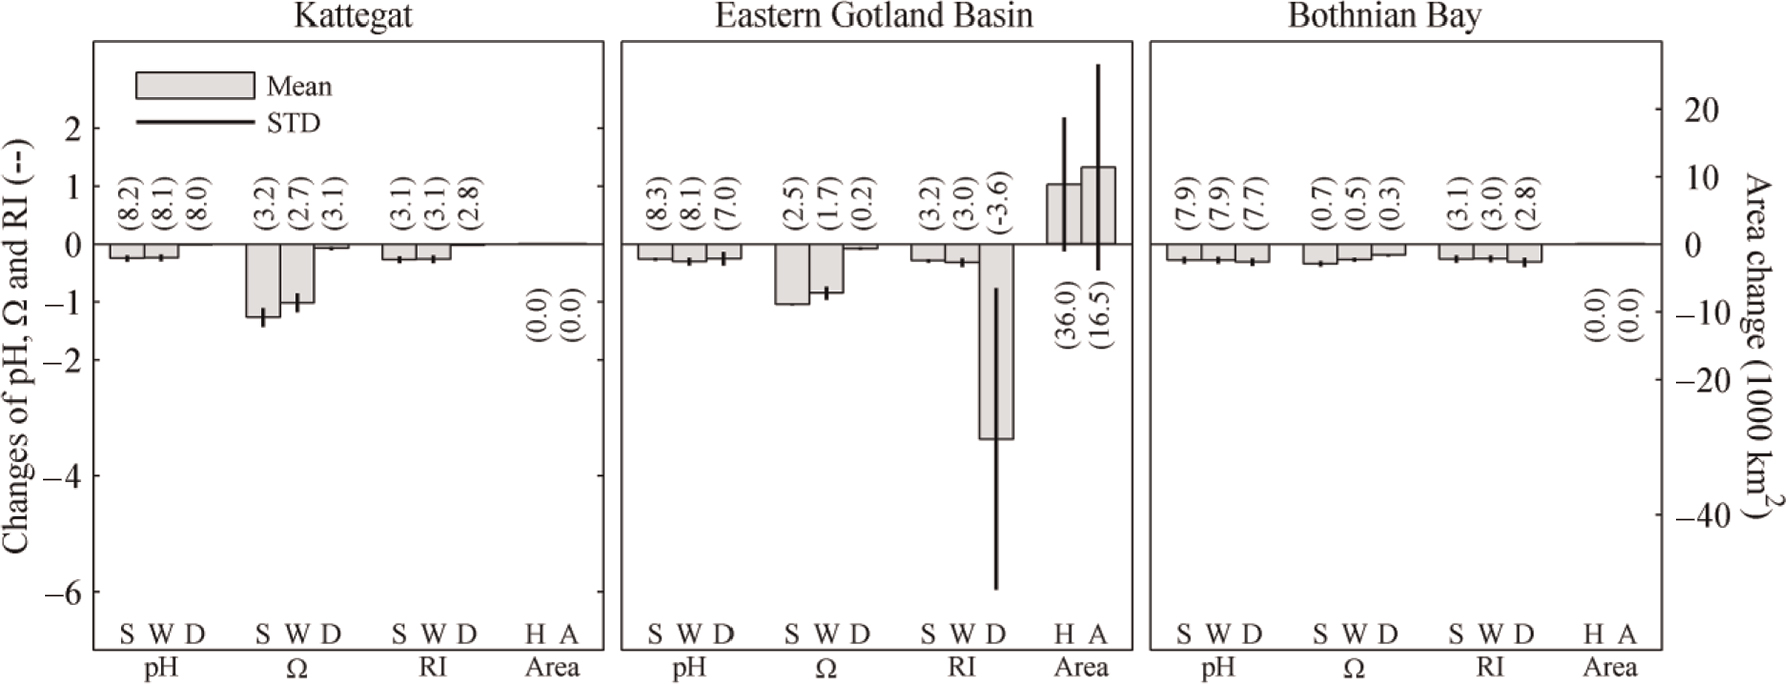
Fig. B1.
Trends in bias-corrected temperature (25-yr running mean) for various Baltic Sea sub-basins and scenarios.
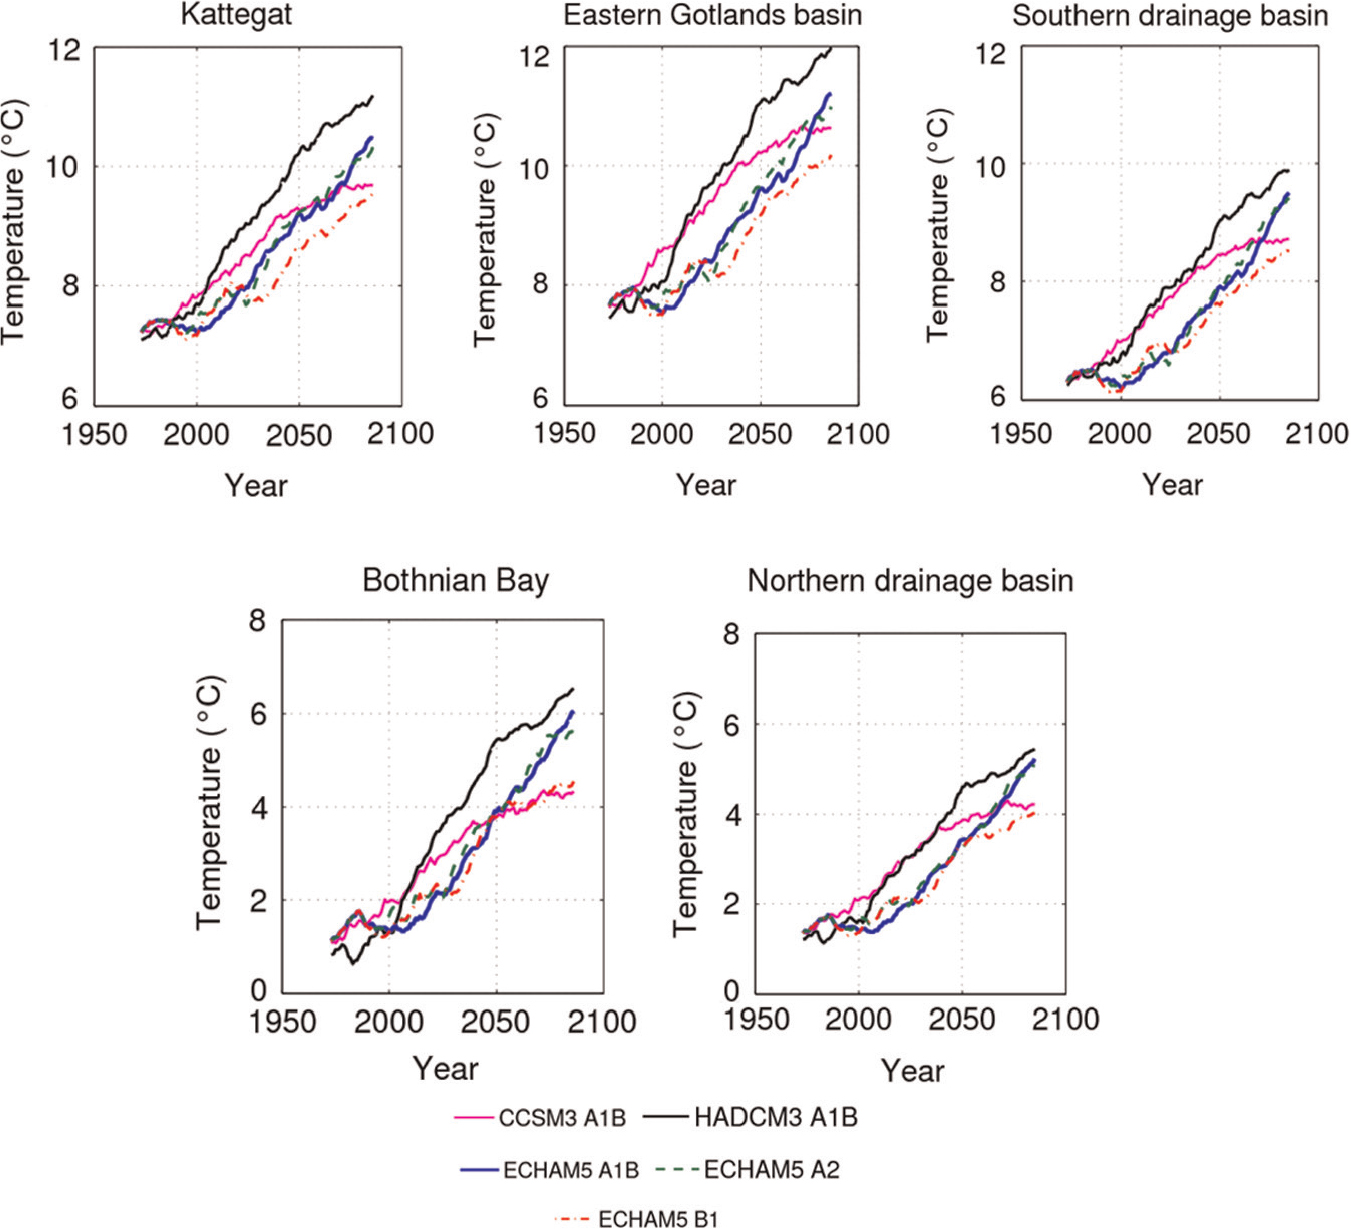
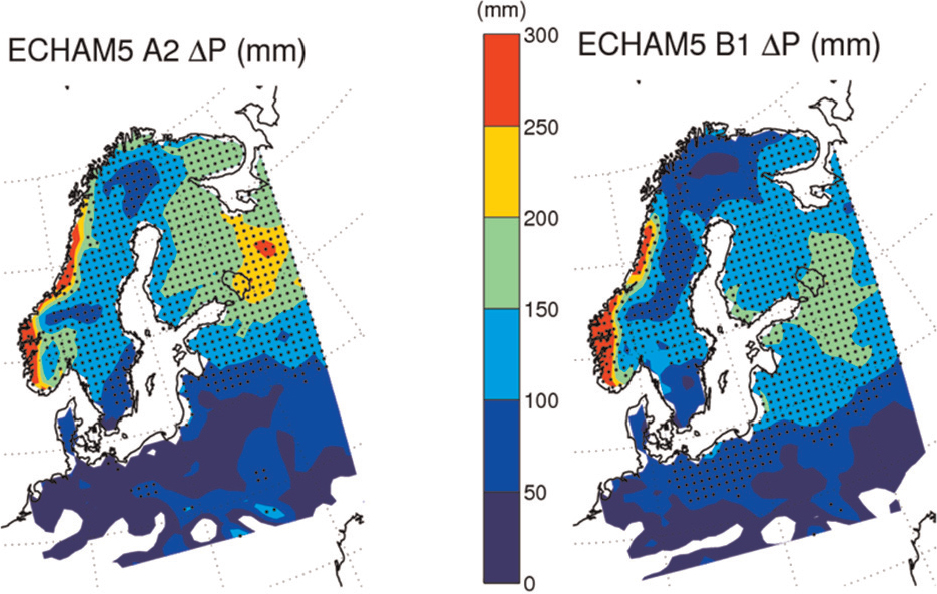
Fig. B2.
Simulated difference in mean annual precipitation (2086–2095 minus 1996–2005): (a) scenario A2; (b) scenario B1. Dots indicate areas with positive trends at a significance level above 98%.