
Fig. 1.
Location of the Québec (Qc), Montréal (Mtl) and Georgian Bay (GB) study sites. Arrows indicate the main directions of cyclones over North America (Irving, 1990).
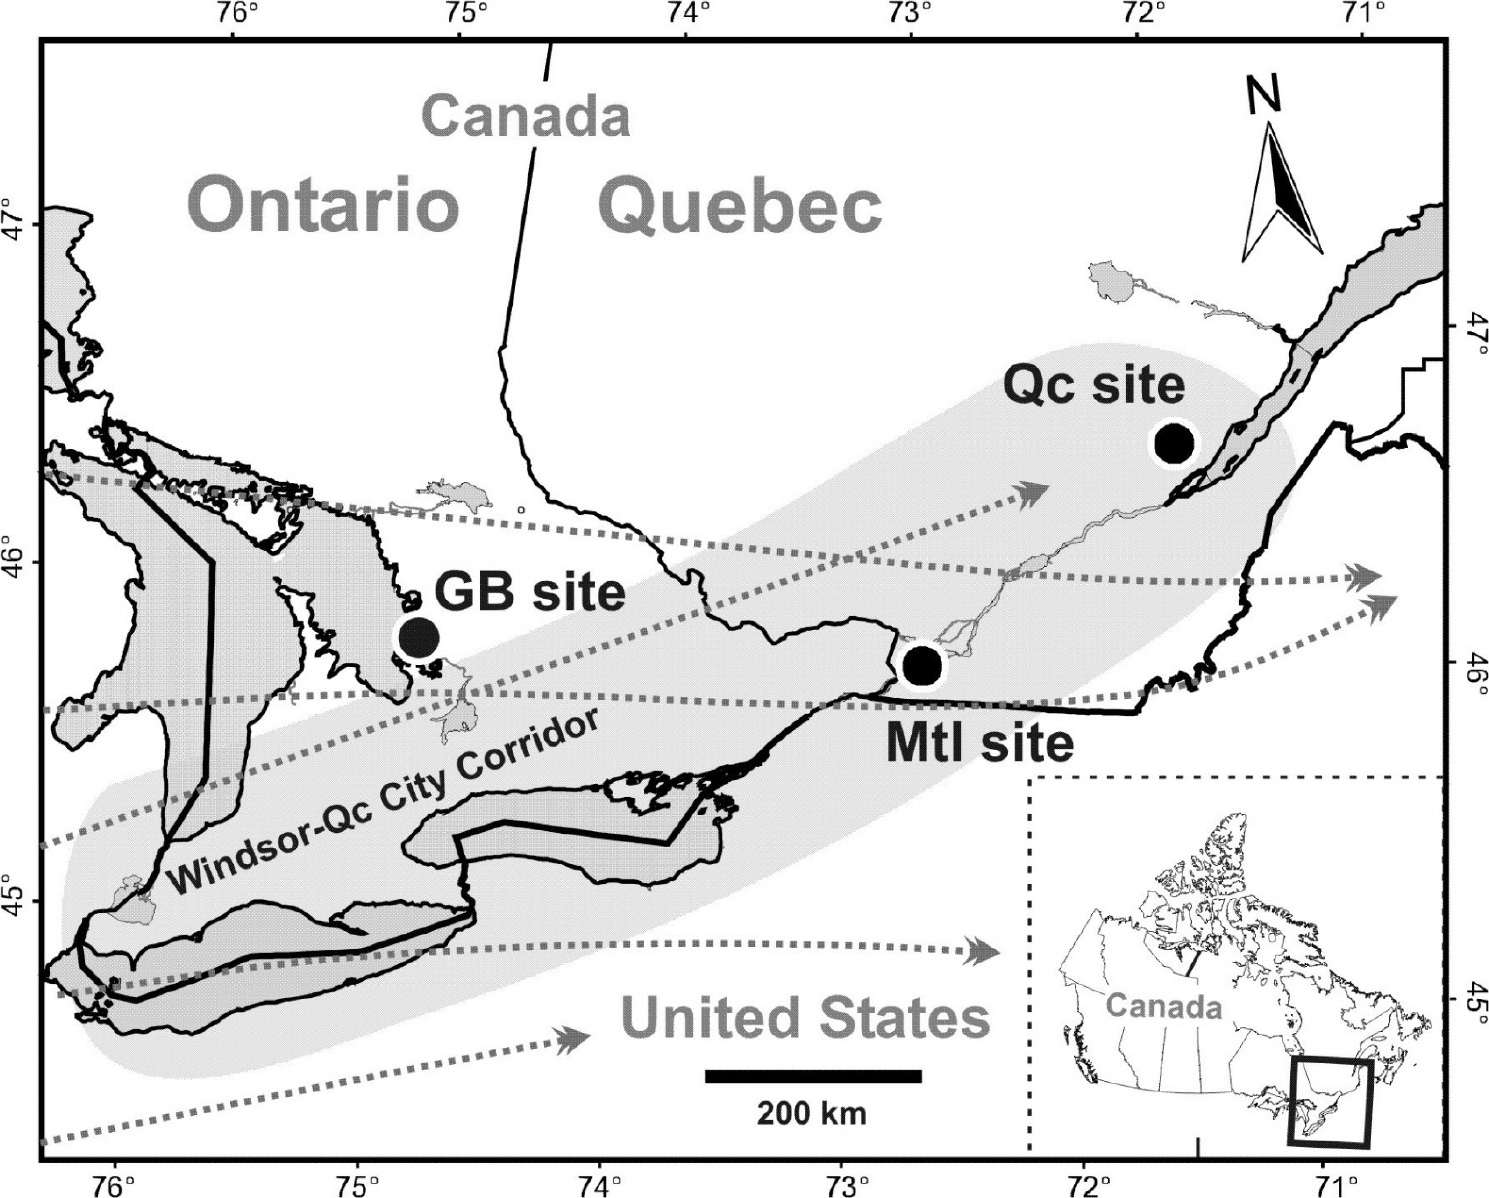
Table 1. Study site description
Table 2. Information summary for trees sampled for geochemical analyses
Fig. 2.
Montréal (Mtl) and Georgian Bay (GB) patterns of Cd and Zn concentrations in beech trees influenced by physiological mechanisms (A); Cd and Zn series in the Québec (Qc) red spruce trees and the Mtl pine trees not influenced by internal mechanisms (B); and Cd (C) and Zn (D) concentrations in soil profiles of the study sites. The tree-ring concentration series are smoothed with a moving average of four ring pairs, and the rectangles indicate the heartwood–sapwood boundary.
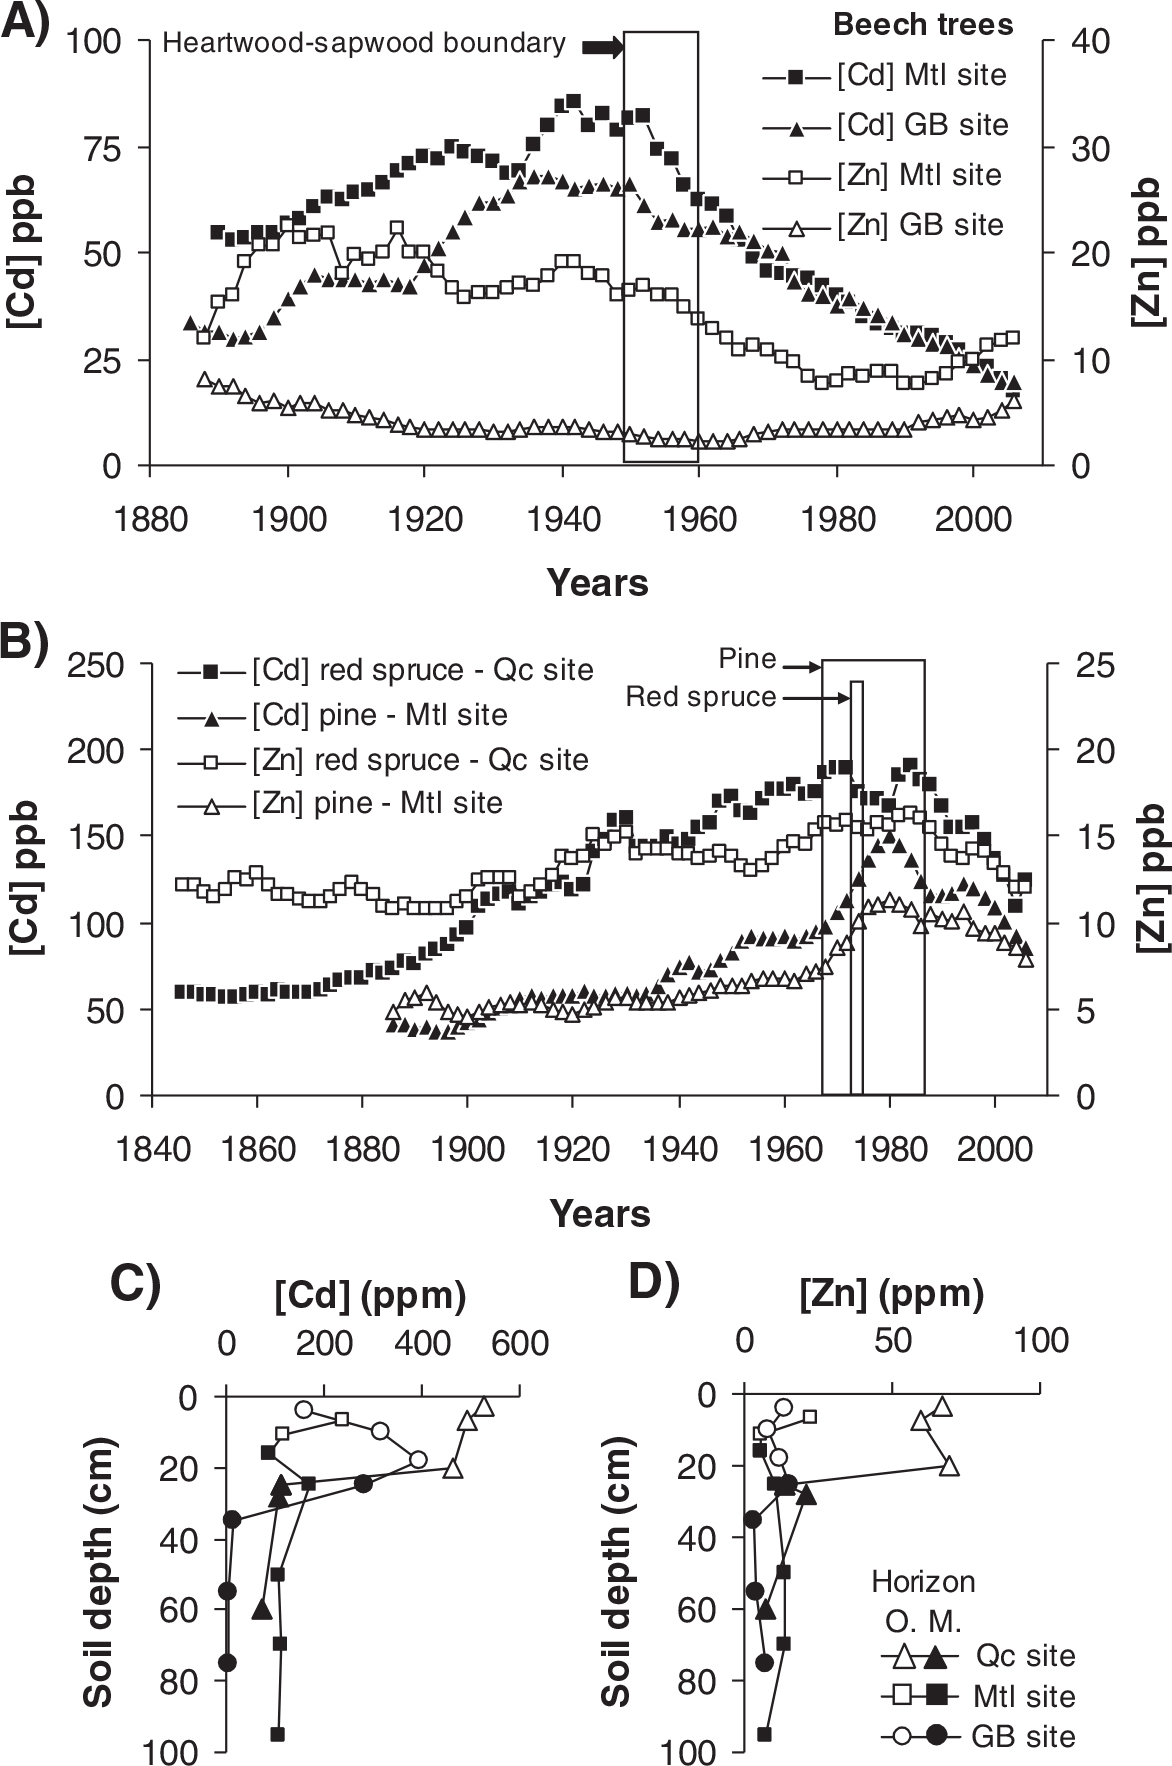
Fig. 3.
Pb concentrations in the Montréal (Mtl) and Georgian Bay (GB) beech trees (A) and in the soil profile of the study sites (B); the rectangle indicates the heartwood–sapwood boundary. The 206Pb/207Pb ratios in the Mtl (open squares) and GB (solid circles) beech trees (C) are compared with the 206Pb/207Pb ratios of their respective mineral (M.H.) and organic (O.H.) horizons (D), the Canadian (CND) and United States (USA) urban air (Bollhöfer and Rosman, 2001), the American coal combustion (COAL) (Chow and Earl, 1972) and the leaded gasoline in Canada (CND Pb GAS) and in United States (USA Pb GAS) (Sturges and Barrie, 1987).
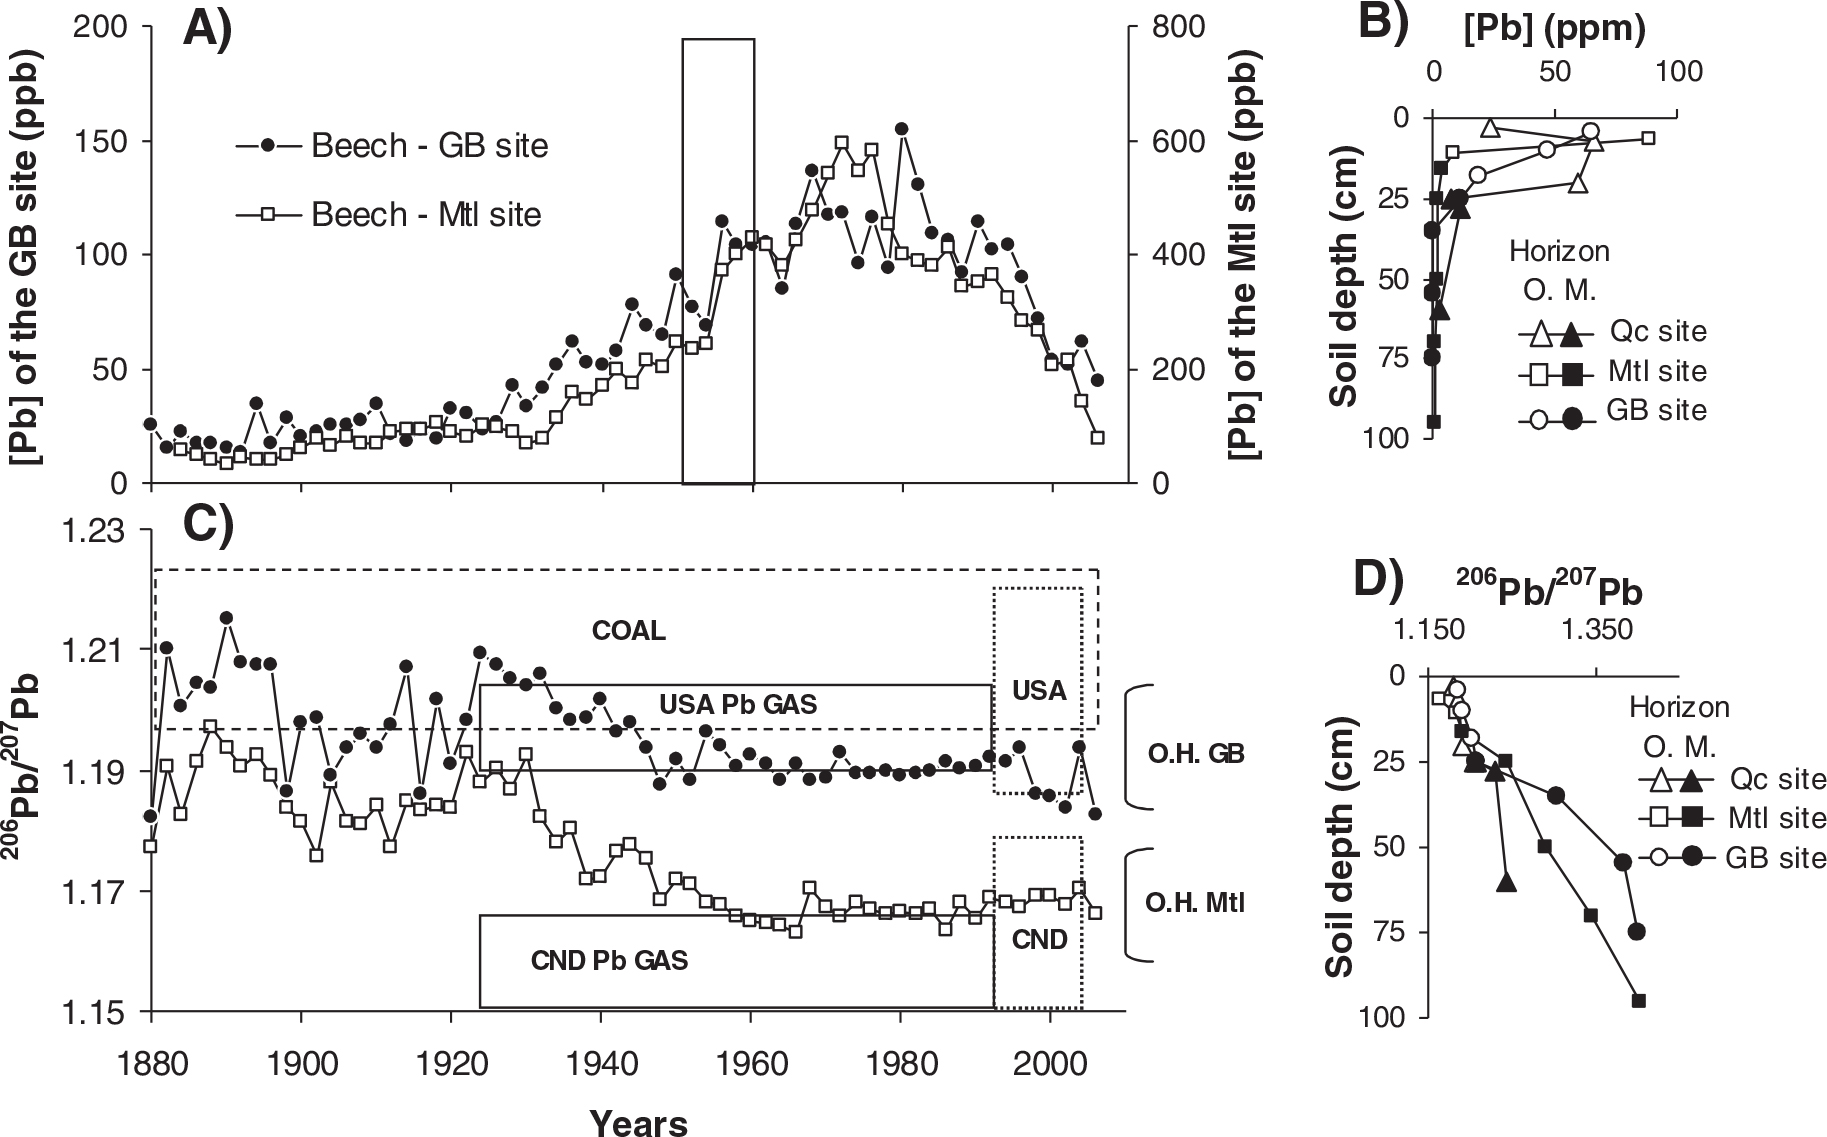
Fig. 4.
Pb concentrations and 206Pb/207Pb ratios in the pine trees of the Montréal site (A) and in the red spruce trees of the Québec site (B). Graphs show short- and long-term positive correlations between the two indicators in each stand. The rectangles indicate the heartwood–sapwood boundaries.
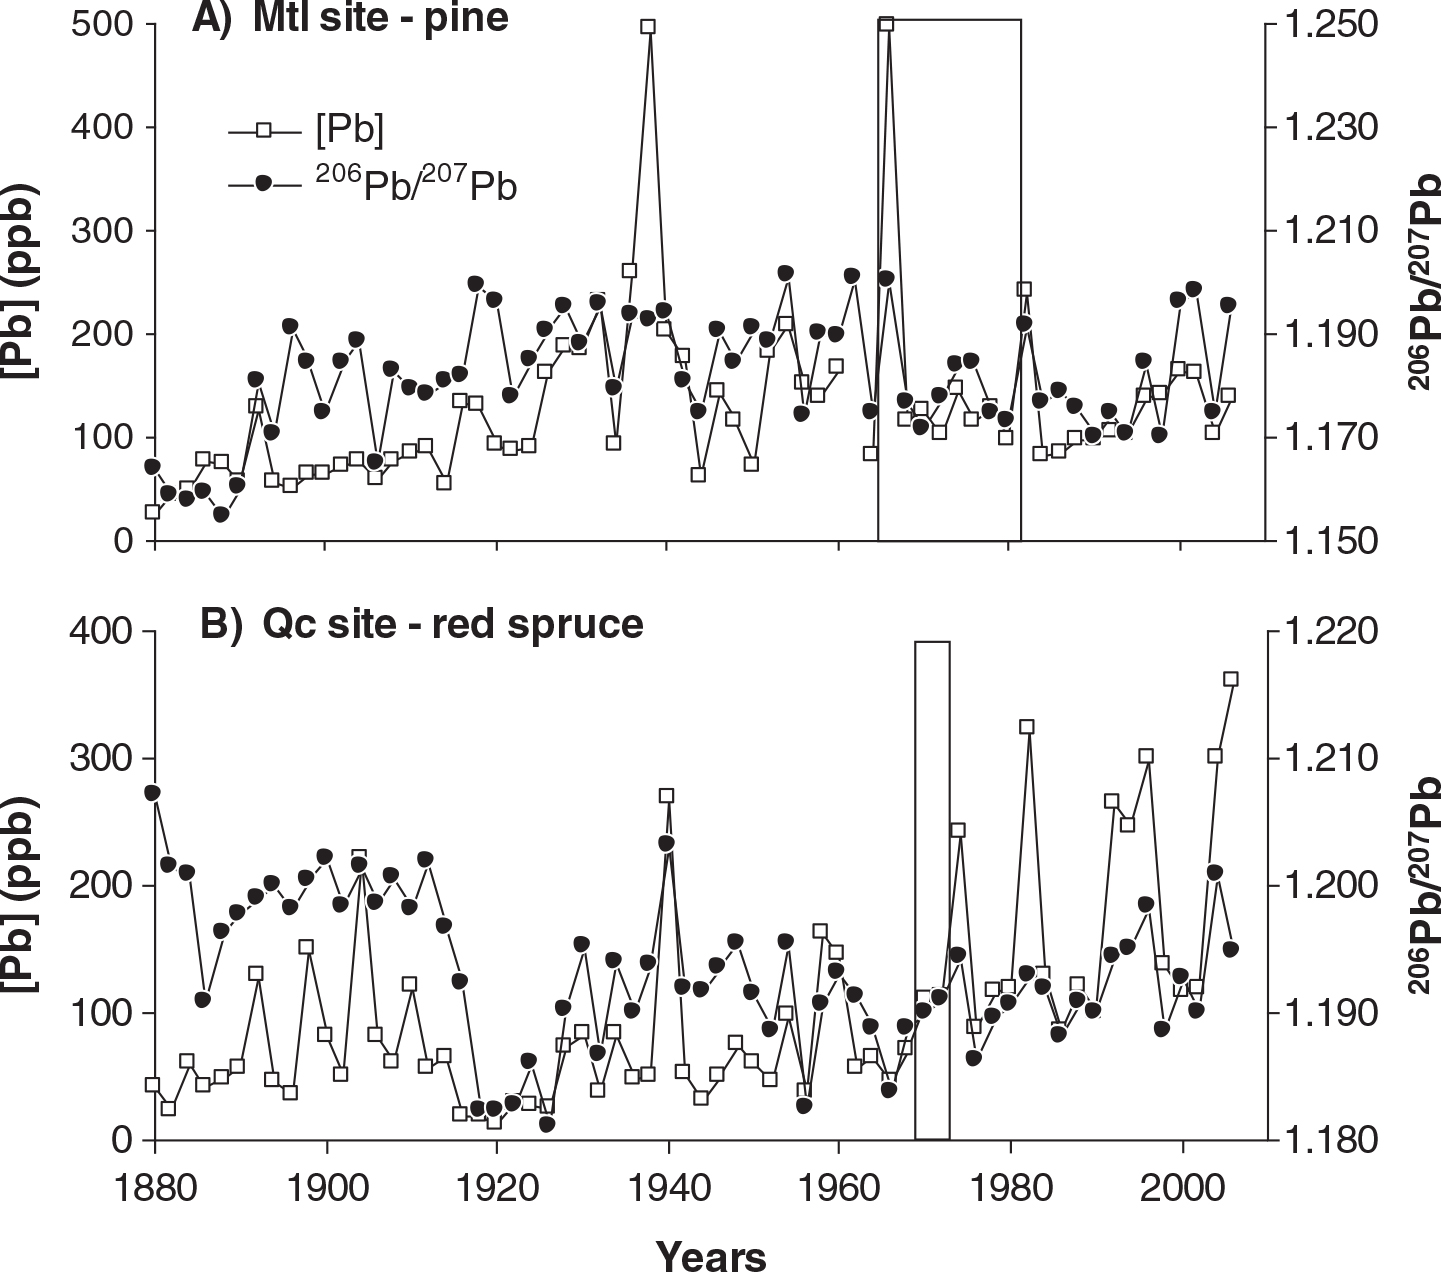
Fig. 5.
Comparison between soil Ca concentrations of each sites (A), North American NO x (Husar, 1994; Galloway, 1995; Bélanger, 2000) and SO x (Husar, 1994; US EPA, 2000) emissions (B), tree-ring Ca/Al ratios of each studied site (C), and meteorological parameters (temperature and precipitation). The term ‘15 months’ represents the data from June of the last year to August of the current year. The vertical dashed line indicates the inferred soil acidification period.
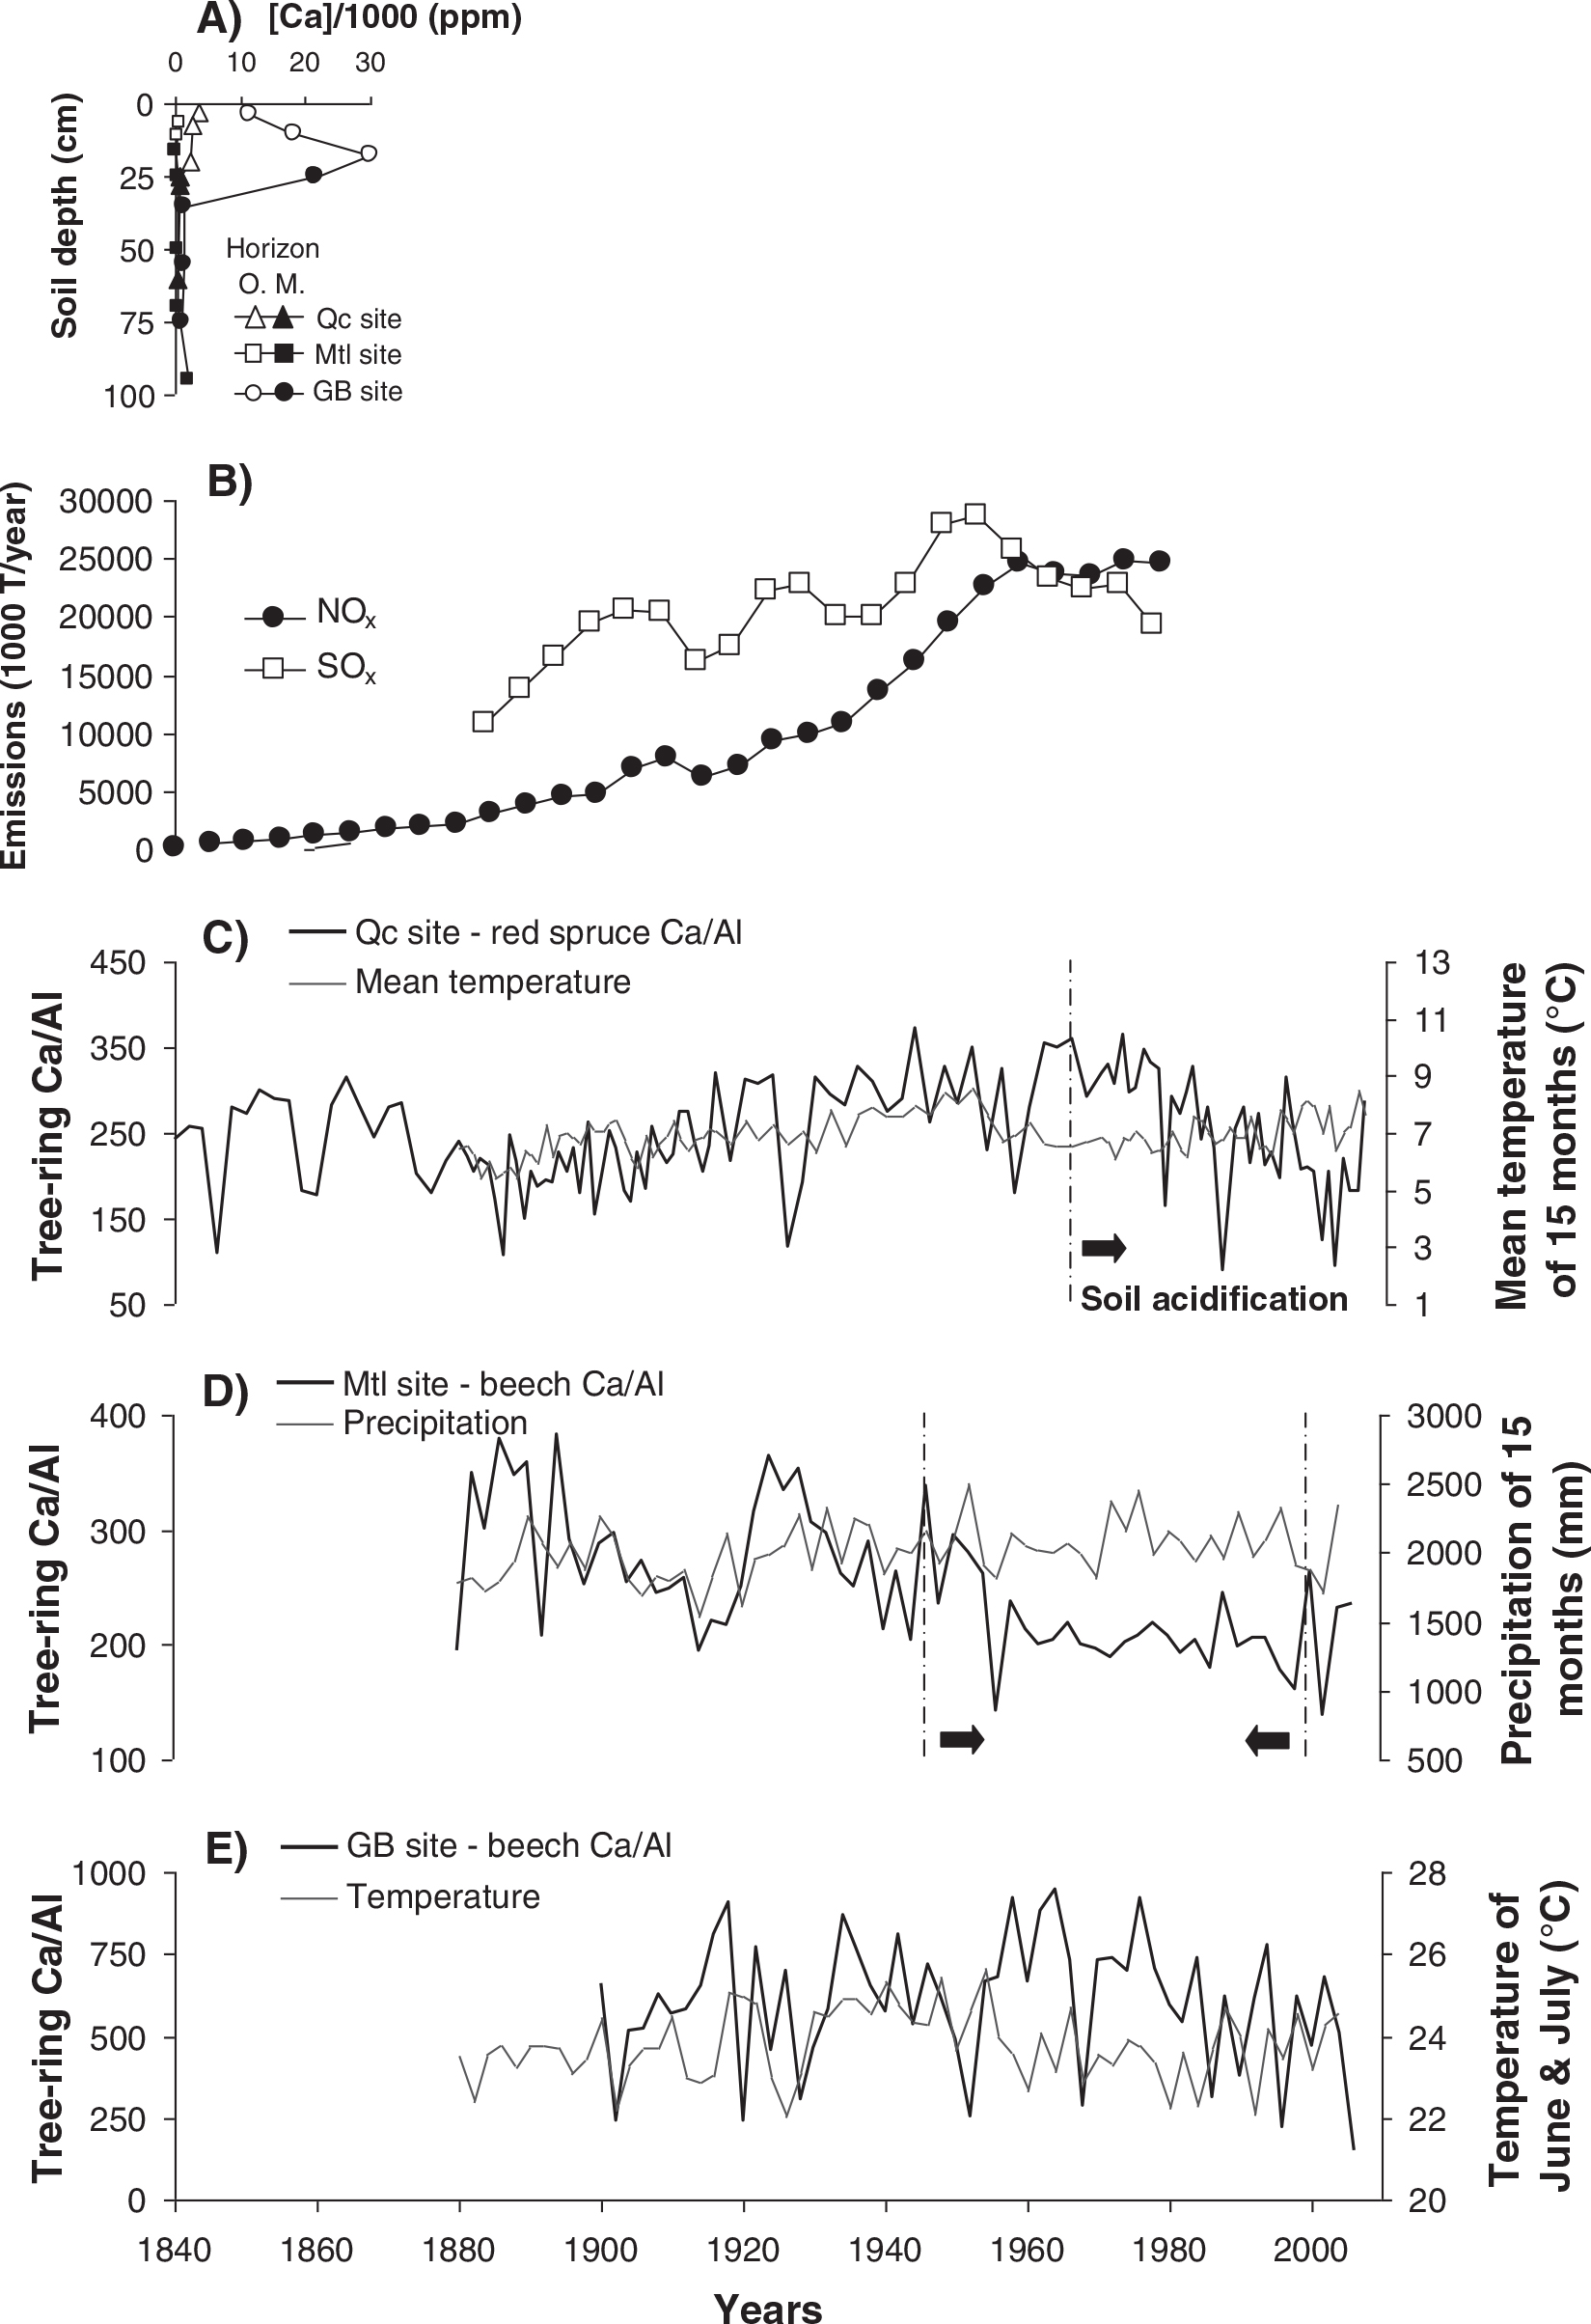
Fig. 6.
Comparison between measured tree-ring δ13C values (thin line) of beech (A) and pine (B) trees of the Mtl site, of beech (C) and cedar (D) trees of the GB site, and of red spruce trees of the Qc site (E), their δ13C calibrated values based on a non-linear regression using meteorological parameters (black squares), and the modelled δ13C values based on this equation (open squares). The estimation errors of the model are graphically represented and the starting point of the visible impact of air pollution on the isotopic values is indicated by the dashed lines.
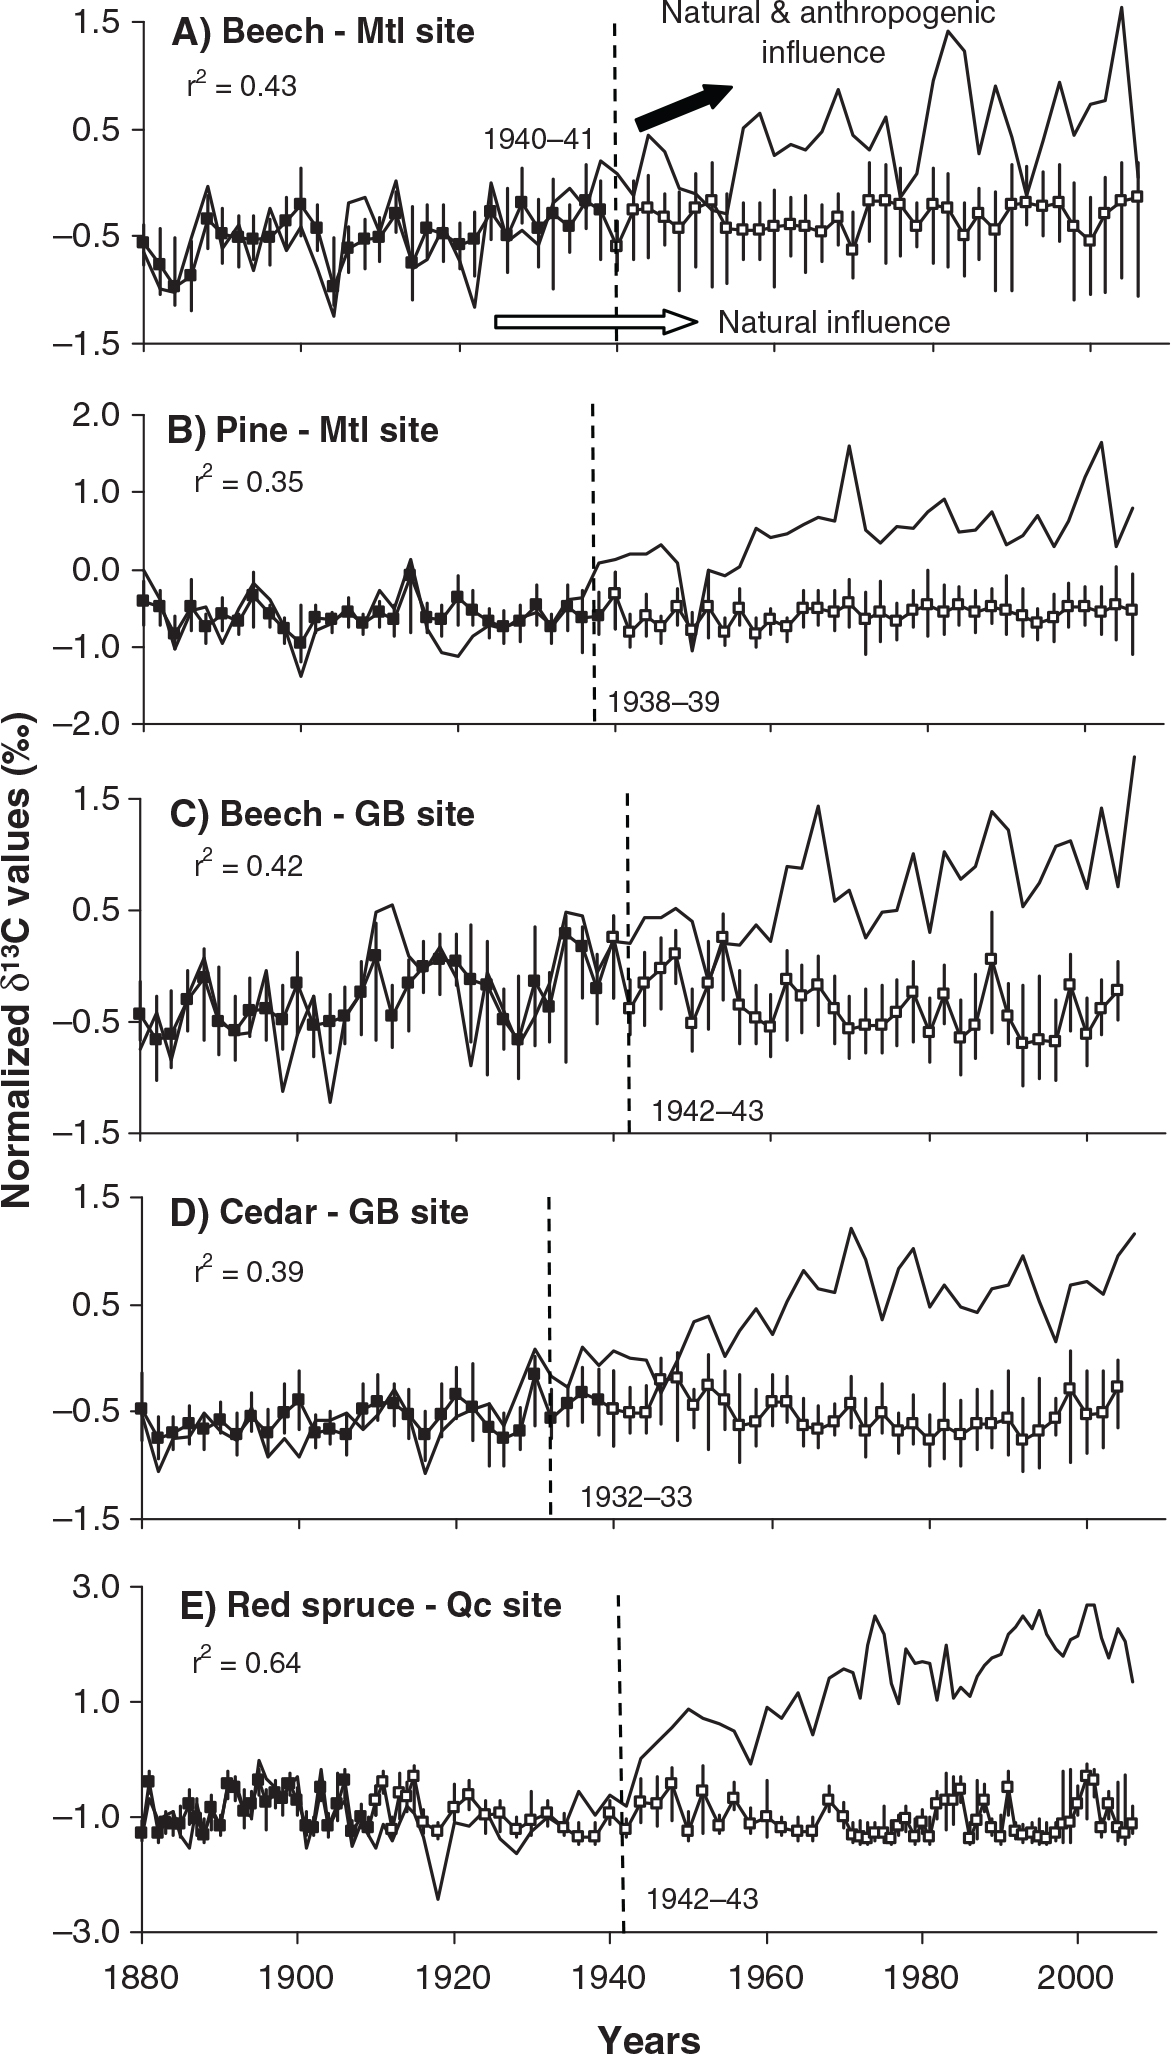
Fig. 7.
Comparison between measured tree-ring δ18O values (thin line) of beech (A) and pine (B) trees of the Mtl site, of beech (C) and cedar (D) trees of the GB site, and of red spruce trees of the Qc site (E), their δ18O calibrated values based on a non-linear regression using meteorological parameters (black squares), and the modelled δ18O values based on this equation (open squares). The estimation errors of the model are graphically represented and the starting point of the visible impact of air pollution on the isotopic values is indicated by the dashed lines.
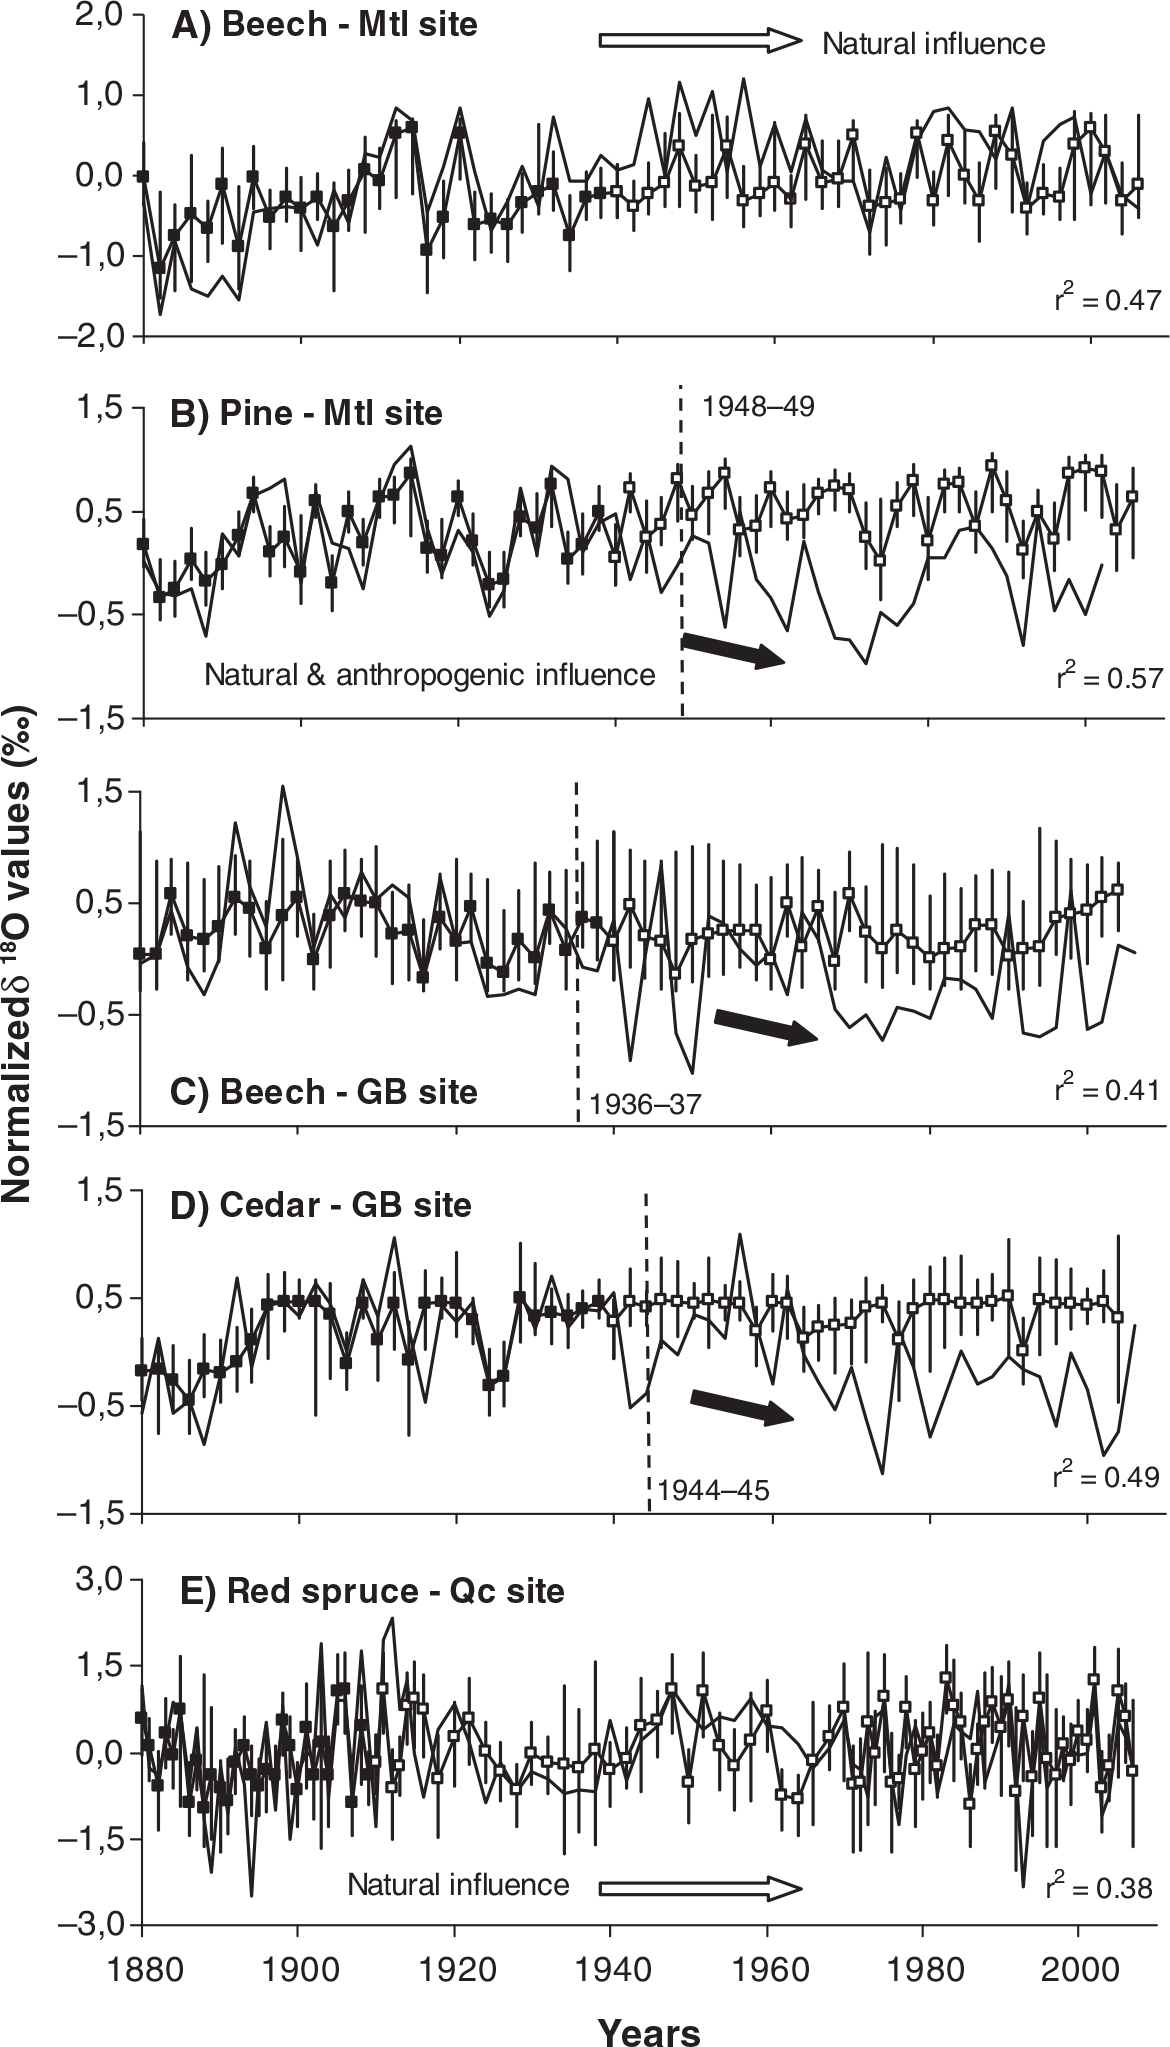
Table 3. Regression analysis of tree-ring δ13C and δ18O values of the 1880–1881 to 1938–1939 period, with the significant climatic parameters for the Mtl and GB sites
[i] aAnnual: meteorological data from January to December.
[ii] b15 months: meteorological data from June of the precedent year to August of the current year.
Table 4. Year-to-year correlation between tree-ring δ18O values and meteorological parameters for the calibration (1880–1881 to 1938–1939) and the modelled (1940–1941 to 2006–2007) periods based on the GLK coefficient (%)
[i] The negative sign indicates a negative correlation. The GLK coefficients were significant at *P<0.05 and **P<0.01.
[ii] a maxT refers to maximum temperature.
[iii] b meanT refers to mean temperature.
[iv] cPrec. refers to precipitation.
[v] dAnnual refers to data from January to December.
[vi] e15 months refers to data from June of the precedent year to August of the year of interest (Weiss et al., 1999).