Fig. 1.
δ(O2/N2) of 6 standard air samples determined against the primary standard air. Open and closed circles represent the results obtained when the cylinders are standing up and lying down on the floor, respectively.
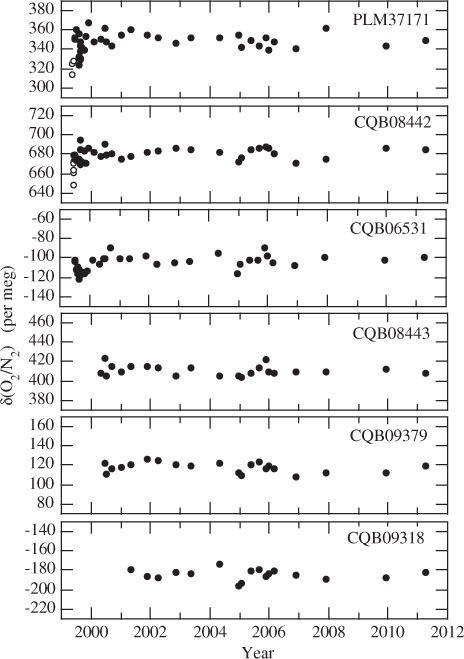
Fig. 2.
δ(O2/N2) and CO2 concentration observed in the troposphere over Japan and at the ground surface in the suburbs of Sendai, Japan.
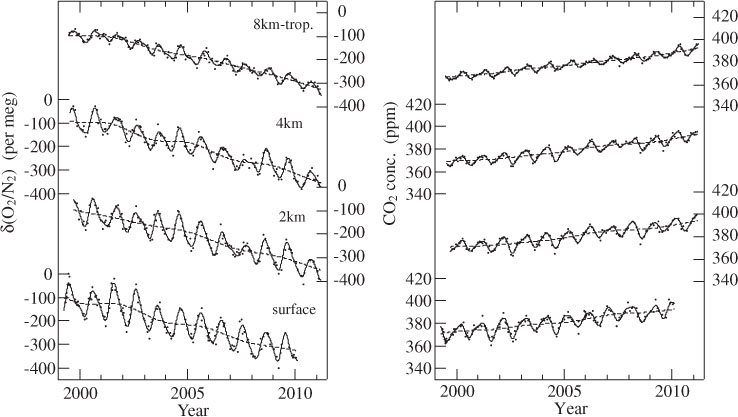
Fig. 3.
Average seasonal cycles of δ(O2/N2), CO2 concentration and APO observed in the troposphere over Japan and at the surface in Sendai (a–c), and average seasonal APO cycles calculated using STAG (solid lines) and ACTM (dashed lines) for the corresponding altitudes (d).
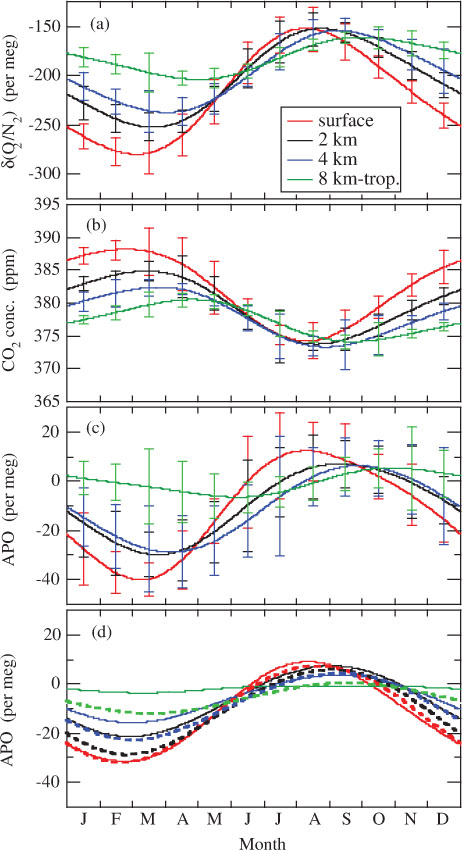
Fig. 6.
Peak-to-peak amplitudes and appearance times of the maxima and minima of the average seasonal APO cycles observed at (a) Northern Hemispheric coastal sites and (b) high-altitude and inland sites. The results obtained using STAG and ACTM are also shown.
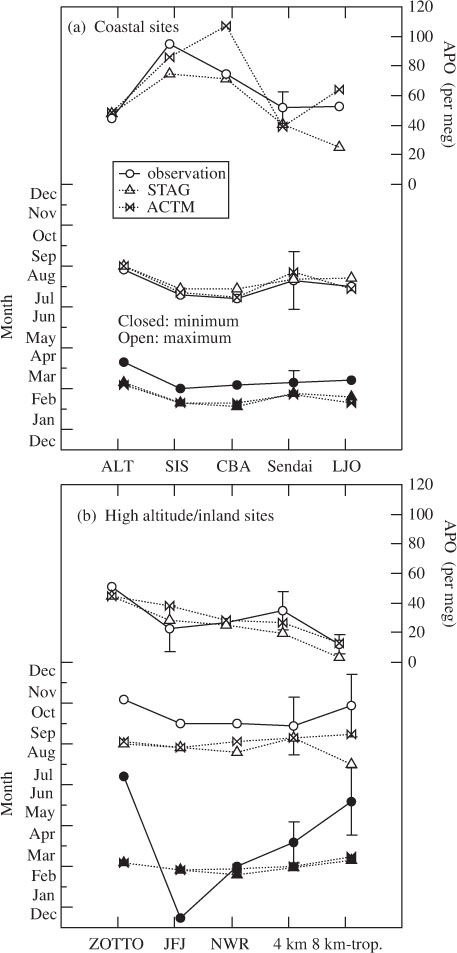
Fig. 4.
Five-d backward trajectories calculated using HYSPLIT for our observation dates in 2005, 2006 and 2007. Red, black, blue and green lines indicate trajectories from the surface in Sendai, 2, 4 km and 8 km-tropopause over Japan, respectively.

Fig. 5.
(a) Fractions of the seasonal CO2 concentration, δ(O2/N2) and APO amplitudes at the respective altitudes to the surface, and (b) appearance times of the maxima and minima of the average seasonal cycles of CO2 concentration and APO observed in the troposphere over Japan and at the surface in the suburbs of Sendai. Also shown in (b) are the results obtained using STAG and ACTM for APO.

Table 1. Oceanic and terrestrial biosphere CO2 uptake estimated from the present and other recent studies based on atmospheric O2 and CO2 measurements
[i] aThe values in brackets are recalculated values by Tohjima et al. (2008) using the updated data of global CO2 changes from the NOAA/ESRL/GMD and fossil fuel CO2 emissions, and the net oceanic O2 outgassing of 0.48±0.48 GtC yr−1.
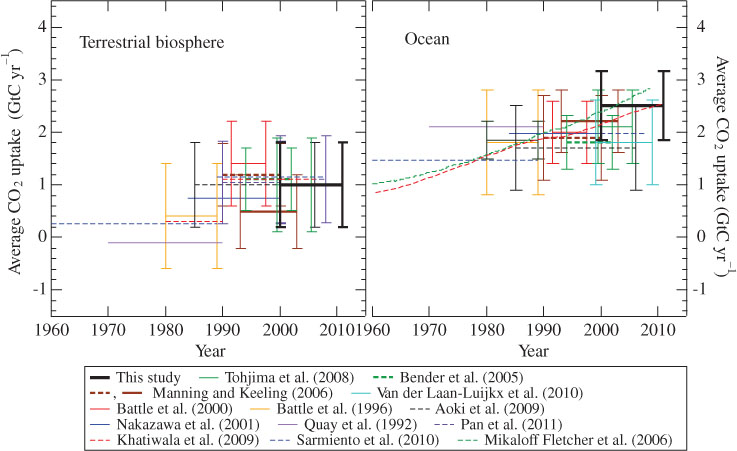
Fig. 7.
Terrestrial biospheric and oceanic CO2 uptake estimated by the present and other studies for the period after 1960.