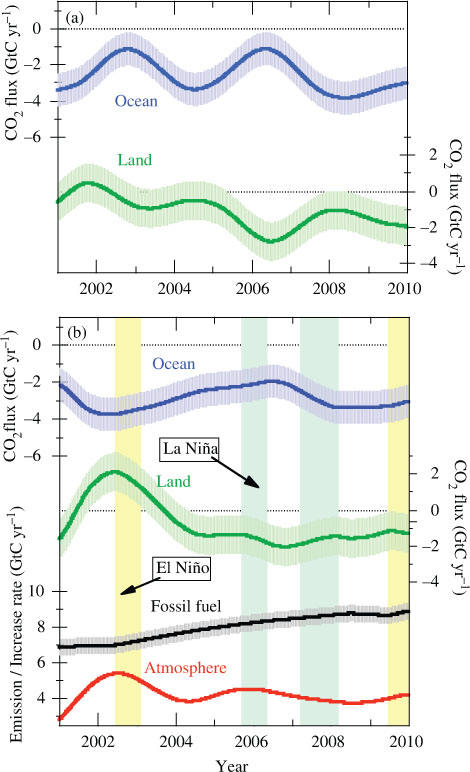
Fig. 1.
Locations of Ny-Ålesund Station, Svalbard, Norway, and Syowa Station, Antarctica.
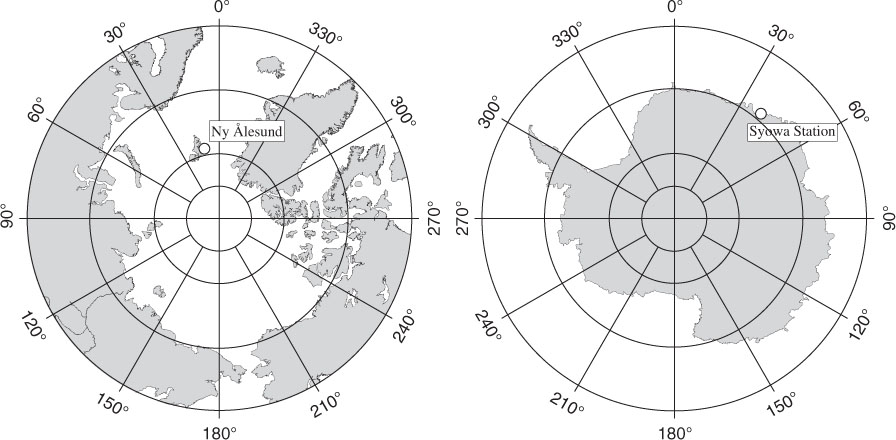
Fig. 2.
Observed values of δ(O2/N2) and CO2 concentration at Ny-Ålesund (black) and Syowa (red). Best-fit curves to the data (solid lines) and secular trends (dotted lines) are also shown.
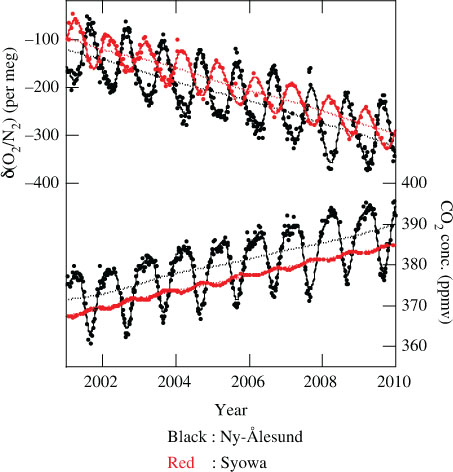
Fig. 3.
(a) Observed values of APO at Ny-Ålesund and Syowa (open circles), and simulated deseasonalised values of APO from the STAG model at these two sites, driven by air–sea O2 and N2 fluxes derived from changes in the ocean heat content (blue dots). (b) Increase rates of the observed (black lines) and simulated APO (blue lines). The increase rate of APO corrected for the contribution of interannually varying air–sea O2 (N2) flux by subtracting an average of the increase rates simulated for Syowa and Ny-Ålesund from that observed at the two sites is also shown (green line).
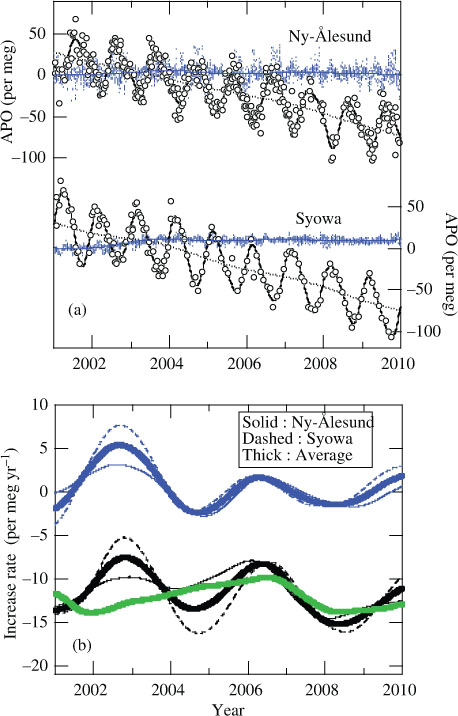
Fig. 4.
Comparison of observed and simulated seasonal cycles of APO at Ny-Ålesund and Syowa. The simulated seasonal cycles were obtained using the STAG model that incorporated the monthly air–sea O2 (N2) flux climatology. Shades represent uncertainties of the observed seasonal APO cycles.
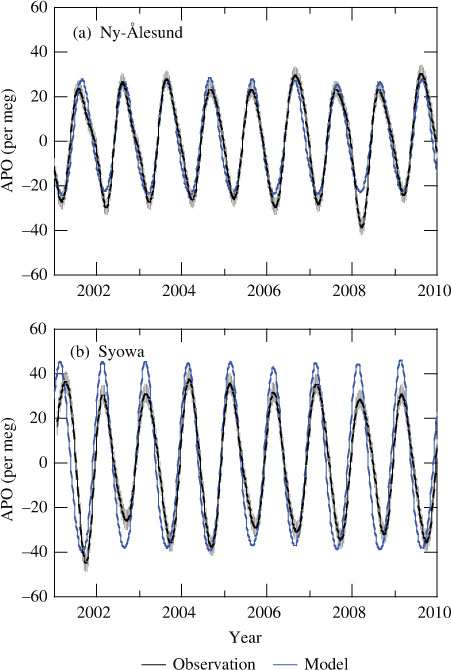
Fig. 5.
(a) Interannual variations of the oceanic and terrestrial biospheric CO2 uptake estimated using the average increase rate of APO observed at Ny-Ålesund and Syowa, and (b) those using the average increase rate of APO corrected for interannually varying air–sea O2 (N2) fluxes induced by changes in the ocean heat content (see text). The rates of CO2 emission from fossil fuel combustion/cement manufacture and increase of atmospheric CO2 are also shown. Shades around solid lines with Ocean, Land and Fossil fuel represent uncertainties of their values.