Have a personal or library account? Click to login
Stable carbon isotope signatures of methane from a Finnish subarctic wetland Cover

Stable carbon isotope signatures of methane from a Finnish subarctic wetland

Open Access
|Jan 2012

Figures & Tables

Fig. 1. 

Methane mixing ratio and δ13C measured in air samples collected at 42 cm above ground level throughout a diel period, 5–6 August 2008.
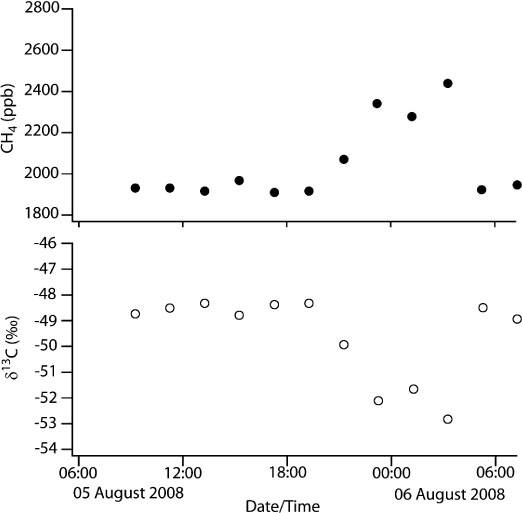
Fig. 2. 

Keeling plots showing the source signature of methane from Lompolojänkkä from spring thaw to autumn freeze in 2009. Also included is the Keeling plot for the sampling in August 2008, showing that the summer source signature did not change between 2008 and 2009. The source signature in each case is the intercept of a geometric mean regression. The uncertainty given is the SE in the intercept from the regression.
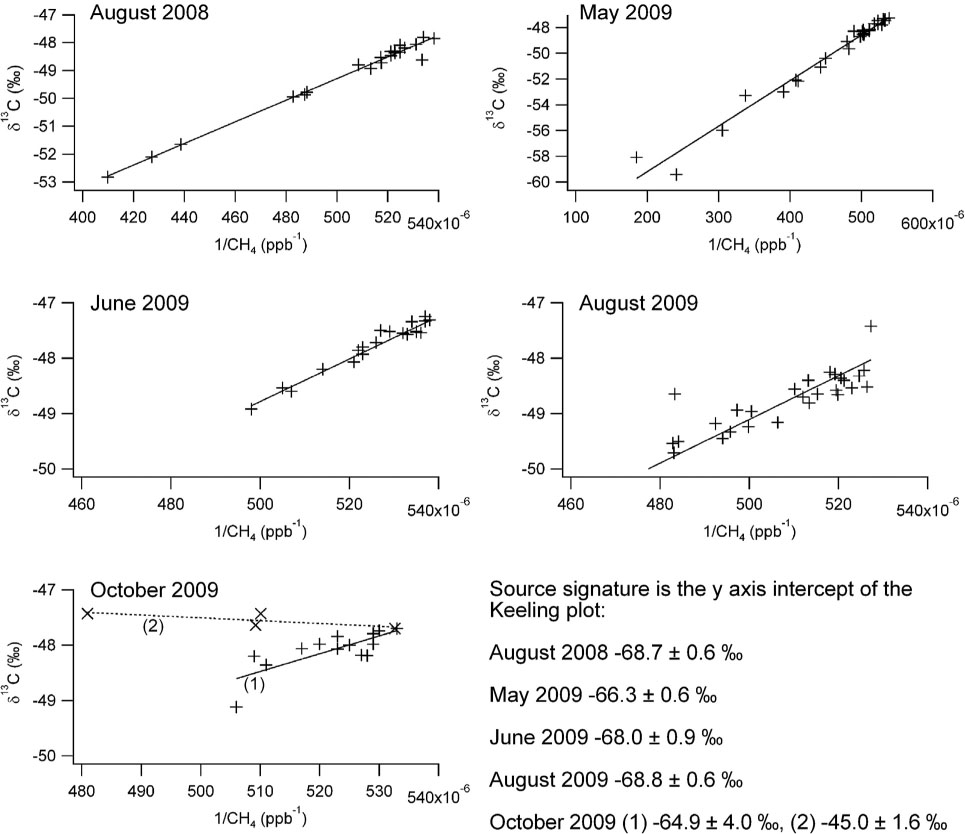
Table 1. Comparison of wetland methane source signatures calculated from diel and chamber samples in 2009 and some examples from other studies

Study periodδ 13 C CH4 calculated from diel campaign (‰)Average δ 13 C CH4 calculated from all chambers (‰)Range of δ 13 C CH4 calculated from chambers (‰) 5–6 August 2008 −68.7±0.6 −65.8±0.7 −66.5 to−65.1 (n=6) 4–5 May 2009 −66.3±0.6 −67.4±0.5 −67.7 to−66.7 (n=15) 15–17 June 2009 −68.0±0.9 −68.7±3.8 −76.8 to−61.9 (n=13) 8–10 August 2009 −68.8±0.6 −64.5±1.8 −68.1 to−61.0 (n=23) 8–9 October 2009 −64.9±4.0 −66.1±1.7 −67.9 to−62.7 (n=8) Locationδ 13 C CH4 (‰)References Ob River Wetlands: Meth-MonitEUr study −67.2 Lowry et al. (2004) and Meth-MonitEUr (2005) Russia – various −69 to−62 Ovsyannikov and Lebedev (1967), Bergamaschi et al. (1998) and Tarasova et al. (2006) Alaska −64±5 Quay (1988) Minnesota wetland −67.2±1 Stevens and Engelkemeir (1988) −66±5 Quay et al. (1988)

[i] Numbers in parentheses denote the number of individual chamber experiments.

Fig. 3. 

Methane fluxes, air and soil temperatures (at 7 cm below the surface) observed at Lompolojänkkä during the spring thaw in May 2009. The methane flux is derived on site using the eddy covariance technique. The methane flux increases rapidly between 4 and 5 May.
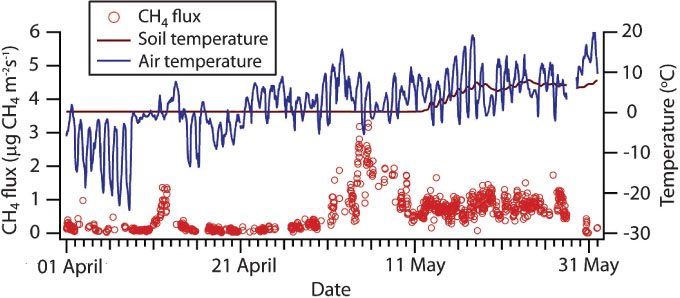
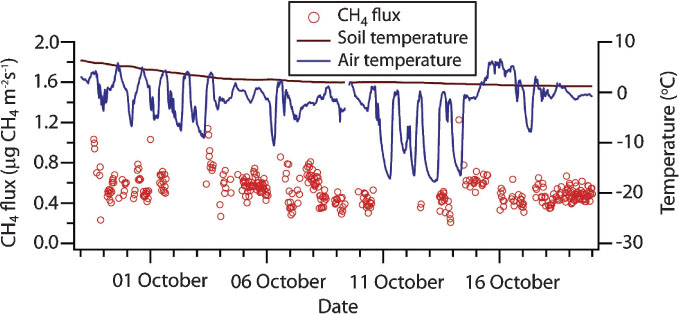
Fig. 4. 

Methane fluxes seen during the freezing of Lompolojänkkä wetland during autumn 2009. The decreasing flux correlates with the decreasing soil temperature (measured at 7 cm below the surface).
Language: English
Page range: 18818 - 18818
Submitted on: Aug 27, 2011
Published on: Jan 1, 2012
Published by: Stockholm University Press
In partnership with: Paradigm Publishing Services

© 2012 S. Sriskantharajah, R. E. Fisher, D. Lowry, T. Aalto, J. Hatakka, M. Aurela, T. Laurila, A. Lohila, E. Kuitunen, E. G. Nisbet, published by Stockholm University Press
This work is licensed under the Creative Commons Attribution 4.0 License.