Fig. 1.
Mediterranean (in red) and North Africa-Europe-Mediterranean (in blue) forecast domains of the operational versions of BSC-DREAM.
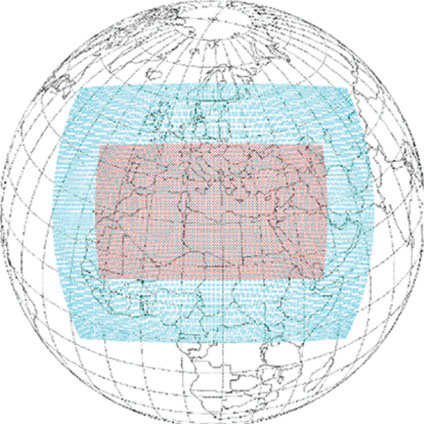
Table 1. Summary of the main features of each model version used in the present analysis: model version, status, texture-type dataset, threshold friction velocity, horizontal and vertical flux, source size distribution, preferential sources, wet deposition, dry deposition, number of bins and radiative feedbacks.
[i] The codes denote the following references. B41: Bagnold (1941); D87: D'Almeida (1987); D87N01: D'Almeida (1987) modified with the correction factors used by Nickovic et al. (2001); G01: Ginoux et al. (2001); G86: Giorgi (1986); IW82: Iversen and White (1982); MB95: Marticorena and Bergametti (1995); N01: Nickovic et al. (2001); S93: Shao et al. (1993), P06: Pérez et al. (2006a); White (1979); Z01: Zhang et al. (2001).
Fig. 2.
In the top and central panels, it is shown the source term based on the arid and semi-arid categories of the 10-min SSiB (a) and Olson World Ecosystem and the 1-km USGS land use datasets (b). In the panel c, regional distributions of the source function (G) from Ginoux et al. (2001) are shown in the grey scale. The red circles indicate dust emission source areas discussed in the text: (1) Bodélé, (2) Mali, (3) Mauritania, (4) Western Sahara-Morocco, (5) Algeria-Adrar, (6) North of Algeria-Tunisia, (7) Lybia desert, (8) An-Nafud desert and (9) Rub’ Al Khali desert.
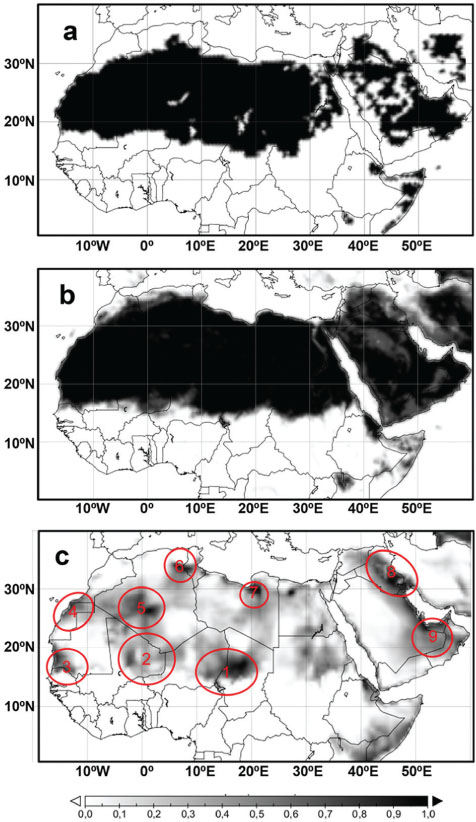
Table 2. Dust size bins introduced in the BSC-DREAM8b model. The bin intervals are taken from Tegen and Lacis (1996). Here r min – r max are minimum and maximum radius and r eff is effective radius for each size bin.
Fig. 3.
Spatial distribution of 44 selected AERONET stations over the study domain. Acronyms are described in the Table 3. The different colours indicate the different regions which are defined as: Sahel, Eastern Tropical Atlantic (E.Trop.Atl), Eastern subTropical Atlantic (E.sub-Trop.Atl), Northwestern Africa (NW.Afr), Western Iberian Peninsula (W.IP), Eastern Iberian Peninsula-Western Mediterranean (E.IP-W.Med), Central Mediterranean (C.Med), Eastern Mediterranean (E.Med) and Middle East.
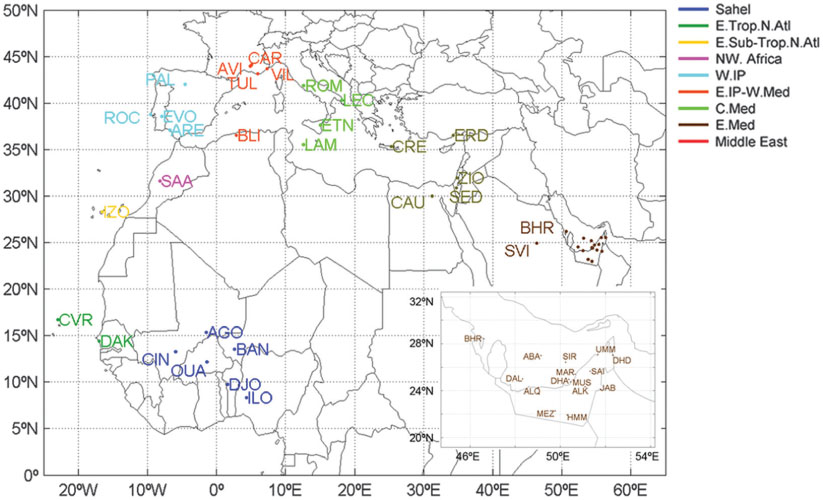
Fig. 4.
Seasonal averages of the dust AOD modelled by M4 (top panels) and M8 (bottom panels).
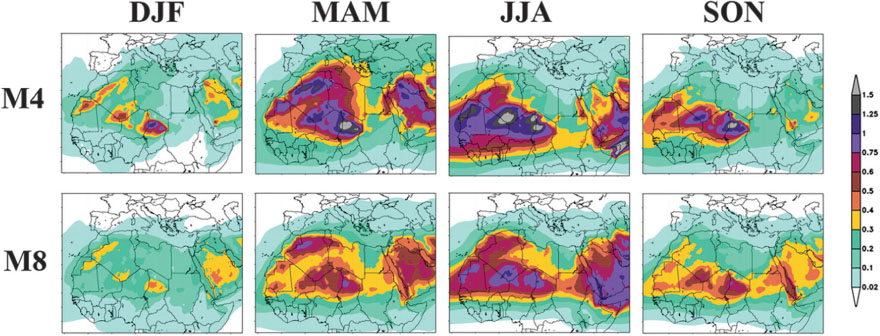
Fig. 5.
Seasonal averages of the dust AOD modelled by D8 (top panels) and N8 (bottom panels).
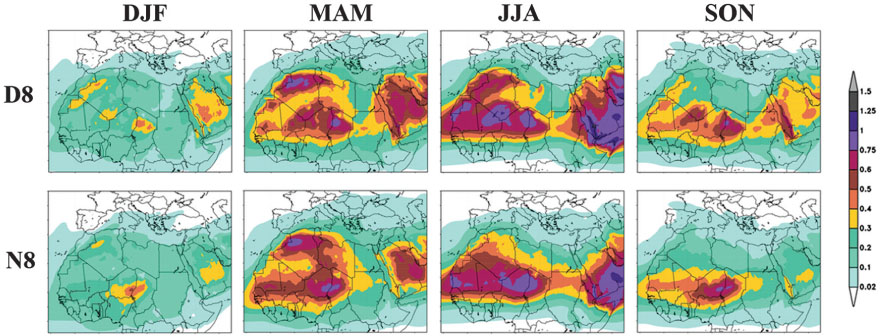
Fig. 6.
Seasonal averages of the dust AOD modelled by DG8 (top panels) and NG8 (bottom panels).
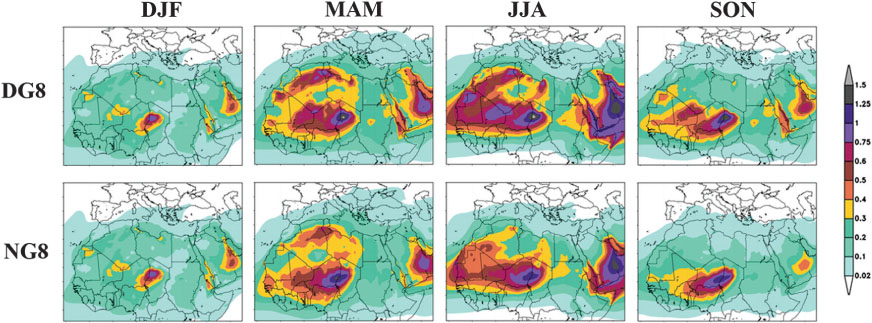
Table 3. Location and description of the 44 selected AERONET stations. Zone of location is defined in Fig. 3, class of location which are defined as stations: above 1000 m (H), in arid and desert areas (D), in the ocean (O), in remote and urban areas (R/U) and in littoral areas (C); coordinates, altitude, first and last measurement date, number of measurements (N), the number of hours (Hr.), days (Dy.) and months (Mo.), the percentage of cloud screened data of the selected AERONET stations (F) in the observation period and the availability of the quality-assured SDA retrieval products (SDA).
Fig. 7.
Seasonal average of the observed aerosols for 2004 for TOMS AI (left panels), MISR AOD (central panels) as well as a combination of MODIS Aqua AOD products (Collection 005 and Deep Blue; right panels).
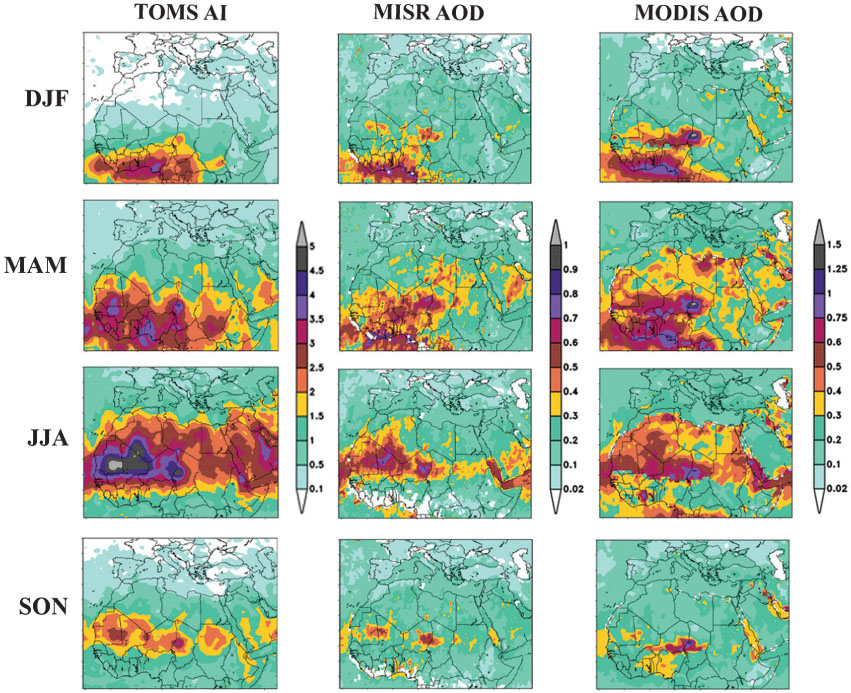
Fig. 8.
Temporal series of the modelled (M4, M8, D8, DG8, N8 and NG8) versus direct-sun AERONET measurements (AOD and Ångström exponent, AE) averaged by regions in daily basis. From the top to the bottom: Sahel, Eastern Tropical North Atlantic and Middle East regions. The legend includes the annual values (calculated in hourly basis) of the correlation coefficient (r), mean bias (MB) and root mean square error (RMSE) of each model version averaged for each region represented.
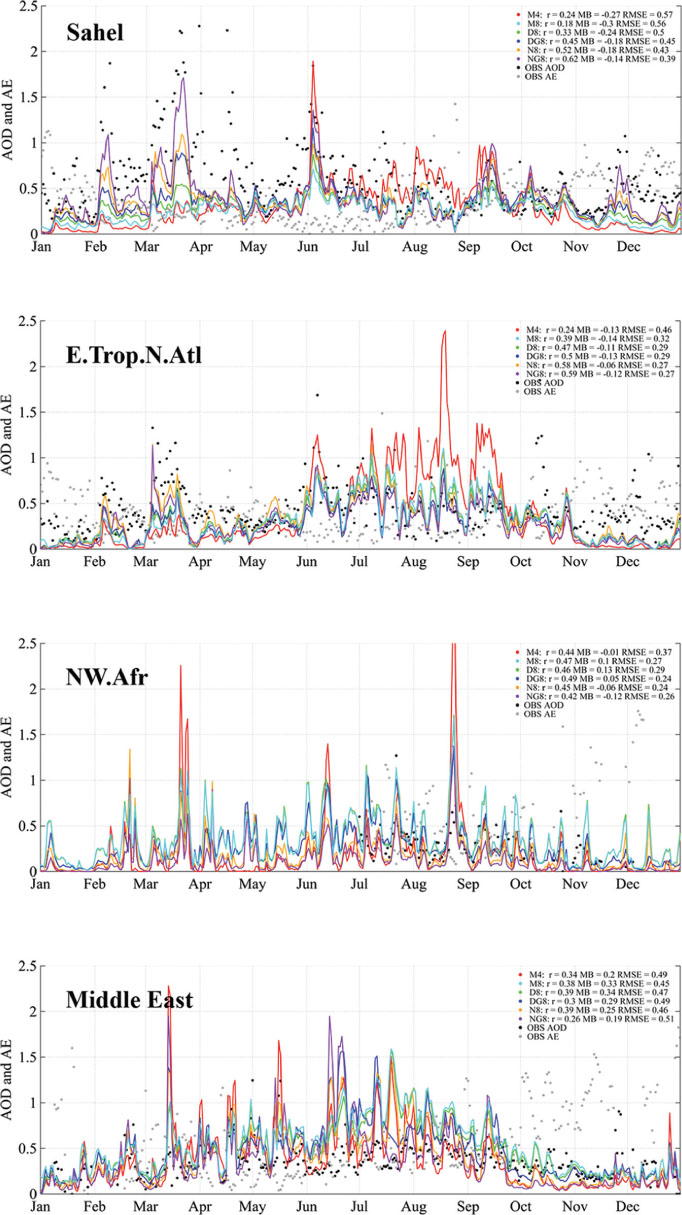
Fig. 9.
Temporal series of the modelled AODcoarse (M4, M8, D8, DG8, N8 and NG8) versus SDA AERONET retrievals averaged by Mediterranean and Middle East regions in daily basis. The legend includes the annual values (calculated in hourly basis) of the correlation coefficient (r), mean bias (MB) and root mean square error (RMSE) of each model version averaged for each region represented.
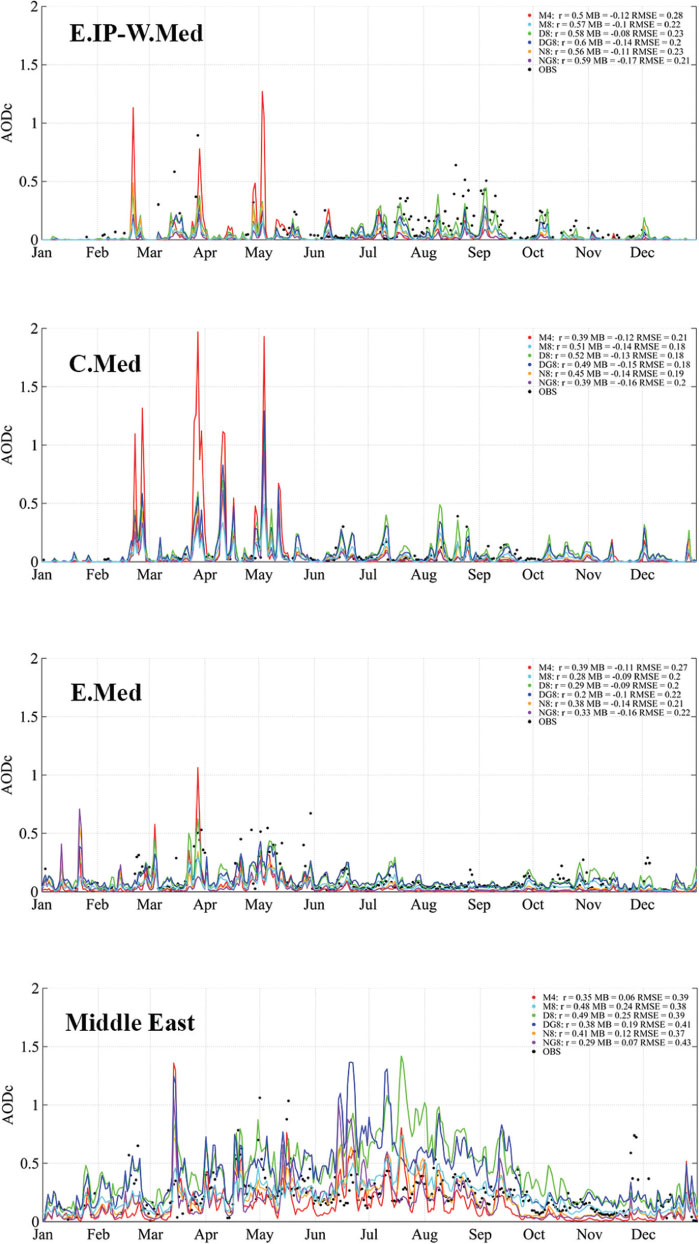
Fig. 10.
Temporal series of the monthly evolution of mean bias (MB) obtained from the comparison between modelled (M4, M8, D8, DG8, N8 and NG8) versus direct-sun AERONET measurements averaged by regions. Regions are defined in Fig. 3.
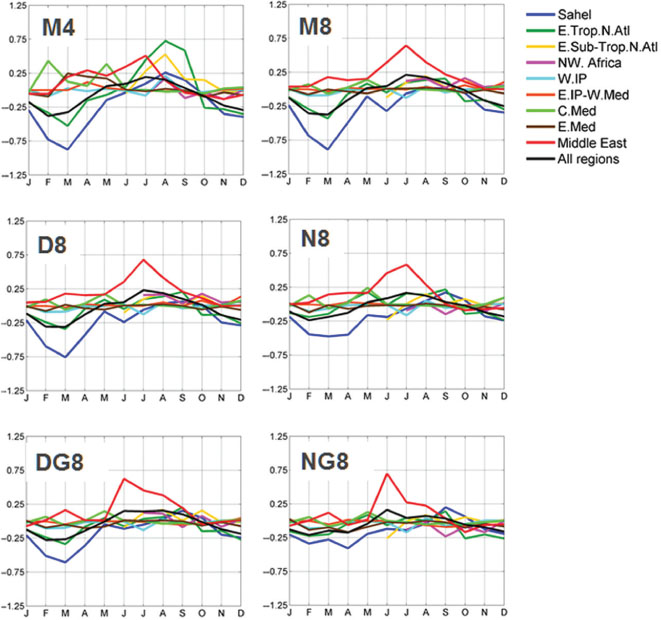
Fig. 11.
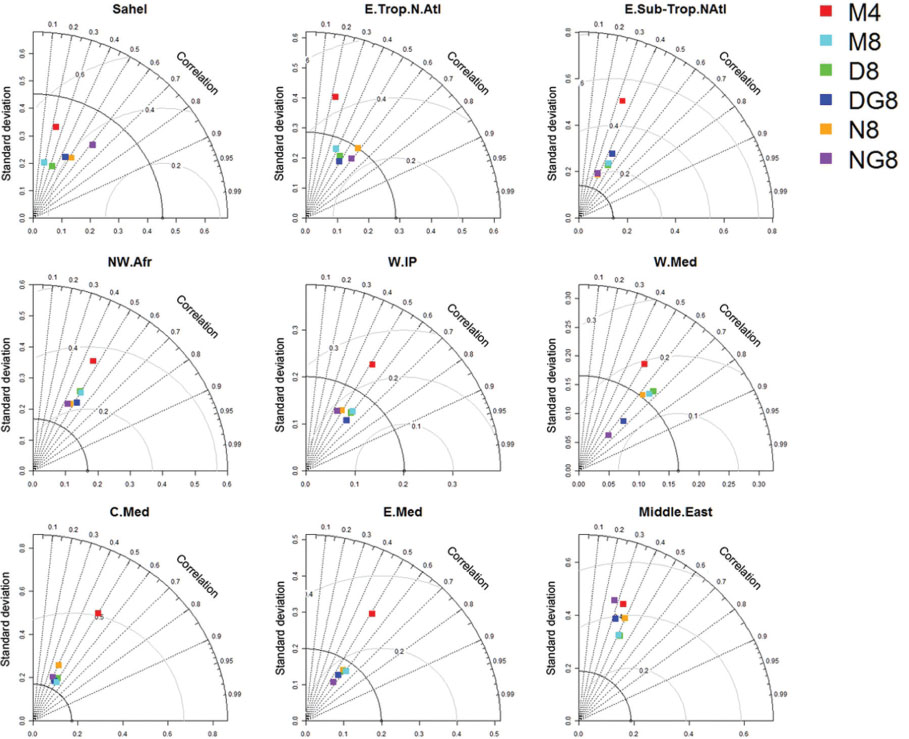
Taylor's diagrams for M4, M8, D8, DG8, N8 and NG8 model version against the filtered AOD direct-sun AERONET observations by regions. The radial distance from the origin is proportional to the standard deviation of a pattern. The centred root mean square (RMS) difference between the test and reference field is proportional to their distance apart (in the same units as the standard deviation). The correlation between the two fields is given by the azimuthal position of the test field. Regions are defined in Fig. 3.