Fig. 1.
(A) Site location (star) in relation to major Greenland ice core drilling sites (filled circles). (B) Isentropic back trajectories for air masses arriving to Summit, Greenland on 5 August 1994 calculated using NCAR reanalysis data and the HYSPLIT model.
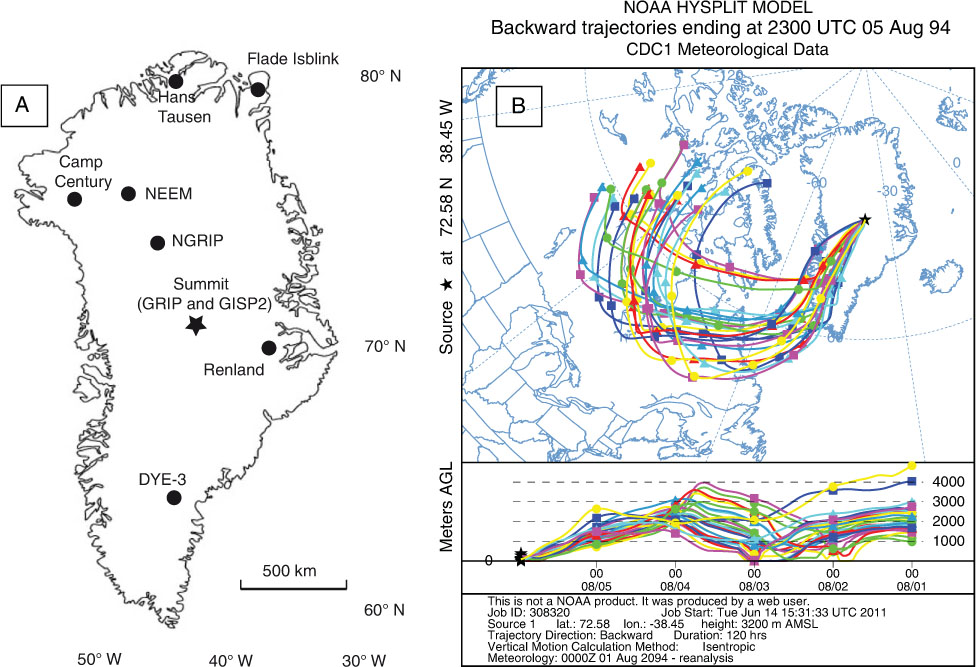
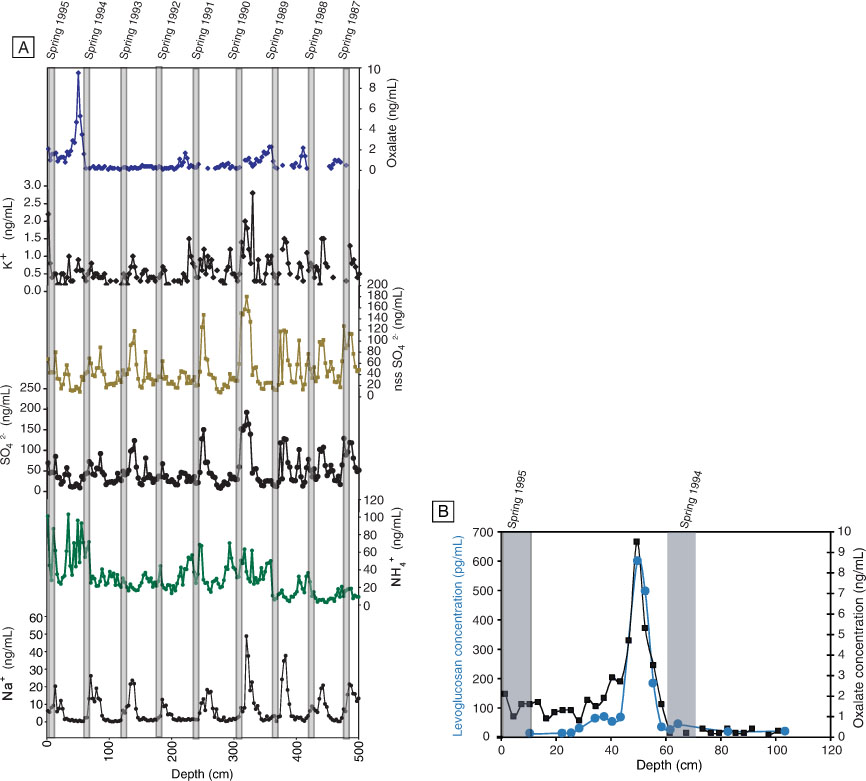
Fig. 2.
(a) Biomass burning indicators recorded in a Summit, Greenland snow pit. Sodium (Na+) peaks determine the seasonality and annual layers where spring (March, April and May) deposition is assumed to occur above each Na+ peak. Oxalate, SO4 2 − and Na+ data were previously published in Barbante et al. (2003). (b) Detail of levoglucosan (light blue circles) and oxalate (dark blue squares) concentrations in the upper meter of the snow pit.