Fig. 1.
Location of sampling sites.
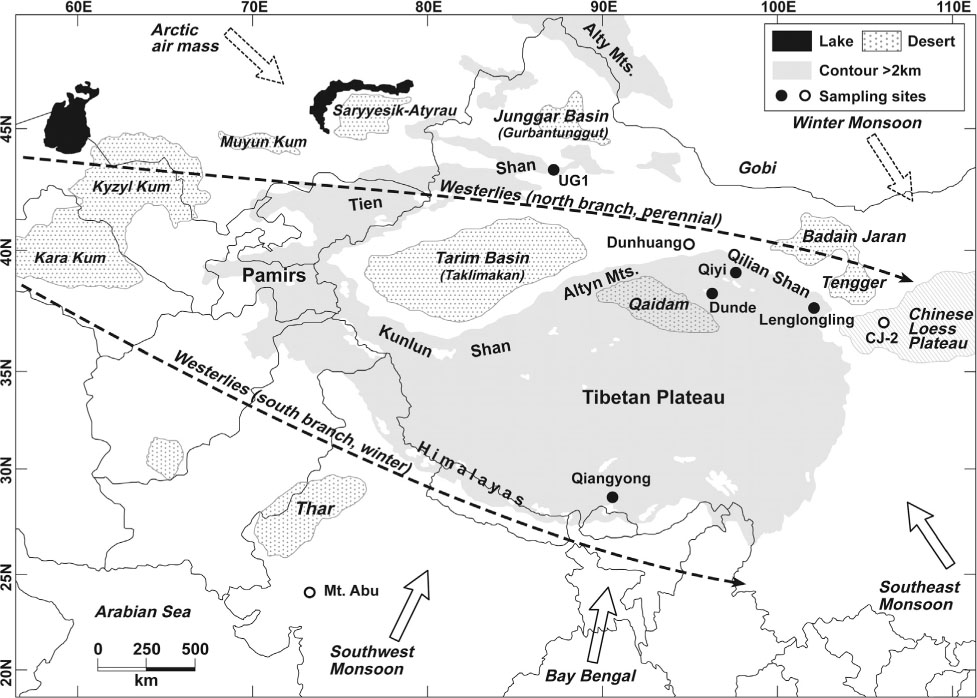
Fig. 2.
The flowchart of experimental design in this study.
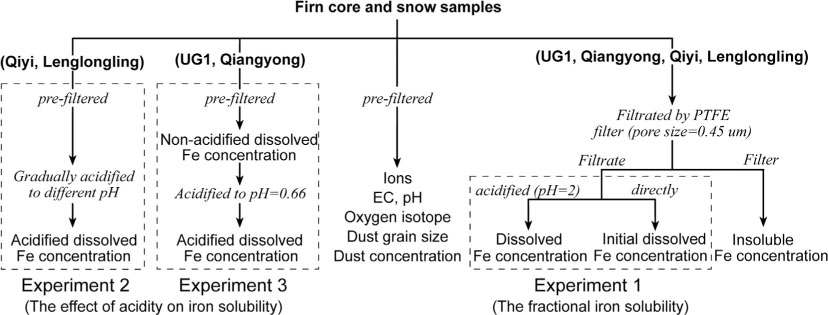
Table 1. The iron content and fractional solubility of Asian dust from different sites and dust types
Fig. 3.
The correlation between iron solubility and (a) Ca/Al ratio, (b) dust (using Al element) concentration and (c) particle grain size in Qiangyong (cycles) and Tien Shan samples (dots).
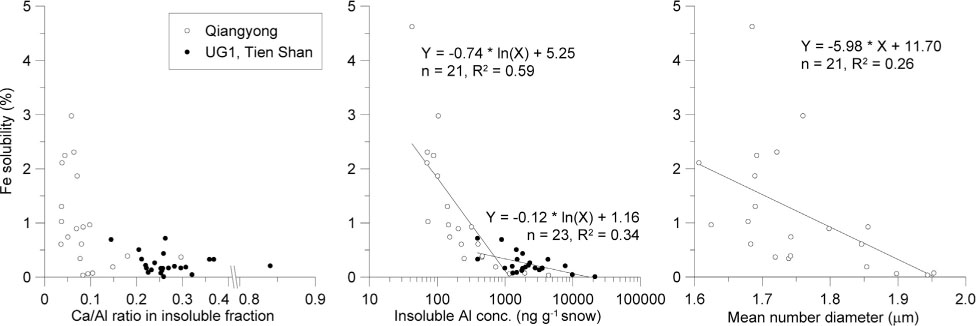
Fig. 4.
The absolute dissolved iron concentrations at different pH and the relative increasing ratios (to step 1) in snow from Lenglongling (one sample, top) and Qiyi (two samples, bottom), Qilian Shan, Northern Tibetan Plateau (Experiment 2). Note that some particulate iron might also be measured as the dissolved one in those pre-filtered samples.
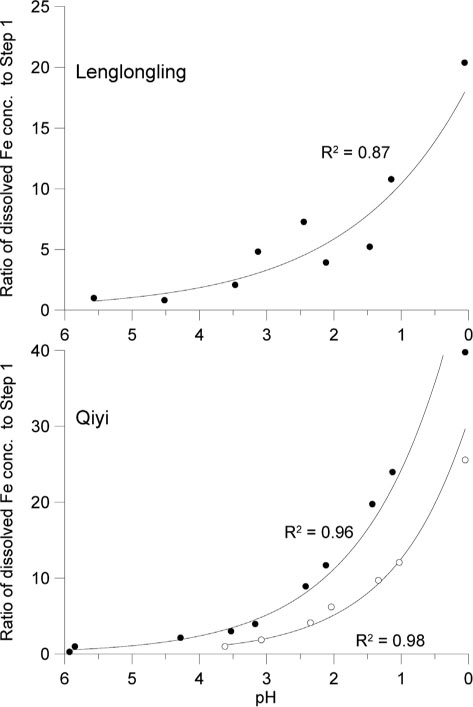
Table 2. The dissolved iron concentration (unit: ng g−1) after stepwise acidification
Fig. 5.
Comparison of iron concentrations of acidified and non-acidified UG1 (Tien Shan) (left) and Qiangyong (right) samples (Experiment 3). Alinsoluble and Fedissolved mean the insoluble aluminium mass (index of dust) and dissolved iron concentration in melted samples, respectively. DL means the detection limit. The seasonal variations in Qiangyong d18O and dust (Alinsoluble) concentration profiles favour the dating, which is indicated by vertical arrows and numbers.
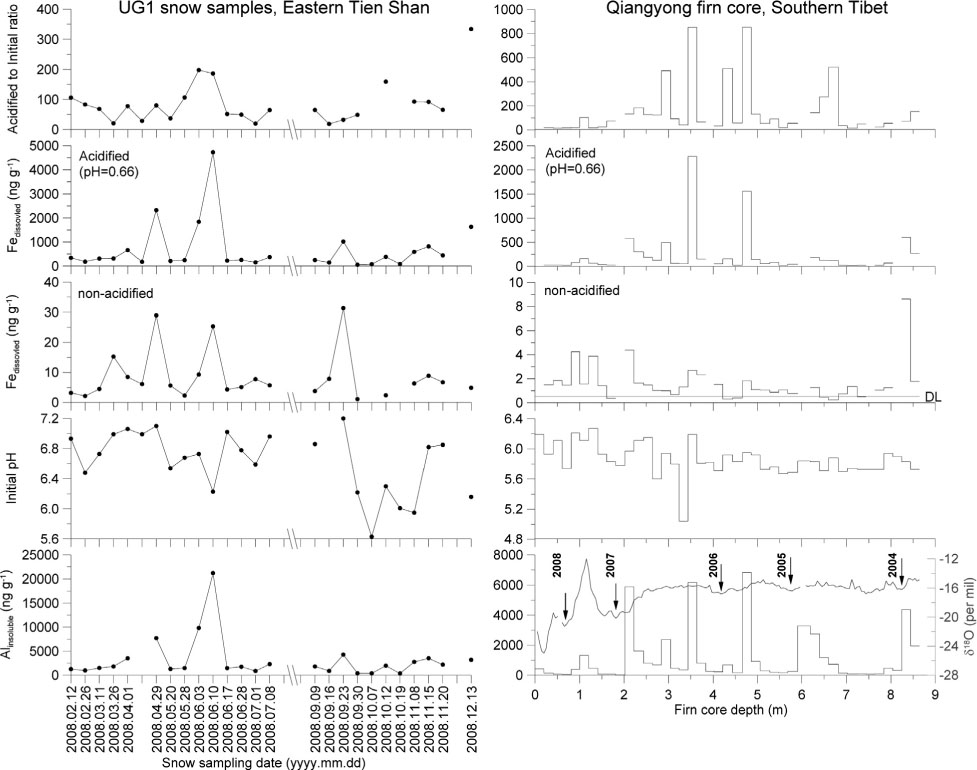
Table 3. Statistics of the initial and acidified dissolved iron concentration (unit: ng g−1) and ratio between them for Qiangyong and UG1 samples
[i] aSome particulate iron might also be measured as the dissolved one for these pre-filtrated samples.
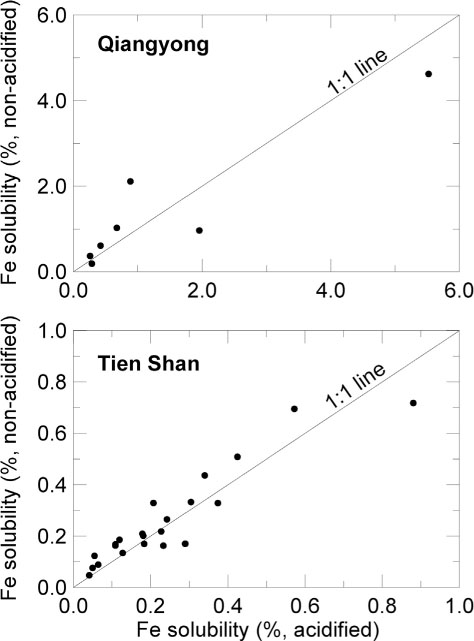
Fig. 6.
Comparison of iron fractional solubility between acidified and non-acidified post-filtrate for the Qiangyong and UG1 (Tien Shan) samples.