Have a personal or library account? Click to login
Atmospheric 210Pb, 210Po and 210Po/210Pb activity ratio in urban aerosols: temporal variability and impact of biomass burning emission Cover

Atmospheric 210Pb, 210Po and 210Po/210Pb activity ratio in urban aerosols: temporal variability and impact of biomass burning emission

By:  and    
Open Access
|Jan 2012

Figures & Tables

Fig. 1. 

Air mass back-trajectories (n=50) arriving at the sampling site (Kanpur, shown in red-square) originating from (a) long-range transport from Desert regions (40%), (b) maritime air masses (22%) and (c) localised winds from Northern India (38%).
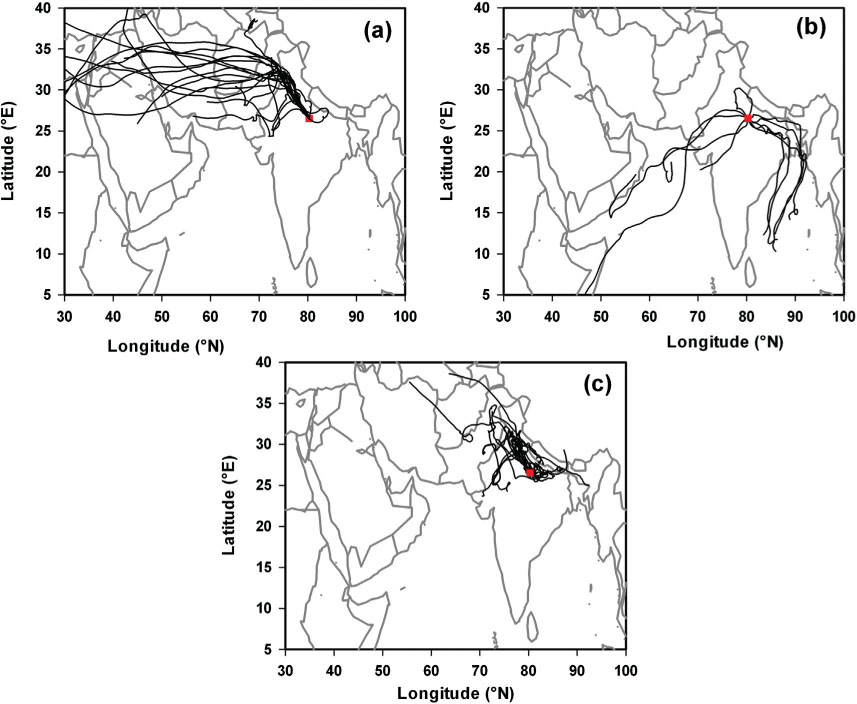
Fig. 2. 

Temporal variability of 210Pb activity and carbonaceous species (EC, OC) in aerosols from Kanpur during the sampling period. The vertical dashed-line separates the seasons whereas the vertical bar indicates a break in the sampling.

Fig. 3. 

Average 210Pb activity in urban aerosols during the sampling period. The vertical dash-lines indicate breaks in the aerosol sampling.

Table 1.210Pb, 210Po and 210Po/210Pb activity ratios from an urban site (this study) are compared with the literature data. The values in the parenthesis represent average values.

Sites Sampling period n Location Elevation (m asl$) 210Pb (mBq m−3) 210Po (mBq m−3) 210Po/210Pb ratio References Kanpur January 2007–April 2009 99 (26.5°N, 80.3°E) 142 1.8±1.1 0.0–0.28 (0.094) 0.002–0.229 (0.079) This study Lodz, Poland 2008–2009 (51.8°N, 19.5°E) 0.556 0.067 Dlugosz et al. (2010) Xiamen, China 2004–2005 (24.4°N, 118.1°E) 0.03–0.21 (0.11) Yi et al. (2007) Michigan, USA 1999–2001 30 (42.4°N, 83.0°W) 190 0.30–4.22 BDL-0.118 (0.072) 0.0–0.21 (0.075) McNeary and Baskaran (2007) Malaga, Spain 1996–2001 (36.7°N, 4.5°W) 0.51 0.045–0.070 0.11–0.13 Duenas et al. (2004) South Pole November 2000–January 2001 (90°S, 102°E) 2841 0.2 0.022±0.0011 0.13 & 0.18 Arimoto et al. (2004) Egypt January–December 2002 (28.1°N, 30.6°E) 1.2±0.15 Ahmed et al. (2004) Alaska January–March 1996 10 (65.1°N, 147.5°W) 0.22–1.02 0.0–0.152 0.0–0.177 Baskaran and Shaw (2001) Argonne, Illinois June 1996–August 1996 (41.7°N, 88°W) Marley et al. (2000) Jungfraujoch January–December 1991 (46.5°N, 8°E) 3450 0.005–0.5 Gaggeler et al. (1995) Boulder, Colorado 1967–1972 (40°N, 103.3°W) 0.15–0.78 0.002–0.052 Poet et al. (1972) Milford, Haven (51.7°N, 5°W) Peirson et al. (1966)

[i] $above sea level.

[ii] BDL=below detection limit.

Fig. 4. 

Seasonal wind-rose plot for the sampling period from January 2007 to April 2009: (a) October–November, (b) December–February and (c) March–June. The acronyms N, E, S and W refer to North, East, South and West directions, respectively.
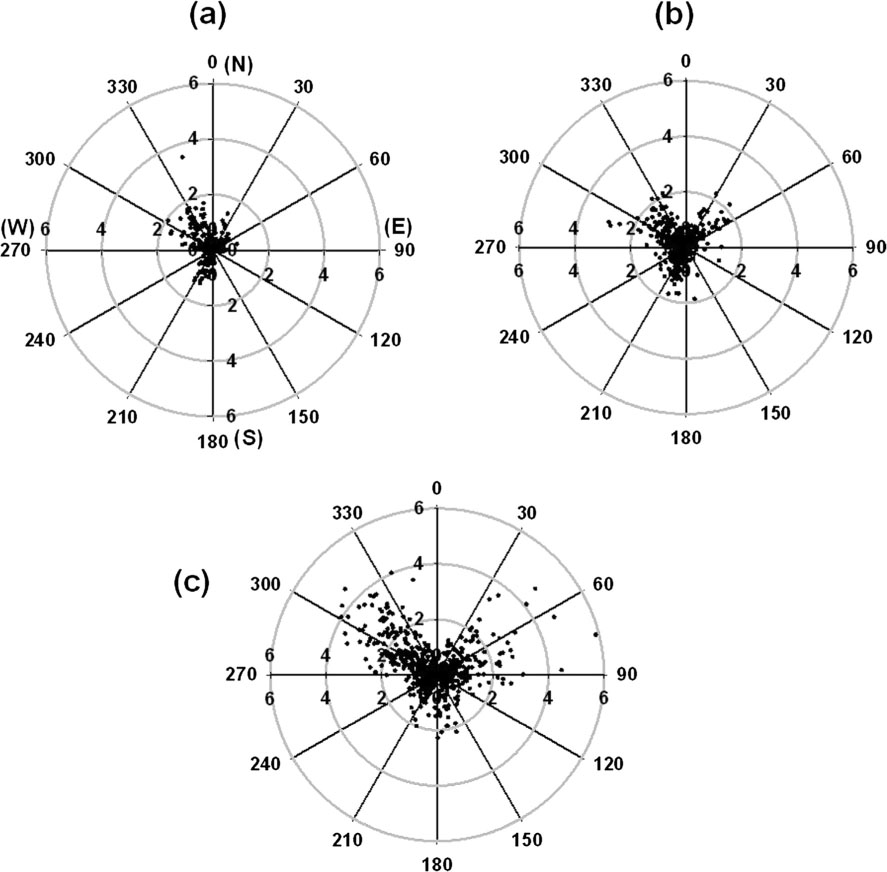
Fig. 5. 

The relationship between 210Pb activities with (a) ambient temperature and (b) wind speed in aerosols at Kanpur during the sampling period. The data for October–November (post-monsoon), winter (December–February) and summer (March–June) are shown separately. The lower temperature and wind-speed are typical of the wintertime conditions due to lower boundary layer height.
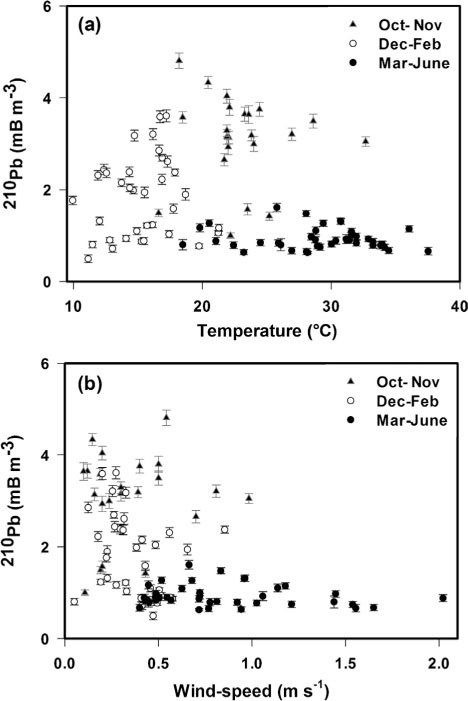
Table 2. The average 210Pb activity in different types of air masses arriving at Kanpur during the sampling period

Air-mass type No. of trajectories Occurrence (%) Wind speed (ms−1)210Pb (mBq m−3) Desert areas 20 40 0.7±0.6 1.3±0.5 Maritime 11 22 0.9±0.4 0.9±0.2 Localised winds 19 38 0.4±0.3 2.5±1.2
Fig. 6. 

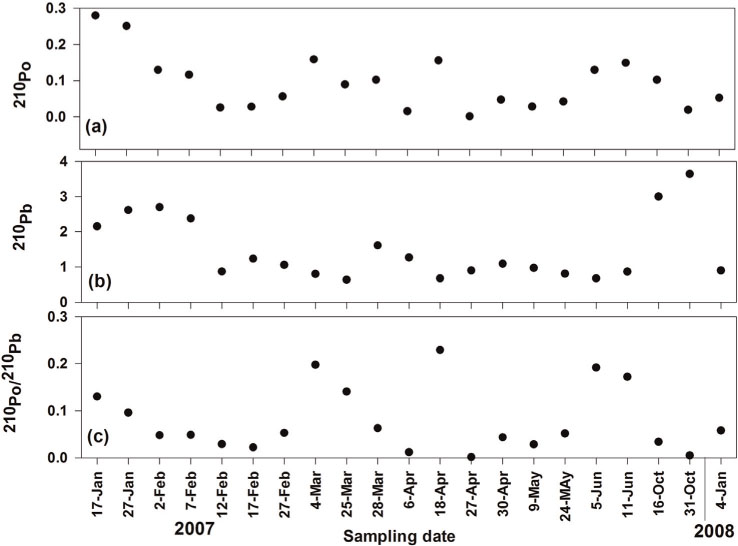
Temporal plot of activities (in mBq m−3) of environmental nuclides: (a) 210Po, (b) 210Pb and (c) 210Po/210Pb activity ratio at the sampling site (Kanpur) in the Indo-Gangetic Plain.
Language: English
Page range: 17513 - 17513
Submitted on: Jun 30, 2011
Published on: Jan 1, 2012
Published by: Stockholm University Press
In partnership with: Paradigm Publishing Services

© 2012 Kirpa Ram, M.m. Sarin, published by Stockholm University Press
This work is licensed under the Creative Commons Attribution 4.0 License.