
Fig. 1.
Systems for turbulent flux observation and ship motion correlation on top of the foremast of the R/V MIRAI, JAMSTEC during the MR08-03 cruise.
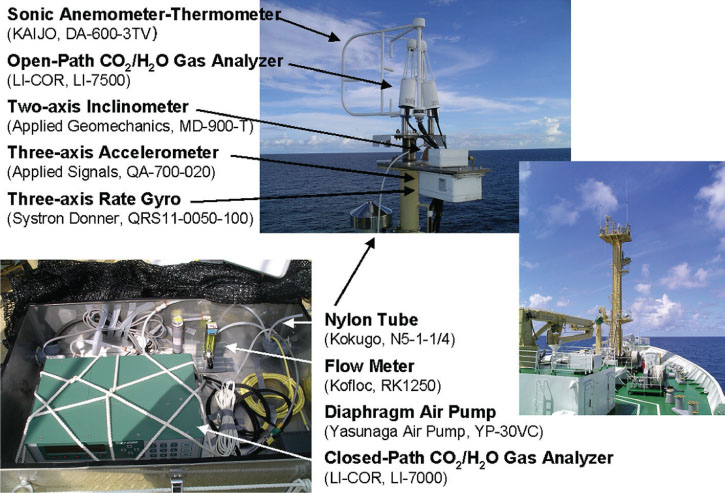
Fig. 2.
Cruise track of the R/V MIRAI during MR08-03. This cruise took place from Guam (3 July 2008) to Sekinehama (6 August 2008), and it performed special observations for the flux measurements by the eddy covariance technique at the four (from A to D) stations.
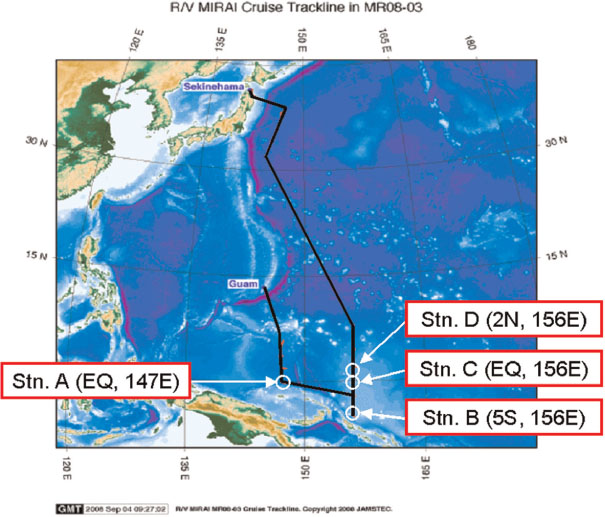
Table 1. Station, position, day time, number (n) of fluxes measured by the eddy covariance technique, and mean values and SDs of wind speed, relative humidity, sea–air temperature difference (ΔT sea–air) and sea–air CO2 fugacity difference (ΔfCO2), during the turbulent flux observation runs performed at the four stations
Fig. 3.
A typical example of the atmospheric turbulent fluctuations for H2O and CO2 densities measured by the OPGA, and the H2O and CO2 densities and mixing ratios measured by the CPGA calculated with eqs. (6), (7) and (8). These fluctuations are plotted as a deviation from the mean value at 10 Hz.
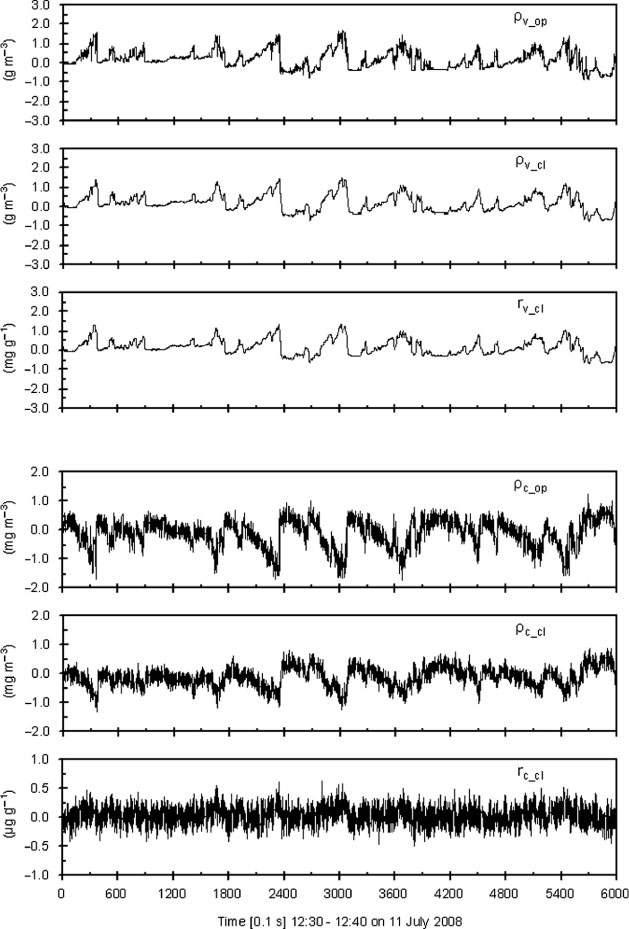
Fig. 4.
A typical example of the normalised power spectra of H2O (left) and CO2 (right) densities fluctuations measured by the open-path [open square (left) and open circle (right)] and closed-path [closed square (left) and closed circle (right)] CO2/H2O gas analysers; normalised power spectra of the sonic temperature fluctuations (cross) measured by the SAT.

Fig. 5.
A typical example of the normalised cospectra of H2O (left) and CO2 (right) fluxes by the OPEC and CPEC as a function of the non-dimensional frequency. Each flux is equivalent to a frequency integral of the cospectrum of each parameter.
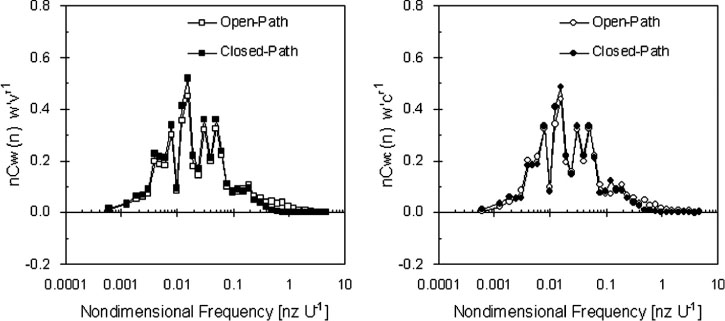
Fig. 6.
Time-series data of raw CO2 flux (Raw, asterisk), the WPL CO2 correction terms for sensible (WPL for SHF, cross) and latent (WPL for LHF, plus) heat fluxes and total CO2 flux by the OPEC [F c(OPEC), open circle], and the CO2 flux by the CPEC [F c(CPEC), closed circle] at station A on 10 July 2008.

Fig. 7.
Point by point comparison of total CO2 flux by the OPEC and CO2 flux by the CPEC measured during all special observation times.
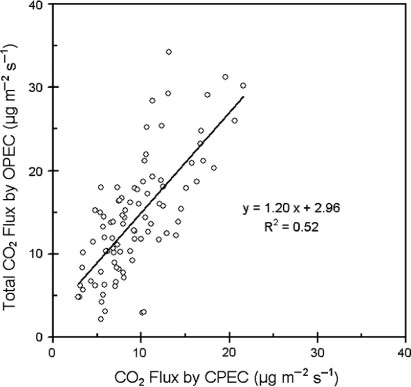
Table 2. Mean values of raw CO2 flux by the OPEC, WPL CO2 correction terms for sensible (WPL for SHF) and latent (WPL for LHF) heat fluxes by the OPEC, and total CO2 flux by the OPEC, the CO2 flux by the CPEC and bulk CO2 flux estimated using the gas transfer velocity proposed by Wanninkhof (1992) during the turbulent flux observation runs performed at the four stations