Fig. 1.
Locations of the CMA and SDZ sites and the topography around them. The contour lines with number indicate the height of terrain; the red-colour shaded areas show the intensity of NO x emission during 2006 from Wu et al. (2011) Wind vectors with blue colour indicate the observations at 15:00 on 10 June 2008, and in black the MM5-simulated data at the same time. The figure on the right shows the diurnal patterns of O x and O3 at SDZ and CMA on 10 June 2008 and the postponement of 3 h of the concentration peaks at SDZ (reproduced with permission from B.Z. Ge).
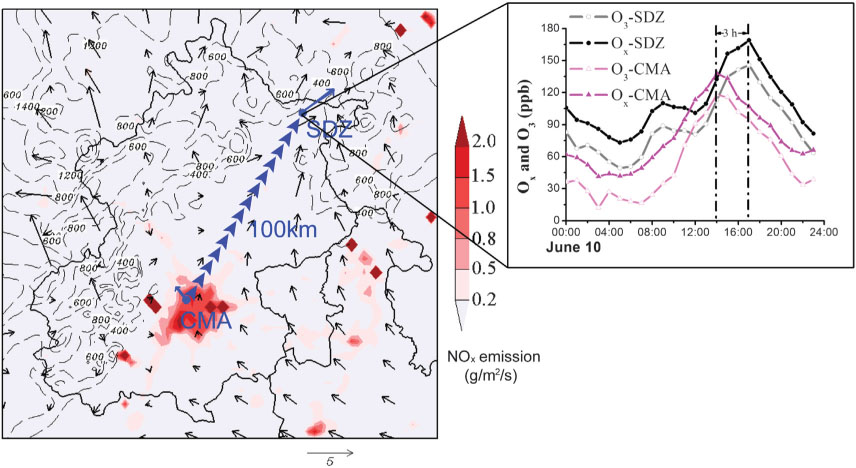
Fig. 2.
Time series of SO2, NO x , NO y , CO, O3 and O x at SDZ and CMA during summer 2008 (reproduced with permission from B.Z. Ge).
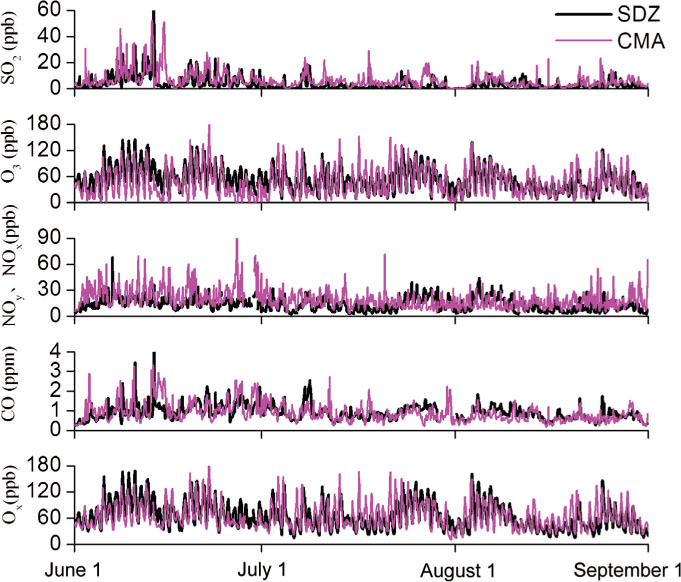
Fig. 3.
Scatter plot of daily amplitude of O x at SDZ and CMA (reproduced with permission from B.Z. Ge).

Table 1. Differences of daily maximal and minimal mixing ratio of O x and O3 between SDZ and CMA during high-ozone days
[i] A: high-ozone days; B: days with peak value of O x , (O3 + NO2) and O3 at SDZ higher than that at CMA; C: days with daily minimal at SDZ higher than CMA among B; D: similar daily amplitude (daily amplitude lower than ±20 ppb) between SDZ and CMA. Fraction O x is the fraction of three scenes in high-ozone days. For comparing, (O3 + NO2) was also calculated at both sites.
Fig. 4.
Average diurnal cycles of CO, SO2, NO x /NO y and O3/O x at SDZ and CMA in summer 2008 (reproduced with permission from B.Z. Ge).

Fig. 5.
Average diurnal cycles of wind vector (a) and the ratio NO x /NO y (b) at SDZ in summer 2008 (reproduced with permission from B.Z. Ge).
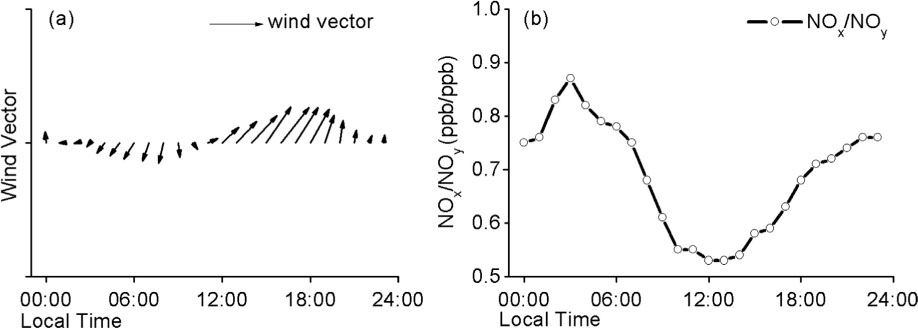
Table 2. The correlation coefficients of the correlations among the trace gas concentrations and meteorological parameters at SDZ and CMA (N = 1946)
[i] All the correlation coefficients are significant at 99% level.aData based on 12 h smooth to minimise the impacts of transport delay for air masses from the urban area to SDZ.
Fig. 6.
Rose distributions of the average concentrations of O3 (a), CO (b), NO x (c) and NO y (d) over summer 2008 at SDZ (reproduced with permission from B.Z. Ge).
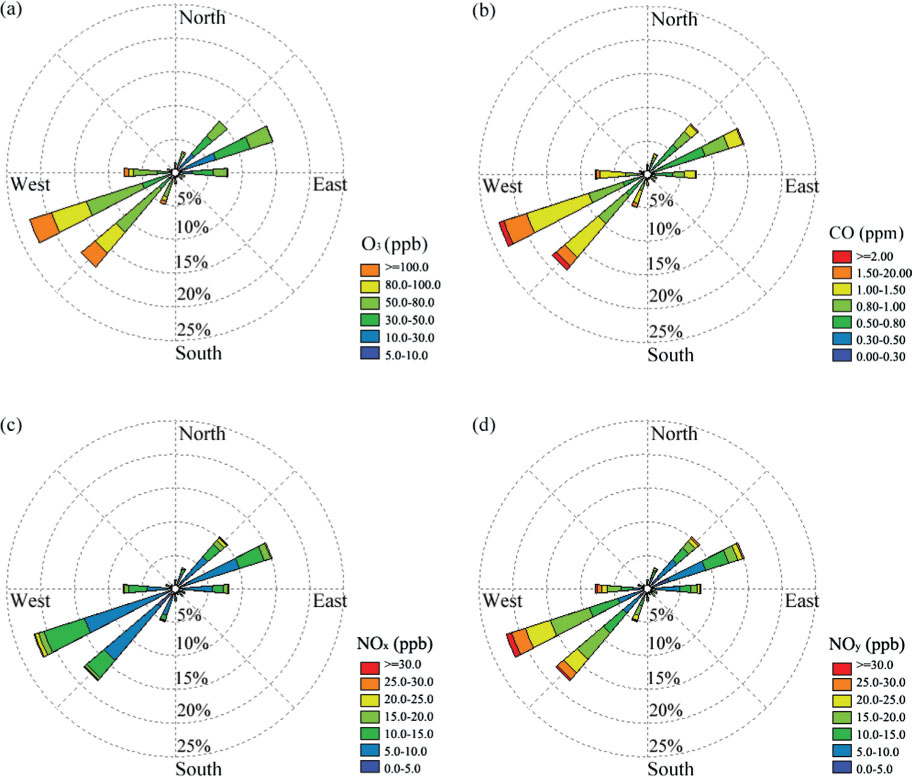
Fig. 7.
The correlation between the daily OPE x and (NO z )/(NO y ). The red-solid points indicate outliers of 27 and 28 July and are not included in the regression. The winds on these 2 days were always from SW with no direction change and hence are not considered as normal conditions (reproduced with permission from B.Z. Ge).
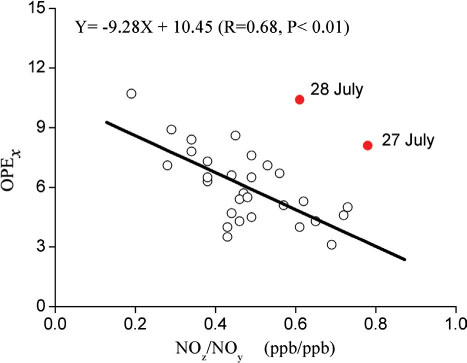
Fig. 8.
Scatter plot of O x versus NO z at SDZ during the summer of 2008. The black points show data under SW wind conditions and the red ones show those under NE wind conditions (reproduced with permission from B.Z. Ge).
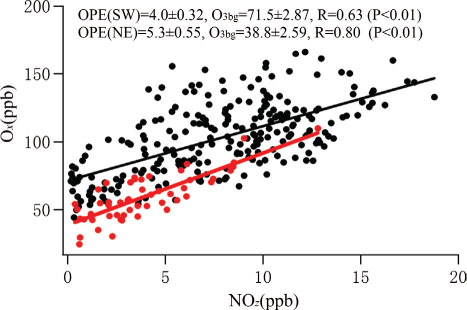
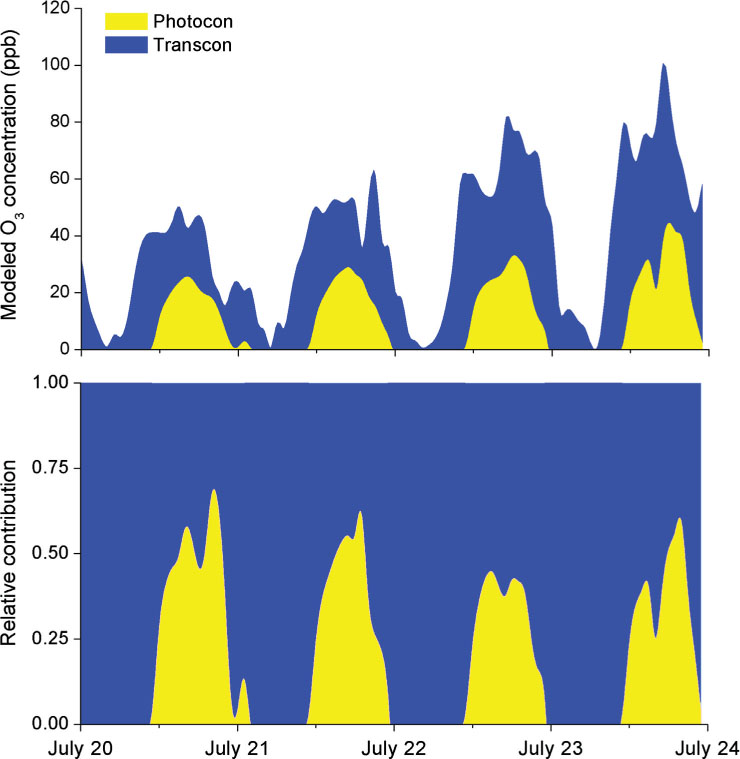
Fig. 9.
The impacts of in-situ photochemistry and urban plume transport on the concentration of O3 at SDZ (a) and the relative contributions of the two factors (b) (reproduced with permission from B.Z. Ge).