Fig. 1.
Exchange type of bubble-mediated transfer velocities as a function of the chemo-physical parameter of gases. The blue curves are calculated based on the bubble spectrum of Deane and Stokes (2002) with a transition at 0.1 cm, and green curves are derived from the spectrum of Monahan and Zeitilow (1969) with a cut off at 0.4 cm. The solid curves are bubble symmetric transfer velocities, k out, multiplied by the Ostwald solubility coefficient, β, and divided by the rate of total bubble volume, Σtot. The dashed curves are the ratio of the asymmetric velocity, , over . The straight black line denotes the slope for a linear function of β. The corresponding chemo-physical parameter values of θ for atmospheric gases CO2, O2, Ar and N2 are marked with arrows. The constant d used for calculating θ is 2/3.
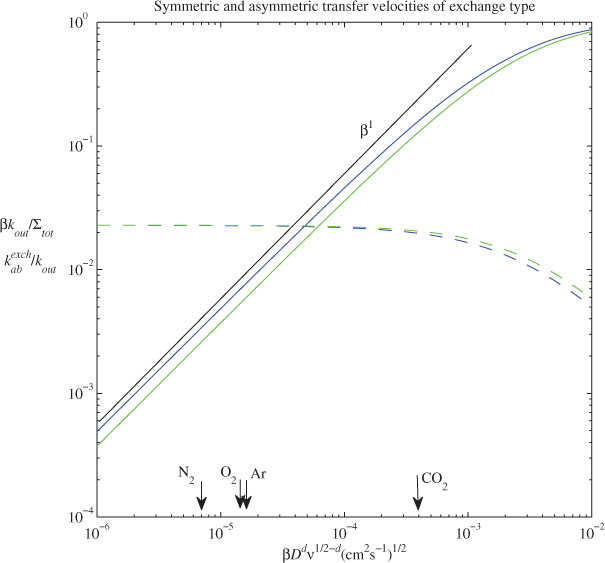
Table 1. Scaling parameters for bubble-mediated transfer velocity ()
[i] aClean bubbles.
[ii] bDirty bubbles.
[iii] cIn the large solubility limit.
[iv] dIn the small solubility limit.
Fig. 2.
Asymmetric transfer velocities, k ab , of SF6, O2, and CO2 at 20 °C vs. 10-m wind speed. k ab is from the regression fitting formula of Asher et al. (1996), Table 3). The laboratory fractional area coverage bubble plume is mapped to the wind speed via eq. (23).
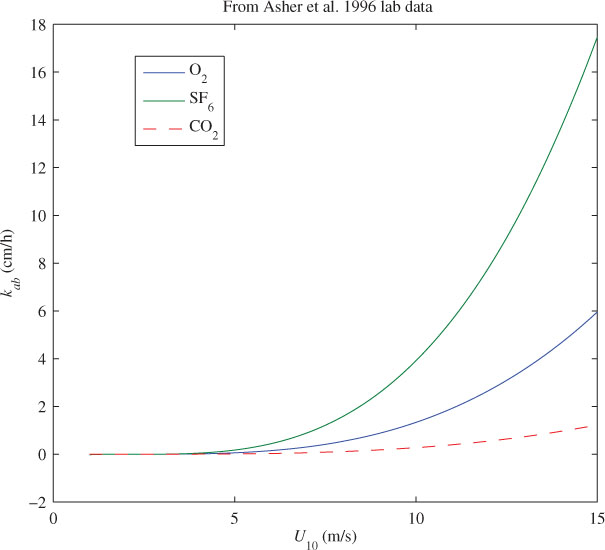
Table 2. Surface supersaturation and asymmetric transfer uptakes
[i] Note: Global CO2 uptake by bubble-mediated asymmetric transfer for a reference year of 1995. The employed models of symmetrical transfer, k s + k out, and bubble-exchange transfer, k out, are indicated by the corresponding symbols’ reference: LM1983 (Liss and Merlivat, 1983), MS1984 (Monahan and Spillane, 1984), W1992 (Wanninkhof, 1992), K1993 (Keeling, 1993), WM1998 (Wanninkhof and McGillis, 1999), AW1998 (Asher and Wanninkhof, 1998), N2000 (Nightingale et al., 2000), M2002 (Monahan, 2002), MG 2001(McGillis et al., 2001), MG2004 (McGillis et al., 2004), Woolf 2005 (Woolf, 1997, 2005; Woolf et al., 2007), and H2006 (Ho et al., 2006).
Fig. 3.
Latitudinal distribution of longitudinally averaged CO2 equilibrium supersaturation in oceanic surface waters. The symmetric transfer velocity, , used for the calculations (both here and in the other figures) is a quadratic parameterisation of wind speed (Wanninkhof, 1992). If cubic forms of are employed, the maximum supersaturation at high latitudes can exceed three times the global mean.
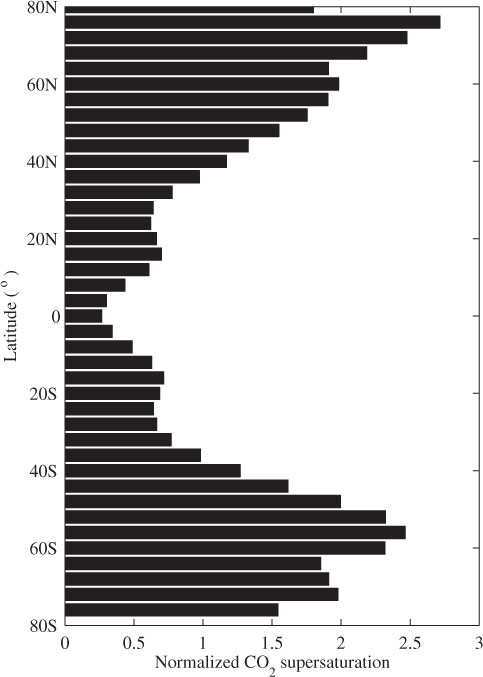
Fig. 4.
Global distribution of bubble-mediated asymmetric CO2 gas flux. The unit of the linear colour scale is the magnitude of mean global flux; a negative sign indicates a CO2 ocean sink. Under the constraint of = 0.08%, the mean global flux due to bubble-mediated transfer is 1.3043 g C m 2 yr−1.
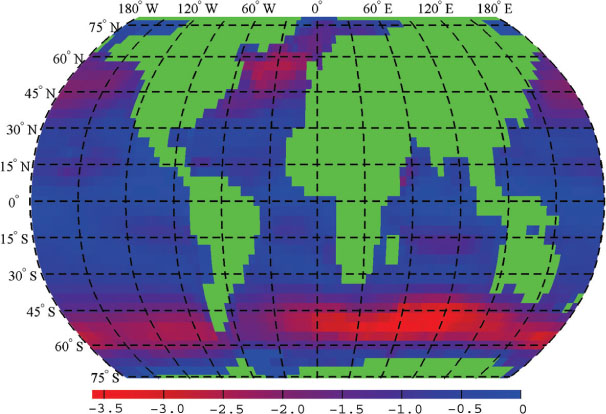
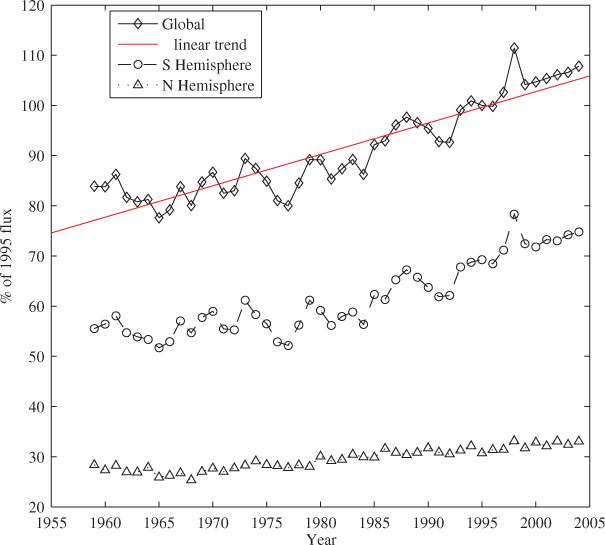
Fig. 5.
Temporal trends in annual ocean CO2 uptake due to the bubble-mediated asymmetric transfer. Diamonds, circles and triangles represent data of the Global, Southern, and Northern Hemispheres, respectively. The linear fit of the global trend is shown by the solid line. This uptake has increased by almost about 40% in the most recent 50-yr span. The data is normalised by the 1995 reference values. The Northern and Southern Hemispheres fluxes represent 30% and 70% of the 1995 total annual global uptake from bubble-mediated asymmetric transfer.