
1. Introduction
Nitrogen (N) loads to European and North American land surfaces approximately doubled between 1960 and 2000, mainly due to the combustion of fossil fuels and the use of N rich fertilisers. [1] Much of this increase occurred in the 1960s and 1970s (Howarth et al., 2002). In Switzerland, towards the end of this period, the trend changed and annual emissions began to decrease significantly between 1985 and 2005. Yet, current N deposition loads are still 60% above the loads observed in the 1960s (SAEFL, 2005). In several regions of Switzerland, atmospheric deposition of N to forests exceeds the critical loads below which no harmful effects for important elements of the ecosystem are expected according to current knowledge (Waldner et al., 2007). Adverse impacts from N saturation include nutrient imbalances that increase tree susceptibility to diseases, pests, drought and frost damage. The typical response of plants to additional NH3 and (NH y ), as well as NO x uptake, is increased plant growth. In an N-limited environment, additional N deposition from the atmosphere has a fertilising effect and increases primary production. In this respect, N pollution can be beneficial to forest growth and thus lead to increased carbon sequestration rates. Magnani et al. (2007), de Vries et al. (2009) and Solberg et al. (2009), for example, showed clear evidence that net carbon sequestration in forests is impacted by N deposition. Their estimates of current N emission rates suggest that atmospheric N deposition may now be influencing a variety of ecosystems.
In parallel with the growing awareness of possible impacts of increasing N deposition on ecosystems, the technical methods to measure these effects have evolved. In particular, the development of chlorophyll fluorescence monitoring has made it relatively easy to investigate photosynthetic performance. Hence, fluorometry has become a powerful and widely used tool in the biological sciences (Maxwell and Johnson, 2000). The principle underlying the use of foliar chlorophyll fluorescence is that light energy absorbed by chlorophyll molecules is either: (1) channelled to plant photosynthetic apparatus reaction centres (PSI and PSII) to drive electron transport and photosynthesis; (2) dissipated as heat via the xanthophyll enzyme–pigment complexes within foliage; or (3) reemitted as light energy (i.e. fluorescence). These processes are complementary; decreased foliar fluorescence may result from greater heat dissipation and/or greater use of absorbed light energy by photosynthesis (Adams and Demmig-Adams, 2004). Fluorometry has been shown to provide a direct and practical measurement of photosynthetic performance and of plant stress across a wide range of environmental conditions. Given that sustained depressions in photosynthetic efficiency (PE) – the quantum efficiency when all reaction centres are open – are indicative of plant stress, these measurements have played an important role in a limited number of air pollution–plant impact studies.
A Norwegian air pollution study by Odasz-Albrigtsen et al. (2000) showed that both Fv/Fm and (two measurements of photosynthetic performance, see Section 2.3) were negatively correlated with airborne concentrations of Cu, Ni and SO2, demonstrating the ability to quantify field-measured ecophysiological responses of plants as a function of the level of airborne pollutant concentrations. In addition, the study showed that PE measurements can provide an early warning of plant stress, well before the occurrence of visible foliar damage. In northern Sweden, exposure of Scots pine to low levels of SO2 and NO2 during the growing season led to reduced wintertime values of Fv/Fm, indicating reduced photosynthetic performance and suggesting prolonged stress (Strand, 1993).
Additionally, photosynthetic responses from increased anthropogenic N deposition have been observed in the Rocky Mountains of the western USA. Fluorometry and gas-exchange measurements at the Niwot Ridge Long-Term Ecological Research subalpine forest site (Niwot forest) show increased photosynthesis in response to N deposition (Sievering et al., 2007). N deposition at the Niwot forest is relatively low (4–8 kg N ha−1 yr−1) and forest growth is considered limited by N availability. In N-limited forest ecosystems, increased N availability is known to stimulate photosynthesis, which increases carbon sequestration rates (Aber et al., 1998; Sievering et al., 2000, 2007; Sievering, 2001; de Vries et al., 2009). Thus, understanding the mechanisms by which N is taken up by forests and utilised in photosynthesis is relevant to carbon sequestration and global climate change research. Although N deposition is generally considered to enter vegetation via the roots and soil pathway, there is strong evidence that many forest canopies, especially conifer forests canopies, take up N directly. At the Niwot forest, canopy N uptake (CNU) of primarily anthropogenic N deposition is highly efficient; 80–85% resulting in CNU of 2–3 kg N ha−1 per growing season (Tomaszewski et al., 2003). Canopy uptake and assimilation of atmospherically deposited N by foliage has a positive influence on PE and net ecosystem CO2 exchange at the Niwot forest (Sievering, 1999; Sievering et al., 2007; Tomaszewski and Sievering, 2007). This forest's moderate N deposition and CNU rates resulted in physiological responses that were detectable by fluorometry. Thus, fluorometry is potentially a robust method for assessing photosynthetic response to N deposition at forests.
Many N fertilisation experiments add N directly to the soil and forest floor, neglecting the effects of N deposition on the forest canopy. Studies have shown that CNU can account for up to 80% of N deposition and as much as 1/3 of the total N required during a growing season (Gaige et al., 2007; Sievering et al., 2007). Another study by Chiwa et al. (2004) found that almost all of the canopy mist applied and was absorbed by the canopy in low N treatments, with 30–35% absorption in high N treatments. When N is applied directly to the canopy foliage, it becomes immediately available to promote photosynthesis and thereby leads to an increase in gross primary production (GPP). N amendments that are directly applied to the soil are at increased risk for leaching out of the soil or as a nutrient source for soil microbes. Dezi et al. (2010) found a positive relationship between net ecosystem production and N deposition that was mediated by CNU. A canopy-applied N approach was used in this research to better model the impacts of atmospheric N deposition. Additionally, an artificial solution comprising amended N with the common constituents of natural precipitation was appropriate for use in this study because there was twice as much wet N deposition as dry N deposition at Novaggio.
Forests that receive high atmospheric N deposition (e.g. many Swiss locations, especially downwind of populated and industrialised areas, or areas with high cattle density; Eugster et al., 1998) may experience negative impacts of atmospheric N deposition on photosynthesis. The Novaggio oak forest and Lägeren beech-spruce forest within the Swiss Long-Term Forest Ecosystem Research (LWF) network are high N deposition sites that receive from 25 to 40 kg N ha−1 yr−1 (Thimonier et al., 2005) and 19–37 kg N ha−1 yr−1 (Burkard et al., 2003; Flechard et al., 2011), respectively. The Institute of Agricultural Sciences of ETH Zurich and the Swiss Federal Institute for Forest, Snow, and Landscape Research (WSL) provided access to tree canopies at both forests for the measurement of fluorometry, especially PE, parameters.
The purpose of this study was to:
use fluorometry measures to determine the effect of experimental forest canopy N amendment on foliar scale PE and other fluorometry parameters at Swiss forests exposed to high atmospheric N deposition;
use a canopy-applied N approach to consider CNU and total N deposition for the assessment of high N deposition influences on PE; and
discuss the potential for the impact of responses in PE due to changes in N deposition upon potential forest carbon sequestration rates.
2. Materials and methods
2.1. Study sites
To complement the low N deposition Rocky Mountains Niwot subalpine forest fluorometry study, two high N deposition LWF sites were selected for further study. Both receive annual N deposition>15 kg N ha−1 yr−1. One is the Novaggio Forest site (46°01′21.4″N, 8°50′03.0″E), an ICP-Forests level II site of the Swiss Federal Institute for Forest, Snow and Landscape Research (WSL) located 12 km west of Lugano at 950 m asl. Wet deposition of is in the range 9–16 kg N ha−1 yr−1 with dry deposition being about 3–6 kg N ha−1 yr−1. Wet deposition of is in the range of 8–13 kg N ha−1 yr−1 with dry deposition being about 4–8 kg N ha−1 yr−1. The overall ratio of wet to dry N deposition is 2–2.5. Total N deposition over the past decade (1997–2007) has ranged from a low of 24 to a high of 43 kg N ha−1 yr−1 or about 25–40 kg N ha−1 yr−1 (Thimonier et al., 2005). Vegetation cover at the Novaggio Forest is dominated by oak (Quercus cerris and Quercus pubescens), chestnut (Castanea sativa) and birch (Betula pendula) trees.
The second site is the Lägeren Forest (47°28′42.0″N, 8°21′51.8″E) of the Swiss National Air Quality Network (NABEL), located 15 km northwest of Zurich at 682 m asl, having annual N deposition in the order of 19–37 kg N ha−1 yr−1 (Burkard et al., 2003; Flechard et al., 2011). Since fog deposition is important at the Lägeren Forest, total N deposition is probably more variable than at the Novaggio site due to the huge interannual variability in fog frequencies at the site. Vegetation cover is mixed forest dominated by beech (Fagus sylvatica) and Norway spruce (Picea abies) (Eugster et al., 2007; Ahrends et al., 2008).
2.2. Leaf or shoot selection; N treatment and control application
Five oak trees, at Novaggio, and four each of beech and spruce trees, at Lägeren, were chosen for N amendment applications. Upper canopy branches were accessible from either platform (Novaggio) or ladders (Lägeren). Three leaves or three second- and third-year-old growth spruce shoots from fully exposed sunlit branches were selected for fluorescence measurements during the sample period. Branches, leaves and shoots had similar light environments to assure that any differences in observed fluorescence sampling was due to the different treatments given to the branches rather than the light environment (Tomaszewski and Sievering, 2007). Fluorometry measurements were obtained from the initial selected foliage on each sample date to observe the effect of the treatment solution across the duration of the sample period.
Branch treatments were as follows. Each tree had one N branch (N treatment), which received and ions in a concentration two times above their mean concentrations in site precipitation along with an ion matrix solution of Ca2+, Mg2+, Na+, K+, Cl−, that was representative of these ions’ mean concentrations in site precipitation. A control branch (control) on each tree received only the ion matrix solution (no N). 15N was also added to the N treatment solution in order to assess the uptake of the amended N by leaves or needles at the end of the growing season. The treatment solutions at Lägeren were spray applied on the sample date until saturation was observed by the onset of dripping. At Novaggio, to improve leaf uptake of amended N, control and N treatment solutions were applied on the sample date to oak leaves using a soft paintbrush until surface saturation was observed. The application of amended N and control solutions occurred over a 3-month (late May through late August) period in 2007 at Lägeren and over a one-and-half month (late June through early August) period at Novaggio in 2008.
2.3. Chlorophyll fluorometry
A PAM-2100 (Heinz Walz GmbH Effeltrich, Germany), portable chlorophyll fluorometer was used for all fluorescence measurements. At both forests, high-light and dark-adapted fluorescence measurements were both obtained from the same leaf or fascicle. For the purposes of this study, high light was identified to be present when photosynthetically active radiation (PAR) was>1000 µmol m−2 s−1 while dark-adapted measurements were taken at PAR values<10 µmol m−2 s−1 (black cloth cover for ≥ 30 min). From these measurements, PE (Fv/Fm and ) values, as well as other fluorometry parameters, were determined as the means of three leaves or three fascicles. In 2008, fluorometry data were obtained from the Novaggio oak trees from late June through early August. At Lägeren, data collection was performed from May through August in 2007.
2.4. Fluorometry calculations; daily depression of PE, DDPE
Daytime, high-light fluorescence measurements provide a measure of: (1) a plant's maximum fluorescence (); and (2) its minimum fluorescence () where primes indicate measurements performed in the high-light of any one day. In contrast, dark-adapted measurements of: (3) a plant's maximum fluorescence, Fm; and (4) its minimum fluorescence, Fo, provide a measure of chlorophyll fluorescence under conditions of very low to no photosynthetic activity. Two widely used indicators of photosynthetic performance can be determined using , , Fm, and Fo chlorophyll fluorescence data. The potential (also maximum) PE is given by [Fm − Fo]/Fm=Fv/Fm and obtained in the dark-adapted state. Most plant species are known to have an optimal value of Fv/Fm in the 0.80–0.83 range (Maxwell and Johnson, 2000). The high-light (also effective) PE, , is, generally, obtained for well exposed foliage (PAR > 1000 µmol m−2 s−1).
Changes in the capacity for photosynthesis resulting from differential variables, here for N, can be assessed by changes in PE obtained through fluorometry measurements. The potential (maximum) observed PE on any one day in the dark-adapted state (daily max Fv/Fm) may be obtained along with high-light (effective) measurement. values on any one day are often substantially depressed relative to dark-adapted maximum values. A relative daily depression of PE, DDPE, comparing values for N treatment vs. control measurements may be determined as:

In this experiment, leaves or needles selected for fluorescence sampling from each experimental branch provided a comparison of daily N-treated and control foliage DDPE values. DDPE [eq. (1)] provides relative PE depression values for easy to interpret comparisons in experimental settings and may also allow for cross comparison of fluorometry results across a range of species since it is a normalising calculation that yields relative change.
Other parameters obtained from fluorometry analysis in high light conditions include yield, NPQ, qN, and qP (Table 1). Yield is a measure of the light absorbed and used for photosynthesis and is an indication of overall PE (Maxwell and Johnson, 2000). NPQ and qN are both measures of the amount of non-photochemical quenching, energy that is dissipated as heat. The values for NPQ usually fall within the range of 0.5–3.5 (Maxwell and Johnson, 2000). The range for the parameter qN usually varies from about 0.3 to 0.7 (Ritchie, 2006). Another parameter, qP, describes the amount of energy used to drive photosynthesis: i.e. photochemical quenching. qP normally falls in the range of 0.7 and 0.8 (Ritchie, 2006). Variation outside the normal range of these parameters indicates below optimum levels of photosynthesis.
Table 1. Daily mean fluorometry and photosynthetic performance data at Novaggio oak forest in 2008 for N-treated foliage and control foliage. The daily means were calculated from all trees in each treatment group. Paired t-test results between the treatment groups were significant at p<0.05. Standard deviations (SD) for the daily mean values and the N treatment vs. control treatment ratios are also shown
Statistical analysis was performed using Statgraphics Plus 5.0 and Kaleidagraph 4.0. The daily mean value across the five tree replications was calculated for each treatment for each sample date. Given that daily mean values were confirmed to be normally distributed (standardised skewness and kurtosis) and homoscedastic (Bartletts and Levenes tests), paired sample t-tests were performed on the daily means for each treatment group.
2.5. Foliar analyses
At the end of the growing seasons, foliar analyses were conducted. Treated leaves or needles of the N-treated branch, the control, and a branch associated or close to the N-treated branch were sampled, slightly washed (dipped) with deionised water, dried until the mass was constant, and ground for 3 min using a vibrating ball mill (Retsch MM2000) with zircon-grinding tools (ultraCLAVE of MLS Milestone, Sorisole, Italy). Concentrations of carbon and N were determined with a CN-Analyser (NA 2500, CE Instruments, Wigan, UK). A number of elements, including K, Mg and P, were determined with inductively coupled plasma atomic emission spectrometry (ICP-AES) (Optima 3000, Perkin Elmer, MA, USA). Finally, 15N abundance was determined with an isotope ratio mass spectrometer (Delta V Advantage, Thermo, Germany). Tracer fractions (the ratio of N from amendment to total N) in leaves were calculated according to Providoli et al. (2005) based on 15N abundance measurements.
2.6. Litterfall
At Novaggio, litterfall was collected at 4-week intervals using 10 traps (each with a surface area of 0.25 m2), dried at 65 °C for 48 h, sorted into components such as leaves, fruits and wood and then weighed. The sum of leaf litterfall between March and February of the subsequent year was used as a proxy for the forest's foliar production. The N content of tree foliage at the Novaggio stand, m LN (kg ha−1), was estimated by m LN=m LL C LN, where m LL (kg ha−1) is the March to February leaf mass in litterfall and C LN (mg g−1) is the mean N content of control branch sampled leaves.
2.7. Precipitation, deposition and canopy uptake
Precipitation amount was measured hourly with unheated and heated tipping buckets at the Novaggio and Lägeren sites, respectively. In Novaggio, in the 2008 growing season of measurements, precipitation was 30% higher than the 10 yr average. For the April–August portion of the growing season that is most relevant to fluorometry measurements (completed near the end of August), the precipitation amount was 1281 mm in 2008, which is 49% greater than in 2007 and 30% greater than the 1997–2009 average. Bergh et al. (1999) found that volume growth in fertilised forest stands that were irrigated was 50% higher than fertilised stands that were not irrigated. The substantial increase in 2008 vs. 2007 precipitation may be important to the overall water status at the Novaggio oak forest and, thus, to fluorometry measurement results.
Soil water availability was measured biweekly with ceramic cup tensiometers installed at 15, 30, 50, 80 and 120 cm depths (eight replications) on the intensive monitoring plot at the Novaggio site (Graf Pannatier et al., 2011). During the Novaggio measurement campaign in 2008, soil water availability remained always high. Biweekly soil suction cup measurements showed soil water matrix potential values always above −50 hPa in all depths until early August. In comparison, matrix potential in 2007 was lower in May (−100 to −200 hPa) and recovered in June but then dropped down to −400 to −800 hPa in July until mid-August.
At the Novaggio site, the total atmospheric deposition of N was measured using measurements of bulk and throughfall deposition, in combination with one of the available canopy budget models (EC-UN/ECE, 2001, also described by Thimonier et al., 2005). Bulk deposition and throughfall deposition were collected biweekly with 3 and 16 samplers, respectively (Thimonier et al., 2005). Total deposition and CNU were derived from these measurements by applying a canopy budget model to deposition values per sampling interval (rather than to annual deposition values, as is usually done). The model applied in this study assumes that canopy uptake of and H+ is balanced by the canopy leaching of Ca2 +, Mg2+ and K+. Leaching of weak acids was not taken into consideration. Further, this model assumes that has an exchange efficiency six times larger than .
3. Results and discussion
3.1. Novaggio N deposition, CNU and foliar analysis
Although higher N deposition has been measured at forest sites in other monitoring networks, the Novaggio site has the highest recorded N deposition within the LWF network in Switzerland (Thimonier et al., 2005). Modelled deposition maps from historical studies (Rihm, 1996) also confirm that there are few other locations in Switzerland with higher potential deposition. Despite the very large 25–40 kg N ha−1 yr−1 magnitudes of total N deposition, the uptake of N by the oak forest canopy at Novaggio has been estimated to be substantial (Thimonier et al., 2005). Therefore, further CNU at Novaggio does not appear to be saturated by the high deposition rates. From 1997 to 2007, the canopy budget model (without weak acid consideration) calculated a CNU magnitude of 7.5±2.3 (mean±SE) kg N ha−1 yr−1, with 75–85% resulting from exchange. Canopy retention of N, CNU, at the Novaggio forest was 20–25% of Novaggio's 33 kg N ha−1 yr−1 1997–2007 mean total N deposition. The EC-UN/ECE (2001) canopy budget model, with and without correction for weak acids, provides another estimate of total N deposition of about 25 kg N ha−1 yr−1, with CNU being ~6 kg N ha−1 yr−1 of that. During the sampling period of 2008, total N deposition was approximately 30–35 kg N ha−1 yr−1 (depending on the model) with CNU ~9 kg N ha−1 yr−1. Thus, the various CNU estimates provide a representative range for CNU of 6–9 kg N ha−1 yr−1.
Leaf level PE, yield, NPQ and other influences that may be due to canopy N applications at the Novaggio forest must be viewed in the context of N treatment uptake estimates for the N-treated oak leaves. Elemental analysis of leaves (see Section 2.5) collected near the end of the growing season yielded mean N concentration of 2.11% (N-treated leaves) and 2.12% (control leaves). The variability among trees in these results is greater than the differences between N-treated and control leaves. However, leaf 15N data do indicate there was amended N uptake by oak leaf tissue. The tracer fraction (i.e. the molar ratio of tracer N to total N) in N-treated Novaggio leaves was small but significant, 0.44% on average.
Based on Novaggio leaf litterfall mass measurements of 4250 kg/ha and on a foliar N concentration of approximately 2%, the additional leaf uptake due to N treatment application was 0.39 kg N ha−1. This is a small percentage of the canopy budget model estimated CNU loadings for 2008. However, the N treatments were only applied across 2 months; CNU, during the growing season, is generally<1 kg N ha−1 month−1. The N treatment represents roughly 20–30% of the late June through early August modelled CNU at Novaggio. Thus, N treatments at Novaggio in 2008 were moderate: below a possibly excessive 100%, yet greater than 5% of natural canopy N uptake amounts. Leaves from branches adjacent to those branches having N-treated leaves were also analysed for their 15N abundance. Their tracer fraction was barely (0.016±0.010%) above the control and roughly 30 times lower than that in the N-treated branches themselves. The 15N translocation was not quantified because the analysis did not measure into which amount of biomass the 15N was retranslocated. This indicates, although it is difficult to accurately estimate, that there was only a very minor tracer dilution due to N translocation among branches.
3.2. Novaggio photosynthetic parameters
Decades of persistently high N deposition and CNU at Novaggio may be impacting plant physiological processes. Experiments to consider the influence of N deposition alone on Novaggio forest growth have not been previously undertaken. The N application approach, described above in Section 2.2, was used to address this concern. Higher values of Fv/Fm for N-amended leaves would suggest higher PE due to the added N supply. Table 1 shows mean Fv/Fm and values for the leaves of all five oak trees for each sample date considered at the Novaggio site for the 2008 (late June to early August) fluorometry measurement period. High statistical confidence (95% confidence level) in the difference between fluorometry results among the daily mean values from N-treated and control leaves was generally found: e.g. at Novaggio in 2008, N-treated oak leaves had higher Fv/Fm, and yield relative to control leaves and the parameters qN, NPQ and qP were significantly lower for the N-treated leaves than the control leaves, all at the 95% confidence level.
The daily mean values of Fv/Fm for N-treated leaves were on average 1.1% greater than that for control leaves while the daily mean values of for N-treated leaves were on average 11% greater than that for control leaves, indicating N treatment improved the PE of oak leaves at Novaggio. In this study, the mean Fv/Fm value was 0.747 and 0.737 for the N and control treatment group, respectively (Table 1). Since Fv/Fm values at non-stressed sites are consistent at 0.83 (Maxwell and Johnson, 2000; Baker, 2008), the data indicate a strained environment at Novaggio.
N uptake also influenced the other photosynthetic parameters yield, NPQ, qN and qP. The quantum yield of the PSII component in the photosynthesis, here yield, measures the proportion of light absorbed by leaf PSII associated chlorophyll that is used in photochemistry. Typical values for non-stressed leaves are 0.4–0.6, while stressed leaves may have values as low as 0.1 (Ritchie, 2006). Table 1 also presents the daily mean yield, NPQ, qN and qP values. All of the fluorometry parameters’ N-treated leaves and control leaves daily mean differences were significant at p<0.05. The mean N:control ratios for yield and NPQ are 1.06 and 0.83, respectively (significant at p<0.01). The lower 0.27 (N treatment) and 0.26 (control) mean values for yield vs. more usual forest leaf values indicate that the proportion of absorbed light used in photochemistry at this oak forest is fairly low. The mean NPQ of 1.46 for N-treated leaves vs. 1.69 for control leaves shows that, partly as a result of the lower proportion of light used by control leaves vs. N-treated leaves (yield values), a higher rate of leaf heat dissipation was prevalent for control oak leaves than for N-treated oak leaves. The improvement in NPQ due to N treatments at Novaggio oak trees was greater than that during 3 yr of experimentation at spruce trees in the Rocky Mountains due to similar N treatment applications (Tomaszewski and Sievering, 2007).
Additionally, qN values of 0.726 (N treatment) and 0.779 (control) for both treatments were higher than the broad normal range of 0.3–0.7. Stressed plants have the ability to recover; obtaining fluorometry measurements over the course of several days or weeks are therefore beneficial for drawing conclusions about the state of stress. If Fv/Fm remains low and qN high for several days, then significant damage to the photosynthetic system may have occurred (Ritchie, 2006). Overall, the qP values of 0.57 (N treatment) and 0.59 (control) fell below their expected range of 0.7–0.8, suggesting less than optimal energy was used to drive photosynthesis. An N treatment mean qP value lower than that for the control treatment suggests that the additional input of N reduced photosynthesis. However, qP is a relatively fixed property that changes only slowly in response to light adaptation while qN is plastic and adjusts rapidly as stress increases or decreases (Ritchie, 2006). This offers the possible explanation that qP is not as sensitive of an indicator to environmental variables as are yield, NPQ and qN during a short duration experiment such as this one.
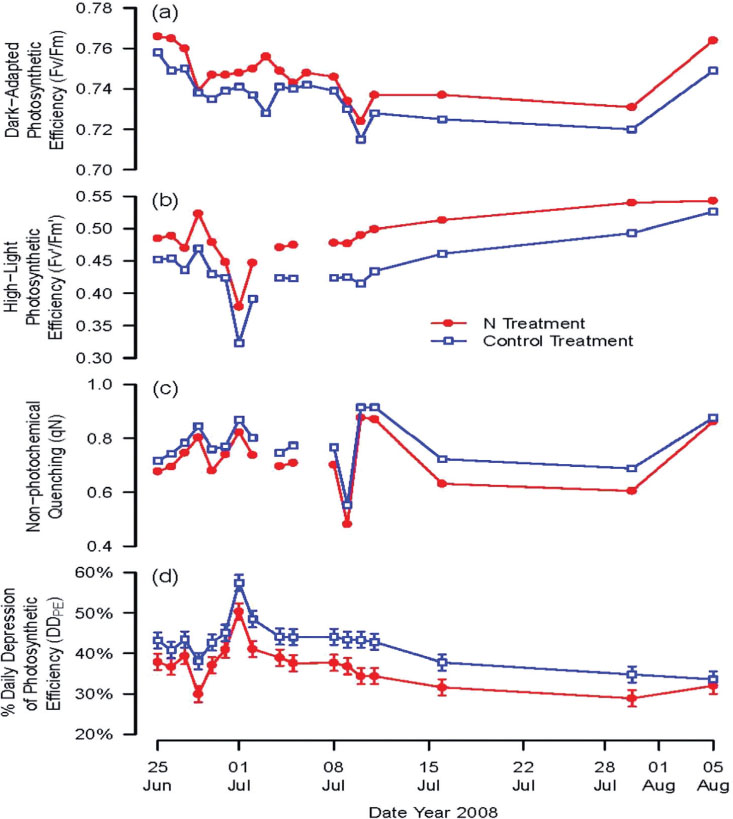
Figure 1(a–c) illustrate the variation in Fv/Fm, and qN for N and control treatments over the duration of the experiment. As seen in Fig. 1(a and b), the overall PE varied from day to day. However, the difference between the PE in N and control treatments remained constant over the duration of the experiment. Gaige et al. (2007) concluded that canopy-dissolved organic N formation is a rapid process due to recent N inputs in the canopy. Despite the above average precipitation during the sampling campaign, the overall increase in PE due to N application at Novaggio supports this finding. Figure 1(c) also displays a constant difference among treatments for the parameter qN. Although there was a significant difference between the N and control treatments, the large fluctuation in the parameter values is likely due to field conditions as opposed to N and control treatments. In a closed-experiment setting, one might expect a steady increase or decrease in values as the experiment progressed and the cumulative impact of multiple N-applications altered plant physiology. However, environmental conditions also strongly affect photosynthesis as shown by variability in the data. Although the results are highly variable, the relatively constant significant difference of photosynthetic parameters between the control and N treatments suggests a response to the application of N.
Fig. 1.
(a) Dark-adapted photosynthetic efficiency (Fv/Fm) fluorometry values for N and control treatments at Novaggio oak forest in 2008. (b) High-light photosynthetic efficiency () fluorometry values for N and control treatments at Novaggio oak forest in 2008. (c) Non-photochemical quenching (qN) fluorometry values for N and control treatments at Novaggio oak forest in 2008. (d) Daily depression of photosynthetic efficiency,% DDPE, for N-amended leaves and control leaves at Novaggio oak forest vs. 2008 sampling date. Bars are the 95% confidence intervals at each data point.
No clear Fv/Fm dependence on leaf temperature was found (r 2=0.14) during the 2008 sampling campaign at Novaggio. This suggests that temperature conditions alone did not affect PE. Yet, Fv/Fm values were always <0.8 with a mean of 0.74 vs. typical unstressed deciduous tree leaf values of ≥0.8 (Maxwell and Johnson, 2000). Since values <0.8 have often been argued to indicate stress, PE in Novaggio oak trees was likely strained during the growing season of 2008; the forest as a whole may have been similarly impacted. It is not possible, using Fv/Fm values alone, to identify specific factors that may be contributing to the below optimum photosynthesis. Potential candidate stressors include ozone, pathogens and nutritional status, among others.
3.3. Daily depression of PE at Novaggio
The DDPE parameter, relative daily depression of PE [eq. (1)], may be more sensitive to differences between N-treated and control leaves’ fluorometry results than other fluorometry parameters. DDPE accounts for differences between the single largest Fv/Fm observed on any one day across all sampled leaves, as well as differences in for N-treated leaves and control leaves. It is also a sensitive, yet easy to interpret PE parameter since it considers relative differences. The mean DDPE value in Table 2 for N-treated leaves, DDPE(N), is 36.8% while that for control leaves, DDPE(control), is 42.8%. The lower DDPE(N) vs. DDPE(control) suggests a positive influence of CNU on photosynthesis at Novaggio oak trees. That is, experimentally amended CNU reduced the daily depression of PE in N-treated leaves relative to the background CNU impact in control leaves.
Table 2. Mean daily depression of photosynthetic efficiency (DDPE) data for the Novaggio oak forests. DDPE values shown were calculated using the daily maximum Fv/Fm leaf mean among the five tree branches
Figure 1(d) shows the DDPE values for N and control leaves over the sampling period. Note that DDPE(N) is significantly reduced vs. DDPE(control) on all days except the last, 5 August 2008. N amendment in the canopy of Novaggio oak trees, amended CNU, substantially reduced the daily depression of PE in these oak trees. The reduced daily depression of PE indicates that increased CNU at Novaggio had a positive effect on photosynthesis, thereby increasing primary production at the foliar level. The potential for enhanced PE from increased N input at Novaggio may have resulted in amplified primary productivity and therefore possibly increased the capacity for carbon storage rates.
3.4. Lägeren
N deposition at Lägeren is a combination of wet, dry and fog deposition. Burkard et al. (2003) estimate fog N deposition to be 4–7 kg N ha−1 yr−1 with wet deposition being somewhat larger at 6–9 kg N ha−1 yr−1. More recent estimates based on active denuder concentration measurements by Flechard et al. (2011) indicate dry deposition (gaseous N species and particles: NH3, HNO3, NO2, and ) on the order of 8.4–21.0 kg N ha−1 yr−1, depending on the atmospheric deposition model used. Hence total N deposition using the Flechard et al. (2011) values may range between 19 and 37 kg N ha−1 yr−1, which is only slightly less than at Novaggio. Our expectation is that PE at both beech and spruce trees may be impacted due to N deposition.
Fluorometry sampling at the Lägeren site was complicated by the presence of many overcast days and precipitation events during the growing season of 2007. Although the majority of the site precipitation is normally received during the summer months, more than twice the climatological mean precipitation events occurred in the May through August period of 2007 and overcast conditions prevailed on more than half the days that sampling was undertaken. This often precluded obtaining high-light data and, due to foliage being wet, also precluded obtaining dark-adapted data on occasion. Table 3 shows the PE data obtained at Lägeren.
Table 3. Daily mean photosynthetic efficiency (PE) data at Lägeren beech and spruce forests in 2007 for N-treated foliage and for control foliage
Fv/Fm values across the sampling campaign at Lägeren may be compared with Fv/Fm for Novaggio oak control leaves of 0.74. Mean Lägeren Fv/Fm was 0.72 (±0.01) for beech control leaves and 0.76 (±0.01) for spruce control needles. One might argue that spruce trees were less strained than the beech or oak trees. Yet, these data do not allow for any declaration about N deposition impacts on stress characteristics at the Lägeren forest. The consideration of N-treated foliage vs. control foliage results is, again, necessary. Water shortage was not a contributor to Lägeren beech and spruce Fv/Fm of less than 0.8, since 2007 precipitation during May–August was 662 mm vs. the climatological mean of 431 mm (MeteoSwiss rain gauge, 2.5 km away from Lägeren).
The mean difference between N-treated leaves’ and control leaves’ daily mean Fv/Fm for beech is an insignificant 0.02. Given the for N-treated leaves of 0.319 vs. that for control leaves of 0.378, the difference of 0.06 indicates a trend, although it is not significant (p<0.11). The trend suggests a detrimental influence on PE due to N-application at beech leaves. Considering uncertainty, Fv/Fm is reduced by about 2–4% and is reduced by about 12–20%. No clear trend in PE influence can be discerned due to N-application at spruce needles. Clearly, the sparse Lägeren fluorometry data collection due to unusually and highly adverse weather conditions limits the statistical power of the Lägeren results.
3.5. N Amendment, photosynthetic apparatus, carbon storage, pathogen susceptibility
Given that total atmospheric N deposition was estimated to have been 30–35 kg N ha−1 yr−1 at Novaggio in 2008, it may be surprising that a PE improvement was detected for N-treated oak leaves. Some N allocation plant studies with ample N supply show that N amendments may not only be assimilated by leaves and needles but may also increase the amount of chlorophyll as well as enhance the photosynthetic apparatus generally (Ort, 2001); may increase the amount of light harvested (e.g. Verhoeven et al., 1997); and may increase photosynthetic capacity when light is excessive and if N is available (Cheng, 2003). Proportionally greater light utilised in electron transport (increased ) will reduce the necessity for thermal dissipation in N-treated vs. control leaves. For the 2008 growing season, the greater PE of N-treated oak leaves at Novaggio may be the result of an enhanced photosynthetic apparatus (e.g. greater Rubisco and/or chlorophyll content).
When N is available, the typical foliar response to additional light is increased photosynthetic capacity. Such enhancements of the photosynthetic apparatus allow for light at greater irradiances to be utilised so that light may not be damaging (Verhoeven et al., 1997; Cheng, 2003; Ort, 2001). N treatment may have increased photosynthetic efficiencies, for Novaggio oak leaves during 2008, by enhancing the photosynthetic apparatus.
As the global concern over climate change continues to increase, the role of N deposition on carbon sequestration must be better appreciated. An increase in PE represents an increase in primary production in plants and, therefore, potentially results in an increase in carbon sequestration as plants take up carbon dioxide (CO2) during photosynthesis. However, it has been shown that (Wright et al., 2004) the leaf life span is inversely related to productivity and leaf N content, which raises the question of whether an increase in PE simply speeds up the life cycle of leaves with little or no net effect for carbon sequestration. Wright et al. (2004) also argued that the indirect effect of a shorter leaf lifespan, which is associated with increased assimilation rates (and hence PE) and higher leaf N content, will increase leaf vulnerability to herbivory and physical hazards. This could result in a negative effect on carbon sequestration in the long term that our study certainly cannot address. On the other hand, a large North American carbon sink in the conterminous USA has been attributed to several factors, with eastern US forest regrowth and enhanced growth due to atmospheric N deposition and other factors (Pacala et al., 2001). One study found that net carbon sequestration is significantly influenced by N deposition, with a strong positive influence (R 2=0.97) in net ecosystem production (NEP) due to wet N deposition up to 9.8 kg N ha−1 yr−1 (Magnani et al., 2007). Additionally, the relationship between NEP and N deposition has been shown to be largely influenced by the critical role of CNU when determining the C storage capacity of forest ecosystems (Dezi et al., 2010). Although neither the PE of the Novaggio nor those of the Lägeren site contradict these findings, many other environmental factors contribute to forest health and the increase in PE with additional N treatments at the Novaggio site is not the sole cause of forest growth.
The potential for increased C storage resulting from N deposition is widely debated. A much discussed study by Magnani et al. (2007) estimated that as much as 470 kg C per kg N could result from N deposition (De Schrijver et al., 2008; de Vries et al., 2008). Another study by Reay et al. (2008) defined the response of C sequestration to N input as 40–200 kg C per kg N, resulting in an additional 0.67 Pg C uptake by Northern Hemisphere forests each year due to total reactive N deposition. Further research concluded carbon sequestration in a range of 5–75 kg C per kg N for Northern Hemisphere forests, with a most probable range of 20–40 kg C per kg N (de Vries et al., 2009). While the scale of additional carbon storage due to N input may vary, N deposition plays an important role in understanding climate change influences.
The very high chronic N deposition rates at Novaggio suggest the possibility that Novaggio may be approaching N saturation. Previous research has shown that the critical loads for N are exceeded at Novaggio (Waldner et al., 2007). As N saturation is approached, the benefits of N fertilisation are assumed to diminish as detrimental effects on forest growth occur. However, low levels of nitrate leaching below the rooting zone at Novaggio show that in spite of high deposition rates, N is still retained in the ecosystem, indicating that saturation is not reached yet at this site (Thimonier et al., 2010). Long-term experimental N fertilisation results have shown growth increases of N-limited forests at rates of N addition comparable to high N deposition levels (below 50 kg N ha−1 yr−1) (de Vries et al., 2009). Other studies indicate that signs of soil acidification, nutrient imbalances and tree damage become evident when N addition levels reach 50–60 kg N ha−1 yr−1 (Magill et al., 2004; Högberg et al., 2006; Magnani et al., 2007). Bergh et al. (1999) found volume growth in fertilised forest stands to be almost four times higher than stands without fertilisation. At 25–40 kg N ha−1 yr−1, chronic N deposition at Novaggio appears to be contributing to forest growth. Another long-term study in northern temperate forests concluded that the magnitude of the N deposition effect on aboveground net primary production increased over time, suggesting the response is a result of the continual, accumulating N additions (Pregitzer et al., 2008). At current N deposition levels, fluorometry results suggest that additional N input may be increasing forest growth and carbon sequestration at Novaggio.
While N deposition can potentially benefit forest growth, adverse effects may occur if the rate of foliar N uptake exceeds the assimilation capacity (Krupa, 2003). Excessive N uptake can result in foliar necrosis, reduced drought and frost tolerance and increased susceptibility to pests and pathogens (Krupa, 2003). Excessive CNU also has the potential to uncouple photophoshorylation, disrupt foliar acid/base regulation and create foliar cation deficiencies (Raven, 1998; Rennenberg and Gessler, 1999). Although these impacts were not fully addressed by our study, N/P and N/K values for our treated leaves offer some qualitative support that pathogens may be responsible for the lower PEs observed at Lägeren.
One possible mechanism that may contribute to explaining the observed decrease in PE at the Lägeren beech trees is that of enhanced pathogen susceptibility due to increased foliar N concentrations (Flueckiger and Braun, 1998). Increases in the foliar ratio of N to certain other nutrients, especially N/P and N/K, have been shown by Flueckiger and Braun (1998) to be an indicator of this pathogen susceptibility (and, less well, decreases in these ratios may indicate reduced stress susceptibility). Nihlgard (1985) had hypothesised, over two decades ago, that forests may be degraded by nutrient imbalances resulting from increased N deposition. Roelofs et al. (1993) had observed a correlation between N concentrations and infestation by certain pathogens in Dutch forests. Roelofs et al. (1993) also found lower P concentrations in some Dutch forests that had experienced increased N deposition. An increase in foliar N/P ratios at northeastern United States mixed forest was associated with a thinning effect due to increased canopy growth and a reduced vitality of mycorrhizal fungi, which play an important role in the P supply of forest trees (Bowen, 1973). Beech tree leaves having Nectria ditissima infection had significantly higher N/K ratios than trees with unaffected leaves (Flückiger et al., 1986). A long-term, 24-yr study (Hippeli and Branse, 1992) showed that rising N concentrations in Pinus needles were accompanied by decreasing Mg concentrations. Changes in the ratios of N to nutrients other than P, K and perhaps Mg, have much less influence.
Table 4 presents the N/P, N/K and N/Mg ratios in Novaggio oak leaves and in Lägeren beech leaves and Lägeren spruce needles taken from the trees used for fluorometry measurements. Leaves and needles were collected late in the growing season after N amendment applications had ended. Element ratios for N-treated leaves and for control leaves are shown. The relative increases in foliar element ratios are also shown. The lack of increases in the N/P, N/K and N/Mg ratios may indirectly be associated with the observed enhancement of PE due to N amendment at Novaggio in 2008. Reduced PE due to N amendment and the percentage increases of N/P and N/K ratios in Lägeren beech lend some qualitative support to the pathogen hypothesis. The lack of increases in spruce N/P and N/K ratios may also correlate, qualitatively, to the lack of PE influence due to N amendment for Lägeren spruce. Although N/Mg ratios are not necessarily supportive of the pathogen hypothesis, Flueckiger and Braun (1998) state that the ratios of N/P and N/K are of most importance for the reactions that increase the susceptibility of trees to pathogens. Overall, the Lägeren beech element ratios, together with the Novaggio oak element ratios, lend at least partial support to the notion that physiological impacts may result from chronic high N deposition at deciduous forests.
Table 4. Foliar elemental ratios at Novaggio oak forest and Lägeren beech and spruce forests for N treatment and control foliage. The leaf/needle concentration increases in element ratios due to N treatment, relative difference, are also shown
4. Conclusions
Fluorometry results for the 2008 sampling campaign at the Novaggio oak forest show that enhanced PE can be induced by N treatment even at high N deposition forest sites. The relative daily depression of PE, DDPE, describing daytime depression of PE were lower in 2008 for N-treated oak leaves than for control oak leaves. Consideration of the yield (photochemical use of light absorbed by PSII) and NPQ (leaf heat dissipation measure) fluorometry parameters showed that significantly increased Fv/Fm, and yield, along with reduced NPQ, occurred in N-treated oak leaves relative to control leaves in 2008 (Table 1). Positive PE and improved photosynthetic performance influences, due to canopy N application, are indicated for Novaggio oak trees.
Sampling at the Lägeren beech and spruce forest site was complicated by many rain events and persistent overcast sky in 2007. Although this is common for the climate observed in the Lägeren area, such weather conditions did not allow for sufficient data gathering of high light fluorometry measurements. Nonetheless, Lägeren beech fluorometry data indicate canopy N treatment had a detrimental PE influence, whereas spruce fluorometry data indicate no influence or, possibly, a slight positive influence due to N-application. Canopy N uptake was shown to be a pathway of influence on photosynthesis at this mixed forest as well as at the Novaggio oak forest. However, the observed trends at the Novaggio and Lägeren site in conjunction with additional N-application indicate more research is needed to understand forest N deposition.
A feasible explanation for the opposing Lägeren beech and Novaggio oak trees is provided by leaf elemental concentration data. Leaf element concentration ratios in Novaggio oak leaves (Table 4) show that N/P and N/K ratios were 3% and 2% lower, respectively, for N-amended leaves than for control leaves. The Lägeren beech elemental concentration data (Table 4) show that both N/P and N/K ratios were 6% and 19% higher, respectively, for N-amended leaves than for control leaves. The Lägeren beech element ratios indicate that N deposition in the range of 19–37 kg N ha−1 yr−1 may introduce some degree of pathogen susceptibility and lend some support to the notion that pathogen susceptibility may result from chronic high N deposition at deciduous forests generally. This indirect link between increased N deposition and higher pathogen susceptibility, however, remains rather speculative and should be investigated more carefully in future studies.
Although the total potential of C storage due to N input varies, increasing N deposition from anthropogenic activities will likely enhance forest growth and impact C sequestration. Whether the additional C storage can offset the expected concurrent increase of N2O emissions that may result from increasing N deposition should also be evaluated further. In combination with such additional components, leaf-level fluorometry measurements at forests impacted by N deposition are expected to become a useful tool in detecting impacts on photosynthetic and, ultimately, carbon exchange aspects of deciduous forest dynamics.
Acknowledgements
We thank the WSL very much for installation of a canopy access platform at the Novaggio forest site and for the purchase of a PAM-2100 fluorometer, especially in such a timely fashion. We also thank WSL for obtaining ICP elemental and 15N analysis data from Lägeren beech and spruce foliage as well as Novaggio oak leaves. We also thank the Swiss Government for giving us access to the Lägeren facilities and data. This research was supported by the ETH Zurich fund for Guest Professorships. The day-to-day help of Claudine Hostettler, Grassland Sciences Secretariat, and of Sophia Etzold for her collection of Lägeren foliage is appreciated. The assistance of Franco Fibbioli of the WSL sottostazione and of Hugo Balster of INSTAAR, University of Colorado, in gathering fluorometry data at Novaggio and Lägeren is greatly appreciated. We further also thank Kiko Bianchi and Oliver Schramm for sample collection, Anna Brechbühl and Noureddine Hajjar for laboratory work of the Novaggio site and Daniele Pezzotta and his team for the chemical analyses at WSL. We further would like to acknowledge the work of Gustav Schneiter, Peter Jakob and Flurin Sutter for running meteo-stations and data base of the Novaggio site. The Patrizziato of Novaggio kindly allowed the installation of the platform in their forest. The platform installation was coordinated by Christian Hug and financing of the fluorometer and platform arranged by Norbert Kräuchi. Finally, the U.S. National Science Foundation's Niwot Ridge Long-Term Ecological Research grant provided logistics support to this ecological field study.