
Fig. 1.
Scatter plot of O3 versus N2O for the whole data. The scatter shows the shape of a boomerang. The positive and negative correlation in the figure is from the region above and below the ozone maximum.

Fig. 2.
Scatter plot of O3 against a) altitude, b) longitude, c) latitude and d) day number.
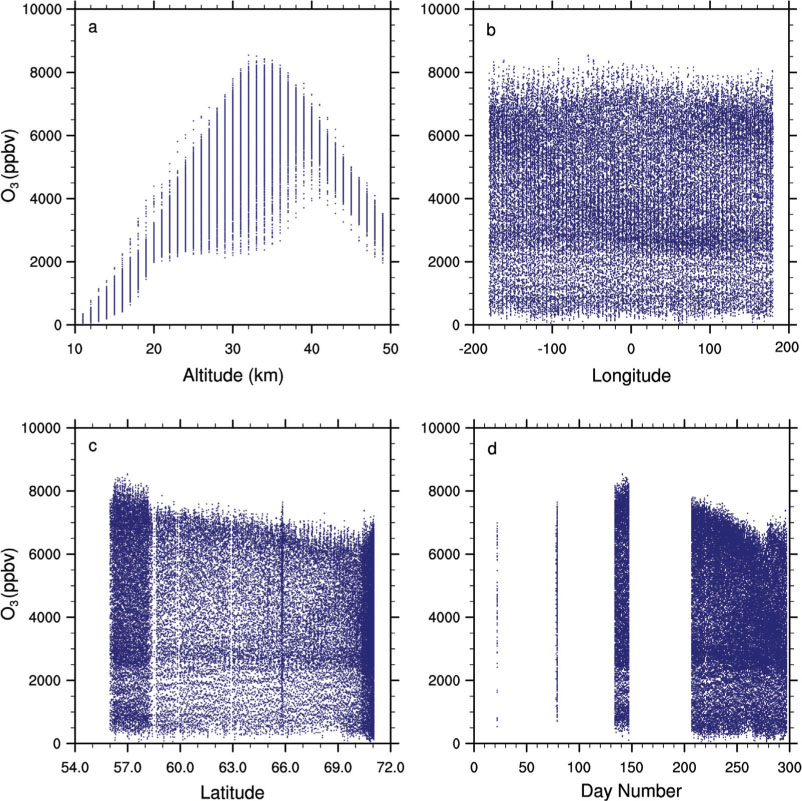
Fig. 3.
The clusters for the choice of different search radii. The number of clusters obtained is shown within the bracket for each search radius. A search radius of 0.3 is used in the present study.
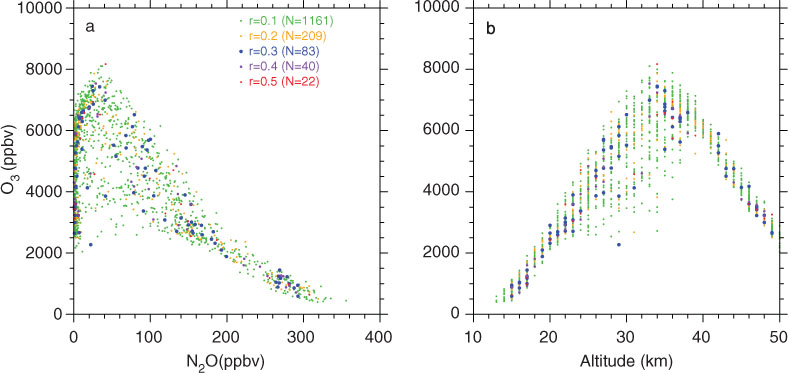
Fig. 4.
O3 (in ppbv) observed and predicted for a) training data and b) validation data set.
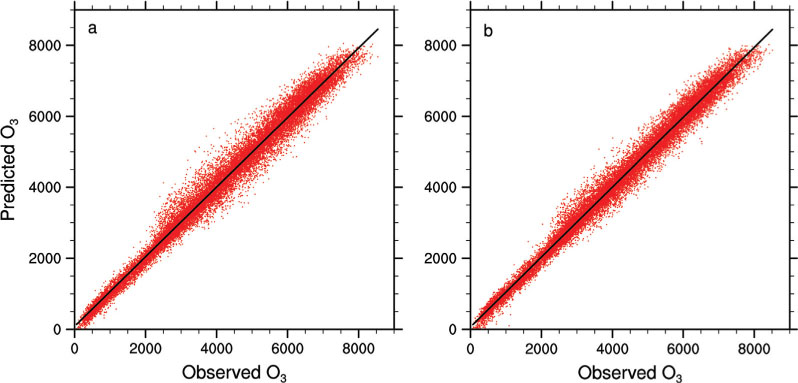
Table 1. Comparison of the performance the models based on fuzzy and regression techniques. The number of data points used was 23 936 for both training and validation