
Fig. 1.
Map of the central Arctic Ocean, showing the route of the icebreaker Oden during the Arctic Ocean Expedition 1996 (AOE-96; Leck et al., 2001) as green line, the route for the Arctic Ocean Expedition 2001 (AOE-2001; Leck et al., 2004; Tjernström et al., 2004) as black line and the route of the Arctic Ocean Expedition ASCOS in 2008 (Paatero et al., 2009) as red line. The major part of the observations during AOE-96 were performed during the first leg of the expedition which lasted from middle July to the end of August from 75°N to 87°N in the Barents Sea as well as in the pack ice of the Nansen and Amundsen basins. On the second leg, Oden reached the North Pole on 10 September (DOY 254) and Spitsbergen (Svalbard), at latitude 78°N on 21 September (DOY 265). AOE-2001 lasted from 5 July (DOY 186) to 26 August (DOY 238), 2001. Most of the observations were obtained during the 2 August (DOY 214) to 23 August (DOY 235) when the ship was moored to, and drifted with, an ice floe from latitude 88.9°N to 88.2°N. ASCOS-2008 lasted from 2 August (DOY 215) and returned to the same location on 9 September (DOY 253), 2008. After departure of the Oden from Longyearbyen, Spitsbergen, the first two stations were located in the open water on 3 August (DOY 215) and in the MIZ starting 4 August (DOY 216) of the Greenland Sea. Thereafter, the ship headed North through the pack ice area. The most intensive measurement period commenced during 12 August (DOY 225) when the ship was moored to an ice floe at 87°N and drifted for 21 d (1 September, DOY 245). The light-blue line illustrates the location of the ice edge zone in the summer of 2008.
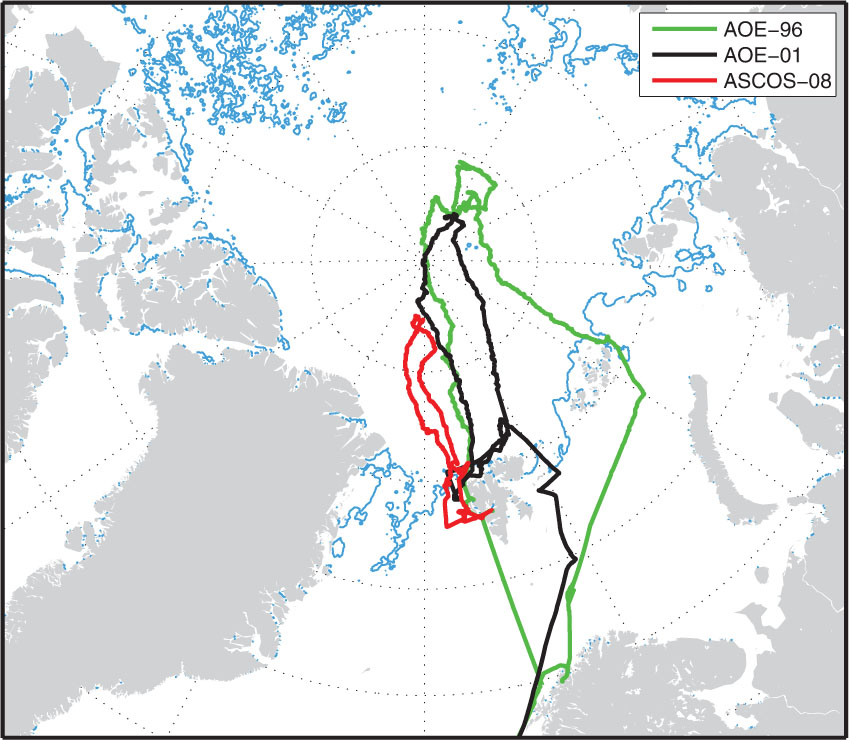
Table 1. Main characteristics of the central Arctic Ocean nucleation events included in this study
[i] aGrowth rate determined from the leading edge of the growth band in the first hour after onset of nucleation.
[ii] bNo growth curve observed.
[iii] cMeasured with low-pressure five-stage Berner cascade impactor (BCI) in the diameter size range 25–161 nm.
[iv] dNo data available.
[v] eMaximum total number concentration of nucleation mode (<25 nm) particles observed during the event.
[vi] fRatio of observed number concentration of Aitken mode particles 1 h after the onset of nucleation (N Aitken (after)) to those 1 h before the onset of nucleation (N Aitken (before)). Aitken mode was defined as diameter range 25–80 nm.
Table 2. Relevant molecular properties of the condensing vapours at 280 K with respect to condensation/evaporation: molecular weight (MW), saturation vapour pressure (), density of the liquid (ρ L ) and surface tension (Σ)
[i] aCalculated using the temperature-dependent expressions for the saturation vapour pressure given by Kreidenweis and Seinfeld (1988) for MSA, by Kulmala and Laaksonen (1990) for H2SO4 and by Bilde et al. (2003) for succinic acid.
[ii] bExpressions for surface tension and density from Vehkamäki et al. (2002) using unity mass fraction of H2SO4 are applied.
[iii] cWyslouzil et al. (1991).
[iv] dKreidenweis and Seinfeld (1988).
[v] eHyvärinen et al. (2006).
Table 3. Average observed gas-phase concentrations, background particle numbers (N tot) and meteorological variables during the nucleation event cases. In addition, the range of modelled H2SO4 concentration is given
Table 4. Comparison of modelled nucleation rates (cm−3 s−1) obtained from different nucleation schemes for the six nucleation events during AOE-96/AOE-2001/ASCOS-2008. A predefined OV concentration is used in all simulations. Presented nucleation rates are average values for the first 7 h of the simulation
Table 5. Model results for important characteristics of the studied nucleation event cases
[i] aContribution of ion-mediated nucleation, IMN, (in%) to the overall (combined) nucleation (TSA).
[ii] bRequired OV concentration to match upper end of observed Aitken mode or accumulation mode particle diameters as described in Section 3.3.
[iii] cModelled average growth rate of the first hour of the event (simulation TSA-NK).
[iv] dIn event case DOY 207, no nucleation mode particles were initially present in the 3–10 nm diameter range.
{ label needed for table-wrap[@id='T0006'] }
Table 6. Comparison of modelled and observed nucleation mode particle number concentrations. Ratio of modelled maximum nucleated particle number concentrations to observed maximum particle number concentrations (3–25 nm diameter size) during the nucleation events (M/O). Model simulations with nucleation option KSA-NK, TSA-RF (reference run), TSA-NK and OS3-NK
Fig. 2.
Sequential number size distribution (dN/d log D p in particles cm−3) during events: (a) observation DOY 207; (b) modelled event DOY 207 using TSA-NK and OV concentration of 7.0×108 cm−3; (c) observation DOY 209; (d) modelled event DOY 209 using TSA-NK and OV concentration of 4.0×108 cm−3; (e) observation DOY 233; (f) modelled event DOY 233 using TSA-NK and OV concentration of 1.5×108 cm−3. All plots have the same time and diameter scale.
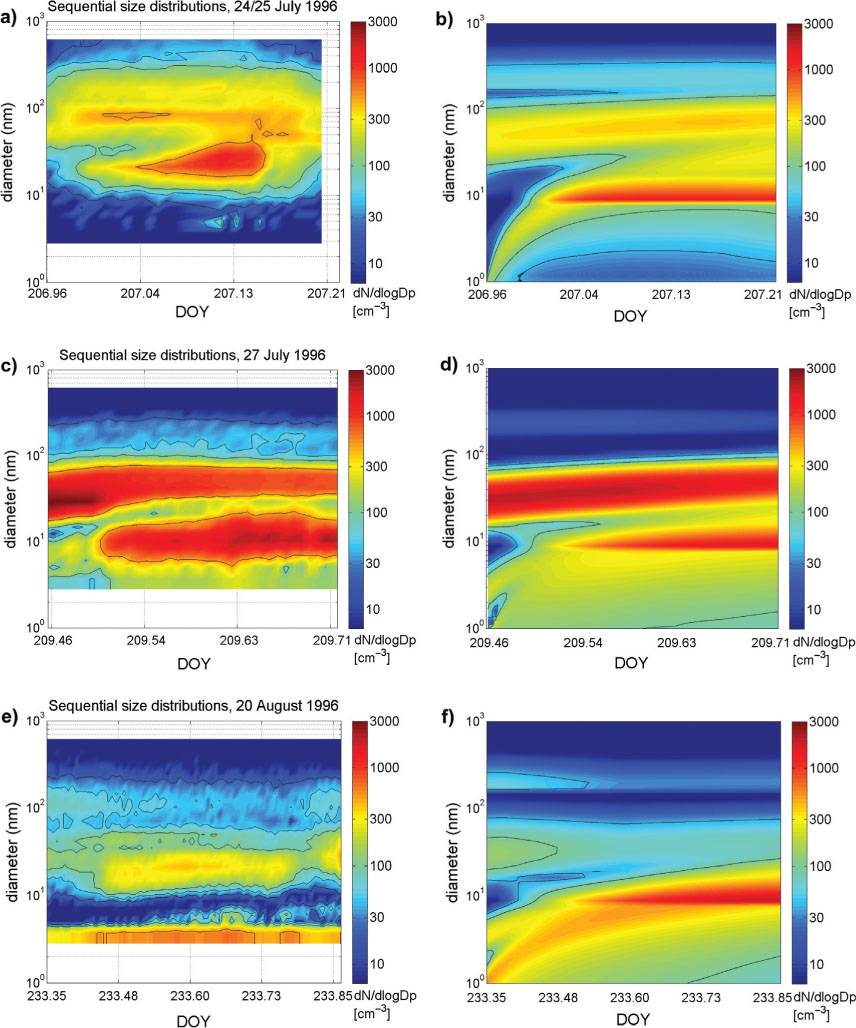
Fig. 3.
Number size distributions during event case DOY 207 (AOE-96). Modelled (lines) and observed (squares) size distributions (dN/d log D p) at event onset (black), 2:20 h (green), 5 h (blue), 7:10 h (red). Model simulation with TSA-RF (solid line) and TSA-NK (dotted line, partly overlapping with TSA-RF) using a prescribed OV concentration of 7.0×108 cm−3.
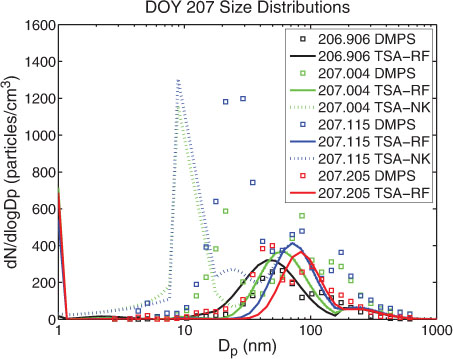
Fig. 4.
Number size distributions during event case DOY 209 (AOE-96). Modelled (lines) and observed (squares) size distributions (dN/d log D p) at event onset (black), 2:20 h (green), 4:40 h (blue) and 9:30 h (red) after onset. Model simulation with TSA-RF (solid line) and TSA-NK (dotted line, partly overlapping with TSA-RF) using a prescribed OV concentration of 4.0×108 cm−3.
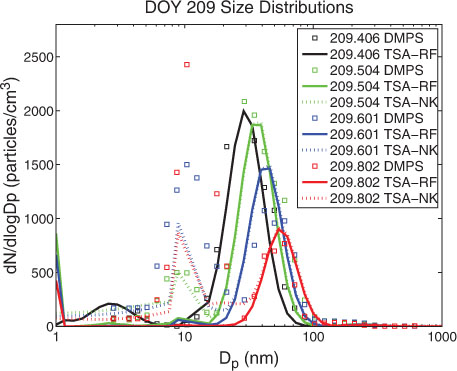
Fig. 5.
Modelled concentrations of isoprene (solid line), OH (dashed line), the condensable OV (dotted line) in a test simulation of DOY 209. Modelled aerosol mass concentration of organics (diameter range 10–100 nm) is shown on the left y-axis (dotted line with circles). Also the source rate of OV (cm−3 s−1) is plotted (dash-dotted line).
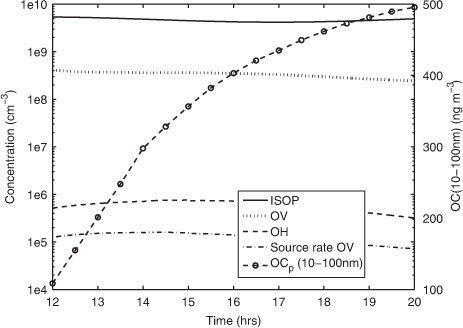
Fig. 6.
Number size distributions during event case DOY 233 (AOE-96). Modelled (lines) and observed (squares) size distributions (dN/d log D p) at event onset (black), 2:30 h (green), 6:00 h (blue) and 10:50 h (red) after onset. Model simulation with TSA-RF (solid line) and TSA-NK (blue- and green-dotted lines, partly overlapping with TSA-RF) using a prescribed OV concentration of 1.5×108 cm−3.
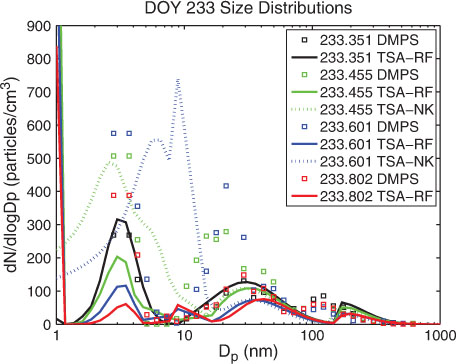
Fig. 7.
Number size distributions during event case DOY 235 (AOE-96). Modelled (lines) and observed (squares) size distributions (dN/d log D p) at event onset (black), 3:40 h (green), 8:30 h (blue) and 13:20 h (red) after onset. Two model simulations using prescribed OV concentration of 0.6×108 cm−3 were performed: (a) with TSA-RF (solid line) and TSA-NK (dotted line) and (b) with OS3 (solid line) and OS3-NK (dotted line).
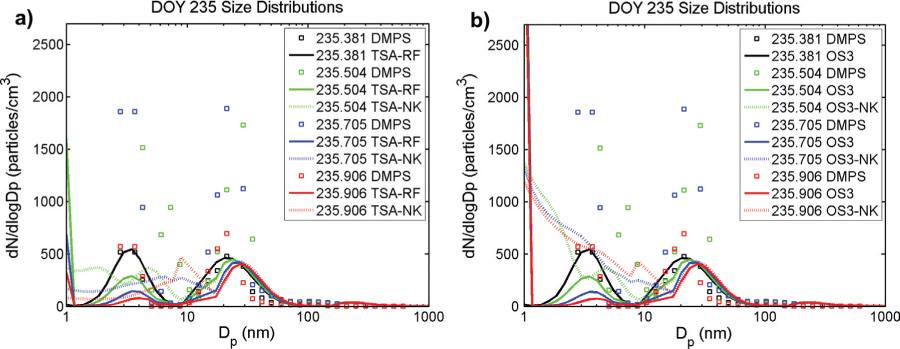
Fig. 8.
Sequential number size distribution (dN/d log D p) during event case DOY 235 (AOE-96): (a) observed; (b) modelled with TSA-RF; (c) modelled with TSA-NK and (d) modelled with OS3-NK. OV concentration of 0.6×108 cm−3 is used in all model simulations. All plots have the same time and diameter scale.
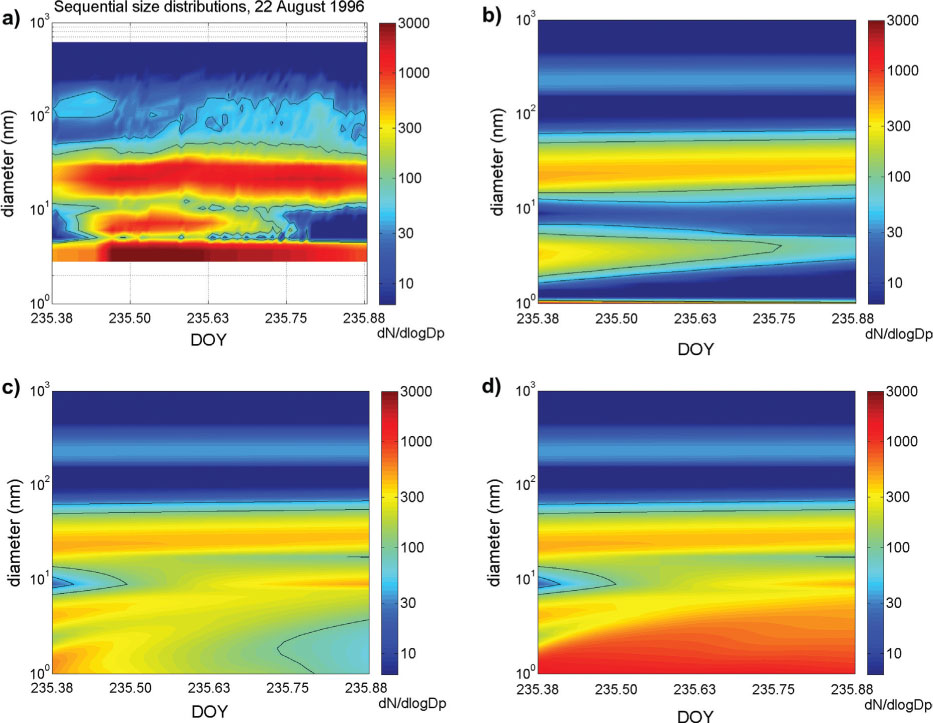
Fig. 9.
Sequential number size distributions (dN/d log D p in particles per cubic centimetre) during event DOY 225 (AOE-2001) and DOY 216 (ASCOS-2008): (a) observation DOY 225; (b) modelled event DOY 225 using TSA-NK and a prescribed OV concentration of 3.0×108 cm−3; (c) observation DOY 216 and (d) modelled event DOY 216 using TSA-NK and a prescribed OV concentration of 2.0×108 cm−3. Note that the plots of the observation (c) and of the model simulation (d) have different time ranges but same diameter scale.
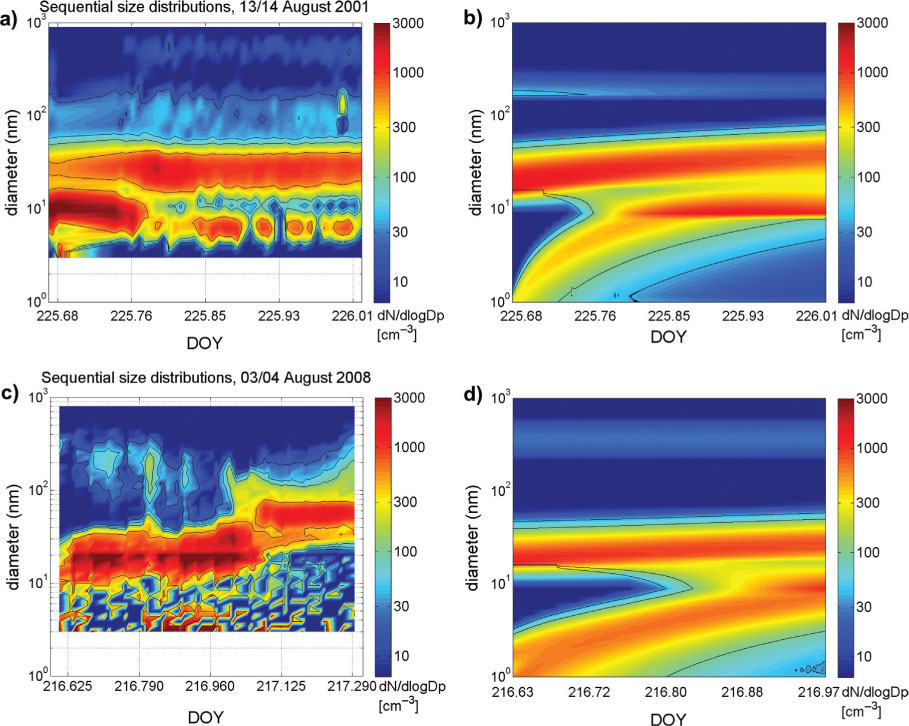
Table 7. Results of the model uncertainty test for the events DOY 225 (AOE-2001), DOY 233 (AOE-96) and DOY 216 (ASCOS-2008). Relative deviation (in%) of modelled compared to observed total number concentrations in the size ranges 3–20, 21–50 and 51–100 nm in the middle of each event (respectively, at DOY 225.845, DOY 233.575 and DOY 216.790)