
1. Introduction
With the world's rapid economic growth, an increasing consumption of fossil fuel results in emission of more air pollutants, of which SxOy and NxOy are the two major atmospheric contaminants (Bayraktar and Turalioglu, 2005). These gases could be converted to acids (mainly HNO3 and H2SO4) under a series of oxidation conditions. Parts of these chemicals enter the terrestrial and marine ecosystems with the atmospheric depositions during transportation, and others may reach remote polar areas with the transportation of air mass. For instance, the higher levels in Greenland snowfall in recent years indicate the anthropogenic inputs of NxOy (Mayewski et al., 1990).
Wet atmospheric deposition is an important method of removing atmospheric pollutants, which could account for half or more of the bulk atmospheric pollutant deposition fluxes (Morselli et al., 2003; Shi, 2009). The ionic concentrations in the wet deposition are dominated by various factors, such as aerosol sources and distribution, transport processes and so on (Celle-Jeanton et al., 2009); in general, the meteorological factors are considered to be the main influencing factors (Strayer et al., 2007). In terms of the ionic origins, both anthropogenic and natural sources should be considered, which include human-related emissions from fuel consumption and agricultural activities, marine aerosols, etc. However, it is quite difficult to quantitatively discriminate the ionic sources because of the complicated contributions, and to date the multivariable analysis or air mass backward trajectory model has been the common method for ionic source identification (Celle-Jeanton et al., 2009).
Atmospheric deposition, which is essential for marine primary production, is a significant nutrient input to the remote open ocean (Baker et al., 2006). On the contrary, the atmospheric deposition process of ions is of great importance to understand the global biogeochemical cycles of elements (e.g. N, S and C). Till now, many observations aimed at analysing the chemical constituents of wet deposition have been performed (Chantara and Chunsuk, 2008), and regional variations of wet deposition chemicals have been well documented (Akkoyunlu and Tayanç, 2003). However, the ion variations of precipitation in large-scale spaces are limited because of the sparse sampling and monitoring. This study aims to characterise the ionic constituents in the wet depositions collected along the cruise tracks from China to Antarctica (31°N–69°S), present spatial variations of the ions, and also identify the main sources of ions, as well as their transportation trajectories. The results of this research would be meaningful to the establishment of a database on global precipitation chemistry; moreover, revealing the variability of ions in wet deposition along the large-scale transect would be helpful to further understand ocean–atmosphere interaction processes.
2. Methodology
2.1. Sample collection and analysis
Samples were collected along the voyage route of the 27th Chinese National Antarctica Research Expedition (October 2010–April 2011). The route, about 37 000 km, covered a broad span of latitudes (31°N–69°S), and the main voyage segments were Shanghai–Shenzhen–Fremantle–Zhongshan Station–Fremantle–Shanghai (see Fig. A1 in supplement material). Sampling was performed in the top deck, more than 20 m above sea level, and the sampling locations were set up in the windward sides to avoid contamination by the vehicle emissions. Wet-only precipitation samples were collected with a high-density polyethylene rain gauge with a 500 cm2 aperture, placed 1.8 m above the top deck. The samplers and buckets were not installed until the rainfall/snowfall started. The wet deposition was collected as soon as the precipitation events were over. If the period between two precipitation events was less than 4 h, the two samples were mixed together as an event. If the volume of the collection bucket was smaller for the heavy continuous rain, then the precipitation was collected separately; these samples were considered as an event. When a single sample volume was not enough for analysis (<5 mL), the deposition sample was discarded. After each collection campaign, samples were weighed and parts of these were measured for pH (YSI 60). Meanwhile, meteorological data during the collection periods were obtained from the automatic weather station installed on the ship (Table 1). All the samples were kept in polyethylene-sealed bottles and preserved in freezing condition (<−20°C). Totally, 22 samples were included for major ion analysis, and the collection information is summarised in Table A1 in the supplement material. All the vessels (funnels, buckets, storage bottles, etc.) used in sampling were washed with laboratory detergent, subsequently with water and finally with Milli-Q water (>18.0 MΩ) for three times to avoid contamination. After the cleaning procedures, the collection vessels were enclosed in plastic bags for transport to the sampling sites.
Table 1. Meteorological factors during the sampling period and the major ion concentrations in the wet depositions along the cruise tracks
[i] Note: Wind speed, direction and temperature are the mean values of each sampling campaign.
[ii] SN, Sample number; WS, wind speed; WD, wind direction; T, temperature.
In the laboratory, the sample treatment was performed under a sterile hood. Aliquots of the samples were taken for the measurement of pH once again, and the other parts of samples were filtered through a 0.45 µm cellulose acetate membrane leached with deionised water for the analysis of ion concentrations. A Dionex ion chromatography (DX500) was used for the ionic measurement. The cations (Na+, , K+, Mg2+ and Ca2+) were analysed using a Dionex column CS12 (2×250 mm), with a guard column CG12 (2×50 mm); the anions (Cl−, and ) were analysed by the Dionex column AS11 (2×250 mm), with a guard column AG11 (2×50 mm). The eluent of cations was 18.00 mM methanesulfonic acid; gradient elution method was employed for anion analysis, with the eluent of potassium hydroxide. The sequences of cations separated were Na+, , K+, Mg2+ and Ca2+, while the anion orders were Cl−, and severally (see Fig. A2 in the supplement material). The detection limits for Cl−, , , Na+, , K+, Mg2+ and Ca2+ were 0.3, 0.1, 0.2, 0.3, 0.8, 0.4, 1.0 and 1.5 µeq L−1, respectively. Additionally, three field blanks, six field duplicates, were analyzed for the ionic concentrations, to ensure accuracy and reliability of the measuring results (QA/QC). During the experimental procedure, all the reagents were GR grade and the water was Milli-Q (>18.0 MΩ).
2.2. Data quality and data analysis
Charge balance of ions in all samples was checked for the evaluation of data quality. The results (see Fig. A3 in the supplement material) showed that there was an electric equilibrium between the total cations and the sum anions, implying the reliability of the major ions data. Furthermore, the ion percent differences between cations and anions, namely (cations−anions)/(cations+anions), were well below the criteria defined by Peden et al. (1986), validating the ion data further.
The non-sea-salt fractions of and Ca2+ of wet depositions could be obtained based on the following equations by assuming Na+ exclusively from sea salt (Seto et al., 2000):
Ion concentration unit in the above two equations is µeq L−1.

Statistical analysis was carried out using the software, Origin 6.0 (OriginLab Corp. USA). Principal component analysis was performed using the SPSS software packages (SPSS Inc., USA). The air mass backward trajectory analysis was carried out by the HYSPLIT model, National Oceanic and Atmospheric Administration, USA.
3. Results and discussion
3.1. pH of the wet deposition
Wet deposition is the scavenging of gaseous (e.g. SxOy and NxOy) or fine particle species, and pH of the precipitation is controlled by the balance between acids and bases. In the case of precipitation, the acids are supposed to be HNO3 and H2SO4, whereas the predominant bases include NH3·H2O and CaCO3. For the acids of HNO3 and H2SO4, and would be used as the surrogate in the atmospheric neutralisation processes. For the bases, ions of and Ca2+ could quantitatively represent NH3·H2O and CaCO3 involved. There is a good stability between the early and late pH measurements, and the values ranged from pH 4.3 to pH 6.4, with an average of pH 5.6, which is the same with the pH of rainwater in equilibrium with CO2 in the atmosphere (Charlson and Rodhe, 1982). Obviously, there is a balance between the acidic and basic compounds in the wet depositions from the pH 5.6. Meanwhile, 12 out of the 22 precipitation samples have pH values of less than pH 5.6. The observed acidity is probably because of the remote sampling locations (e.g. Southern Ocean), where the concentration of particle matter in the atmosphere is relatively low. The particle matter in the precipitation is rich in carbonates or bicarbonates of Ca, which could buffer the acidity caused by both HNO3 and H2SO4 (Al-Khashman, 2005; Báez et al., 2007). Furthermore, NH3·H2O is also a significant contributor to the precipitation alkalinity through the dissociation in the solution (NH3·H2O=+OH−). The fractions of different acids and bases to the precipitation acidity will be analyzed in the discussion section.
3.2. Ionic constituents in wet deposition
The major ion concentrations in the wet deposition are tabulated in Table 1, and the statistical results are listed in Table 2. In general, ionic levels show an order of Cl−>Na+>Mg2+>>Ca2+>K+>>, on an equivalent basis. Cv of the eight observed ions is around 1, indicating higher levels of dispersion around the averages. In terms of the two types of precipitation, there is a difference between ion levels of rainfall and snowfall, with the ratios (rainfall vs. snowfall) of 1.3 (Cl−), 6.7 (), 1.7 (), 1.3 (Na+), 2.0 (), 1.7 (K+), 1.4 (Mg2+) and 2.0 (Ca2+), respectively. As for the non-sea-salt fractions, the medians of nss- and nss-Ca2+ concentrations are 16.46 and 9.31 µeq L−1, respectively. The nss-Ca2+ levels are relatively low in the southern Indian Ocean, which validate the lower pH values in the remote regions (section 3.1). As for the nss-, the great variation (Cv=134%) indicates the varied sources of in the atmosphere. The other observations around the world are also listed in Table 2. On the whole, the sea-salt-related ions, Cl− and Na+, show higher levels in the broad open oceans and coastal areas. On the contrary, , and Ca2+ concentrations in the remote oceans are relatively lower, comparable to the results of this study. In terms of the studies performed in terrestrial areas, Ca2+, , and show higher values, especially in the cities. It is noticeable that ionic concentrations in Tibet, a remote and desolate region, which is far from the oceans, are generally lower.
Table 2. Major ion concentrations in the wet depositions collected in different areas (in µeq L−1)
[i] Note: Coefficients of variation of the observed ions range from 84 to 132%, suggesting that standard deviations are large compared to the means. In this case, the mean is not a good statistical description of the results, whereas the median could better depict the typical outcome.
[ii] na, not available.
[iii] a Cv, coefficient of variation, is the ratio of the standard deviation to the mean.
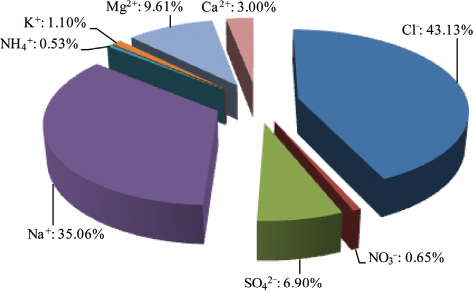
The percentage of each ionic constituent to the total ions is illustrated in Fig. 1. Cl− and Na+ are the most abundant species, accounting for 78% of the total ions, followed by Mg2+ and . The other four ions, , , K+ and Ca2+, contribute about 5% to the total ions. On average, the anions (Cl−, and ) make up about half, 50.69%, of the total ions, indicating an equivalent concentration balance between total cations and anions in the wet depositions. Furthermore, total cation concentrations are well correlated with the sums of anions (r=0.99, p=0.00), implying that the investigated ions are the main constituents in the wet deposition, and the methods for collection and analysis are reliable (Rastogi and Sarin, 2005).
Fig. 1.
Contribution percentages of each ion to total ionic concentrations, in µeq L−1.
3.3. Interhemispheric variation of ions
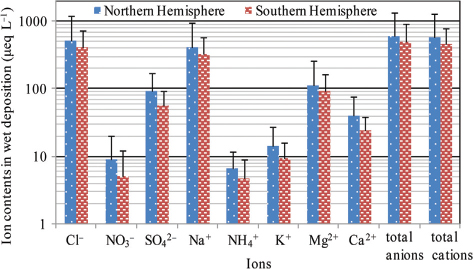
The statistical results of ionic concentrations in Northern Hemisphere (NH) and Southern Hemisphere (SH) are illustrated in Fig. 2. Ionic levels in NH, in general, are higher than those of SH, especially for the ions and Ca2+; and the ratios of NH/SH are 1.74 () and 1.66 (Ca2+), respectively. In terms of the total ion concentrations, the higher values are mostly located in the NH (e.g. sample No. 2, 20 and 21). Most of the sampling sites in SH are far from terrestrial areas, and the marine source probably dominates the ionic concentrations; whereas the sampling locations in NH are close to continents (see Fig. A1 and Table A1 in the supplement material), and the precipitation is likely affected by the anthropogenic emissions in addition to the marine sprays. Hereby, the varied sources result in the interhemispheric variation of ions, and a similar spatial variation pattern was also observed for the aerosol elements (Baker et al., 2006).
Fig. 2.
Ionic concentrations in the samples collected in both Northern Hemisphere and Southern Hemisphere, in µeq L−1. Error bars are the standard deviations.
3.4. Discussions
Enrichment factor analysis could present the ion accumulation in the wet deposition, and it is helpful in discriminating marine sources by comparison with seawater ion levels (Bayraktar and Turalioglu, 2005). The expression of calculating enrichment factors (EFs) is as follows:
where seawater is the reference material and Na+ is the reference ion (Keene et al., 1986). X is the observed ions in precipitation, and the ionic ratios in seawater are from Keene et al. (1986). EFs of the ions are shown in Fig. 3, and most of EFs of Cl−, K+ and Mg2+ are around 1, implying that their sources are similar to that of Na+, the reference ion. Moreover, the four ions, Cl−, Na+, K+ and Mg2+, are correlated very well at a 99% confidence level (Table 3), indicating their common sources. It could be inferred that marine source is the primary origins of Cl−, Na+, K+ and Mg2+ in the wet deposition. Furthermore, EFs of and Ca2+ are relatively higher, indicating that they are probably controlled by other sources.
Fig. 3.
Enrichment factors of ions in wet depositions. Error bars represent the standard deviation of the 22 observed samples. The values of and are not available because of their greatly varied concentrations in seawater; consequently, the typical ratios of /Na+ and /Na+ cannot be given.
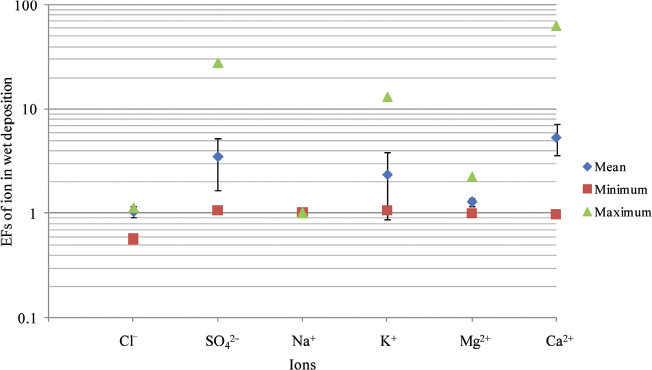
Table 3. The correlations between concentrations of marine-sourced ions (Cl−, Na+, K+ and Mg2+) and Ca2+ and in the wet deposition on an equivalent basis (n=22)
[i] Note: The upper right part of the table is the correlation coefficient, and the lower left part is the significance.
[ii] *Correlation is significant at the 0.05 level (two-tailed).
[iii] **Correlation is significant at the 0.01 level (two-tailed).
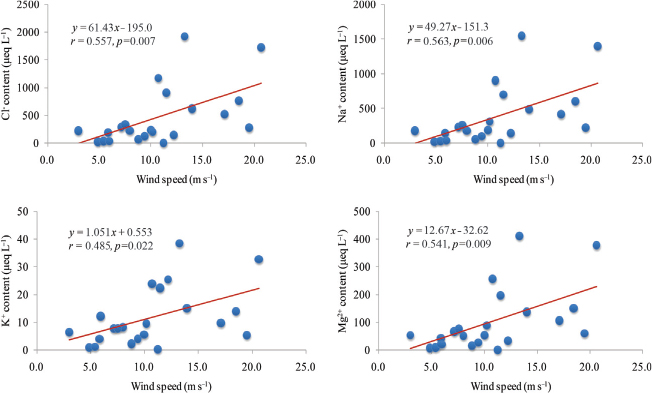
Principal component analysis is a powerful tool for source identification. The results of principal component analysis of the eight ions are shown in Fig. 4. Overall, the two components extracted could explain 83.03% of the total variance of the ions. Component 1 accounts for 57.12% of the eight ion variances, with an eigenvalue of 4.57. In the first component, Cl−, Na+, K+ and Mg2+ are highly loaded (>0.92), suggesting that they are from the same source, which validate that marine source controls Cl−, Na+, K+ and Mg2+ levels. Moreover, there are good linear relationships between the four ions and wind speed (Fig. 5). This implies the increased amount of sea-salt aerosols emitted from the oceans to the atmosphere at greater wind speeds. Wind speed over oceanic areas has a direct impact on sea-salt levels in the atmosphere, consequently influencing ionic levels of precipitation.
Fig. 4.
Ionic loadings in the two components extracted by principal component analysis. The raw data were normalised through log transformation. Varimax with Kaiser normalisation rotation method was used to highlight the main influence factors, and regression method was selected to calculate factor score coefficient. Consequently, two components were extracted, and the horizontal and vertical axes were represented as the loadings of the eight observed variables in component 1 and component 2, respectively. The loadings were obtained from the eigenvalues of the two components and their corresponding eigenvectors.
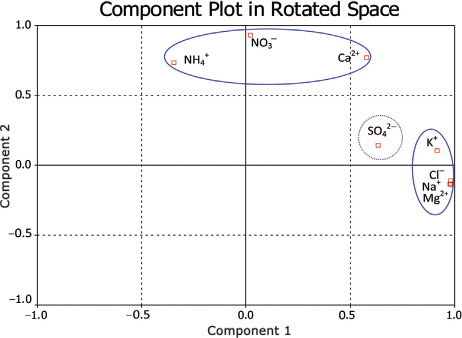
Fig. 5.
Correlation analysis between wind speed and marine-sourced ions, Cl−, Na+, K+ and Mg2+.
Component 2 accounts for 25.91% of the total variance, with an eigenvalue of 2.07, and , and Ca2+ show great loadings, namely, 0.93, 0.73 and 0.77, respectively, indicating that they are from similar sources. in the atmosphere is mainly associated with NxOy, and previous studies have revealed that industrial (associated with ) and agricultural (related to ) sources contribute to high atmospheric nitrogen contents in NH, and biomass burning is an important source of atmospheric nitrogen in SH (Baker et al., 2006). Also, Ca is a major Earth crustal element (Kulshrestha et al., 2003), and higher Ca2+ concentrations are presented in the depositions close to the continents in this observation. On average, nss-Ca2+ accounts for about 55% of Ca2+ in the wet depositions, with relatively lower percentages in the remote open ocean areas. Therefore, it could be concluded that component 2 represents anthropogenic source in terrestrial areas. It is noticeable that Ca2+ also exhibits a positive loading (0.51) in component 1, together with a moderate correlation between Ca2+ and marine-sourced ions (Table 3), implying that marine source is the secondary contributor to precipitation Ca2+.
It is to be noted that shows a positive loading of 0.63 in component 1, corresponding to marine sources. But the EFs of are higher than the marine-sourced ions, indicating other contributions, and the non-sea-salt fractions (nss-) make up more than 40% of total in the observed samples. In component 2, also presents a small positive loading, suggesting human inputs. Besides, dimethylsulphide produced by phytoplankton in the seawater is a non-negligible source of . Dimethylsulphide is considered to be of significance to precipitation by acting as cloud condensation nuclei (Charlson et al., 1987). In remote marine atmosphere, the oxidation of biogenic-sourced sulphur gases, mainly dimethylsulphide, is an important source of atmospheric SO2 (Andreae and Raemdonck, 1983). Consequently, the biogenic sulphur gas could be an important source of in remote marine atmosphere. However, further studies are needed to quantify the percentages of each source contributing to precipitation .
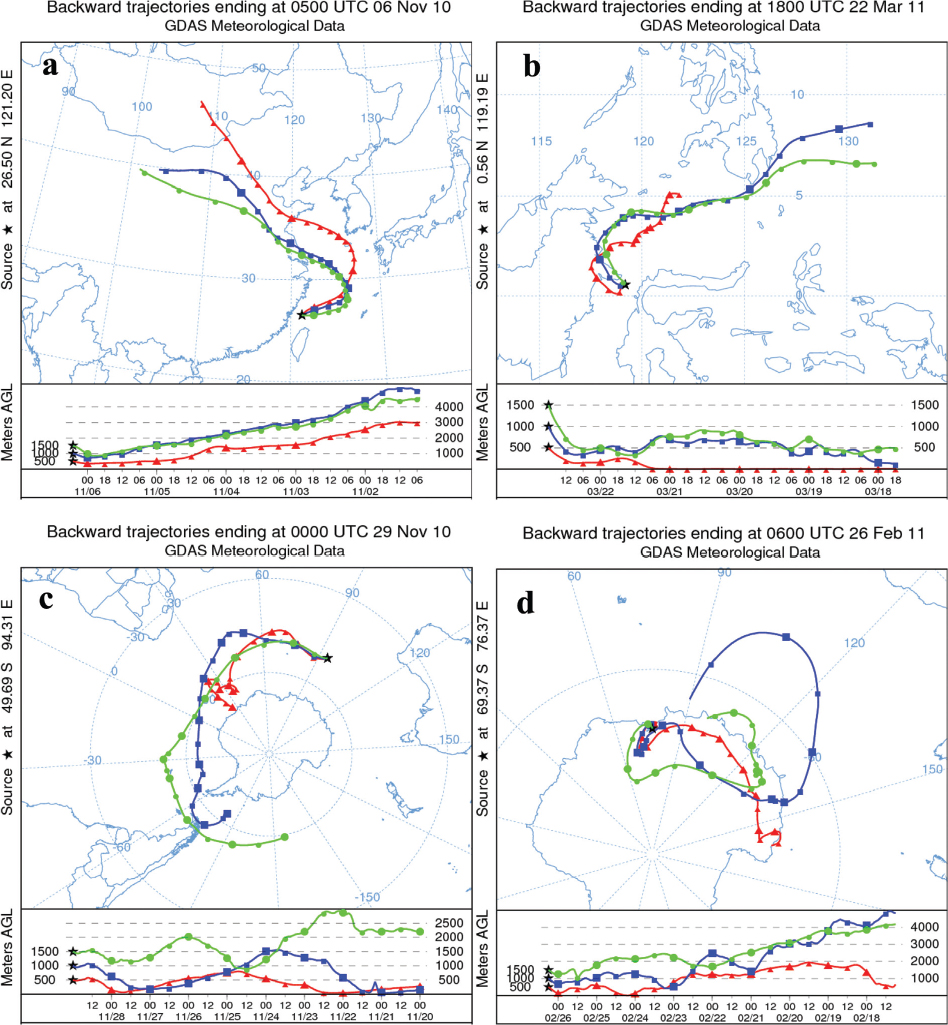
For further exploration of ionic sources in wet depositions, the NOAA HYSPLIT model was used for the air mass backward trajectory analysis. Four sites distributed evenly along the cruise track were selected for trajectory analysis, and the results are shown in Fig. 6. Sampling location in Fig. 6a is dominated by East Asian monsoon, where the ions are from both East China Sea/the Yellow Sea and inlands of China. Figure 6b shows a typical site in the equatorial region, with lots of islands distributed, and both anthropogenic inputs and oceanic sprays are probably the principal contributors to atmospheric ions. Site in Fig. 6c is located in remote open Indian Ocean, in the belt of the Westerlies. On one hand, large amounts of sea salt are emitted from the seawater by the westerly wind, contributing sea-salt ions to the precipitation. On the other hand, the westerly wind could bring the pollutants of southern South America to this area, influencing wet deposition constituents. The site close to east Antarctica is controlled by air materials from both upper atmospheric transport and ambient ocean (Fig. 6d). However, the material inputs by the air mass transport are complicated because of the Antarctic vortex as well as air mass transportation in the constant stress layer of ice sheet, and more investigations are needed to identify the ionic sources. In conclusion, ions in the precipitations are influenced by both long-distance transport of materials and regional emissions.
Fig. 6.
Air mass backward trajectories of four typical precipitation events at heights of 500, 1000 and 1500 m, respectively. The backward trajectories were obtained with the aid of NOAA HYSPLIT model. Figures a, b, c and d are illustrated for sample no. 2, 9, 18 and 14, respectively. The date on each figure denotes the ending date of the total running time, namely, the sampling time.
In the wet deposition, H2SO4 and HNO3 are the major acidic components, which will be completely dissociated into H+ and its counter anions, and , in water solution; the weak bases, NH3·H2O and CaCO3, will be partially dissociated, eventually yielding OH−, and Ca2+ in precipitation. However, these ions could also be from the dissolution of salt in the rainwater, e.g. CaSO4→Ca2++. In this case, and are not always associated with the acids, and and Ca2+ are not always related with bases in the wet depositions. Generally, in view of the current studies of atmospheric chemistry, it is a reasonable assumption that and are related with H2SO4 and HNO3, respectively, in the wet deposition (Chan et al., 1987), and the acidity could be estimated without any neutralisation from the sum of nss- and (Morgan, 1982). The ratio nss-/ (equivalent concentration average) of the observed precipitation is ca. 4, indicating that the fractions contributing to the precipitation acidity are around 80% (H2SO4) and 20% (HNO3), respectively. Meanwhile, the generally lower ratios of H+/(nss-+) imply that a considerable neutralisation occurred (Daum et al., 1984). As for the correlations between ions, the sum of the two anions (nss-+), agree well with the total of the three cations, (+nss-Ca2++H+), r=0.81, p<0.01, showing that the acidity of atmospheric wet depositions collected along the large-scale transect is mainly determined by the two acids, H2SO4 and HNO3, and two weak bases, NH3·H2O and CaCO3. Accordingly, the wet deposition acidity could be quantitatively discussed based on the relative concentrations of the four surrogates, namely, , , and Ca2+. The ratios of or nss-Ca2+ to (nss-+) could characterise the neutralisation effect, and the ratios of nss-Ca2+ are generally higher than those of . Thereby, CaCO3 (releasing OH− due to dissociation) plays a more important role in neutralisation of precipitation than NH3·H2O, which is different from the results of terrestrial study (Báez et al., 2007).
4. Conclusions
Study of major ionic constituents in wet deposition along a large-scale spatial transect, from 31°N to 69°S, was performed. The average pH of wet deposition is pH 5.6, showing neutral characteristics by and large. In general, ionic concentrations vary greatly, and levels of rainfall are higher than the values of snowfall. As for the eight constituents, Cl− and Na+ are the most abundant ions in wet deposition, whereas , , K+ and Ca2+ contribute less to the total ionic concentrations. In terms of latitudinal gradient, ionic levels of NH are relatively higher than those of SH, maybe related to the terrestrial sources and human inputs.
Enrichment factor analysis and multivariate analysis are useful tools for discriminating ion sources in wet deposition. Enrichment factors of Cl−, K+ and Mg2+ approaching 1 reveal that they are dominated by marine source, which is validated by their great loadings in the same principal component. The well correlations between marine-sourced ions and wind speed indicate that seawater sprays contribute most to the precipitation of Cl−, Na+, K+ and Mg2+. , and Ca2+ are mainly related to terrestrial emissions, whereas origins are complicated, and sea salts, human inputs as well as biogenic sources are the possible contributors. Air mass backward trajectory analysis provides an intuitive demonstration of ion sources, and ions in the wet deposition are dominated by both regional emissions and long-distance transport of materials.
Acknowledgements
This work was supported by Shanghai Municipal Natural Science Foundation (Grant No. 11ZR1441100), the Youth Scientific and Technological Innovation Foundation (Grant No. JDQ200901), the Open Fund of State Key Laboratory of Cryospheric Sciences (Grant No. SKLCS2011-02), the Foundation of Polar Strategy Research of China (Grant No. 2011-10), the Young Foundation of SOA (Grant No. 2012532) and the Twelfth Five-Year Plan for Polar Science (Grant No. CHINARE2012-02-02). The authors express their appreciation for the members of the 27th Chinese National Antarctica Research Expedition (CHINARE) for their help during sampling. The authors thank the reviewers for their help in the development and improvement of this article.