Fig. 1.
Sampling locations in the western coastal Bay of Bengal. Isobaths of 50, 250 and 1000 m were also shown. Acronyms K, G, VD, HD, M stands for rivers Krishna, Godavari, Vamsadara, Hyadri and Mahanadi, whereas N and S attached to the river name represent north and south of the mouth of the river, respectively. Transect names are given in white, whereas river names are given in black.
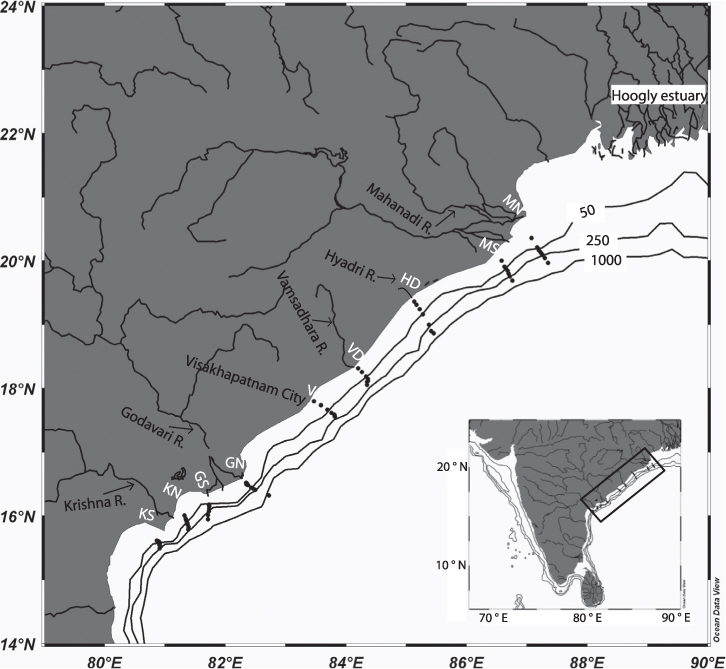
Fig. 2.
Distribution of (a) temperature (°C), (b) salinity (psu), (c) suspended particulate matter (mg L−1), (d) dissolved oxygen (µmol kg−1), (e) dissolved nitrate (µmol kg−1) and (e) Chlorophyll-a (mg L−1) during southwest monsoon.
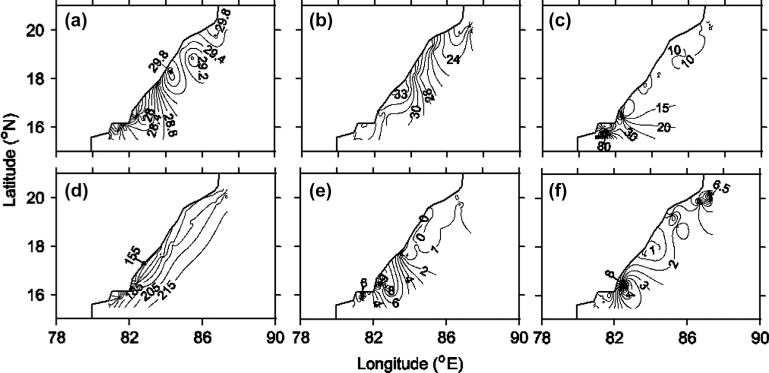
Fig. 3.
Distribution of (a) dissolved inorganic carbon (µmol kg−1), (b) total alkalinity (µmol kg−1), (c) pH and (d) pCO2 (µatm) in the west coast of the Bay of Bengal.
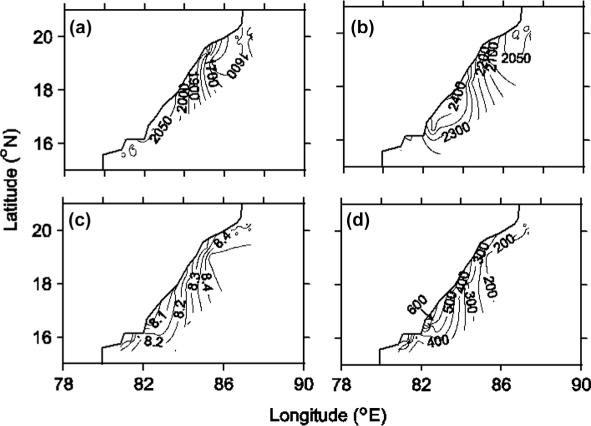
Table 1. Mean±SD of different parameters along the transect lines
[i] TA, total alkalinity.
[ii] aTransects that are directly affected by the river discharge from the respective river.
Table 2. Mean±SD of inorganic carbon components of surface waters in the inner estuaries
[i] TA, total alkalinity.
[ii] aCollected from Krishna Barrage, Vijayawada.
[iii] bCollected from Cotton Barrage, Dowleiswaram.
[iv] cCollected from Dam authorities, Cuttack.
[v] dCollected from Indira Gandhi Dam authorities, Farakka.
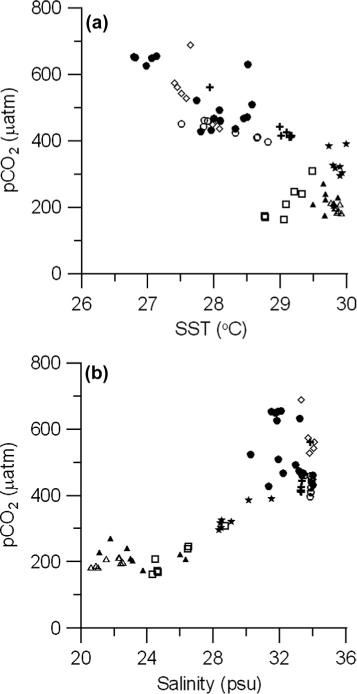
Fig. 4.
Relationship of pCO2 with (a) sea surface temperature and (b) salinity. The data collected off Godavari estuary north (GN–closed circles), Godavari estuary south (GS–open circles), Krishna estuary south (KS–open diamonds), Krishna estuary north (KN–closed diamonds), Visakhapatnam (V–plus), Vamsadhara estuary (VD–star), Hyadri estuary (HD–open square), Mahanadi estuary north (MN–closed triangle) and Mahanadi estuary south (MS–open triangle).