
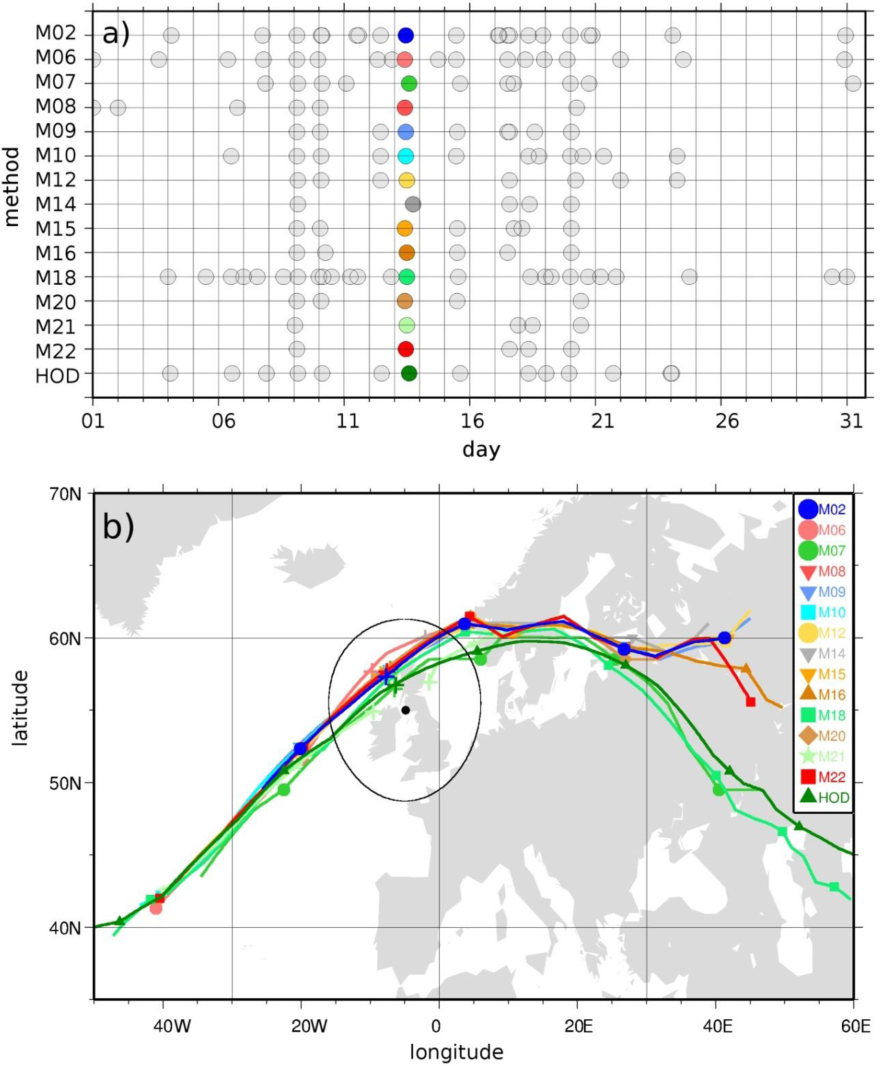
Fig. 1
(a) Time series of cyclone passages in January 2007 for different methods (CF. M02–M22, Table 1) for the grid point 55°N, 5°W (black dot in b). Events on January 13 are marked in colour for each method. (b) Map with tracks corresponding to marked events in a). Closest position of the track to the grid point is marked by +.
Table 1. List of cyclone tracking methods used in this study according to the IMILAST project denominations (Code M02–M22, HOD), main references of the method description and main variable used
M02Murray and Simmonds (1991), Pinto et al. (2005)MSLP (min), VORTM061997), Hewson and Titley (2010) MSLP (min. grad.)M07 Flaounas et al. (2014) Z850 VORTM082006)MSLP (min. grad.)M091995), Wang et al. (2006)MSLP (min. grad.), VORTM10Murray and Simmonds (1991), Simmonds et al. (2003)MSLP (min), VORTM122002), Rudeva and Gulev (2007)MSLP (min)M14 Kew et al. (2010) Z850 (min. contour)M15Blender et al. (1997), Raible et al. (2008)MSLP (min)M162002)MSLP (min)M181994, Sinclair 1997)Z850 VORTM202006)MSLP (min)M212009)Z850 VORTM222005), Akperov et al. (2007)MSLP (min. contour)HODHodges (1994, 1999), Hodges et al. (2011)Z850 VORT
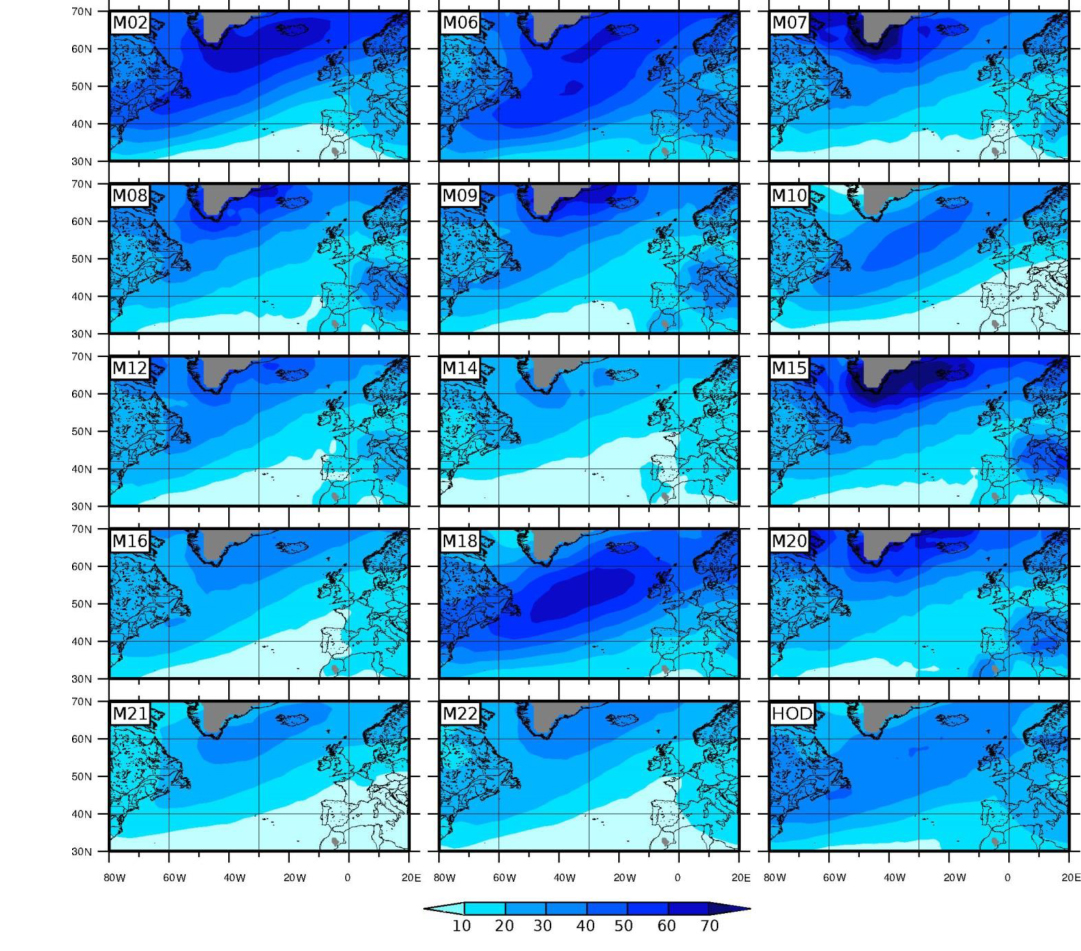
Fig. 2
Average number of DJF cyclone passages for each of the 15 methods (M02–M22, HOD) derived from ERA-Interim (1979–2010).
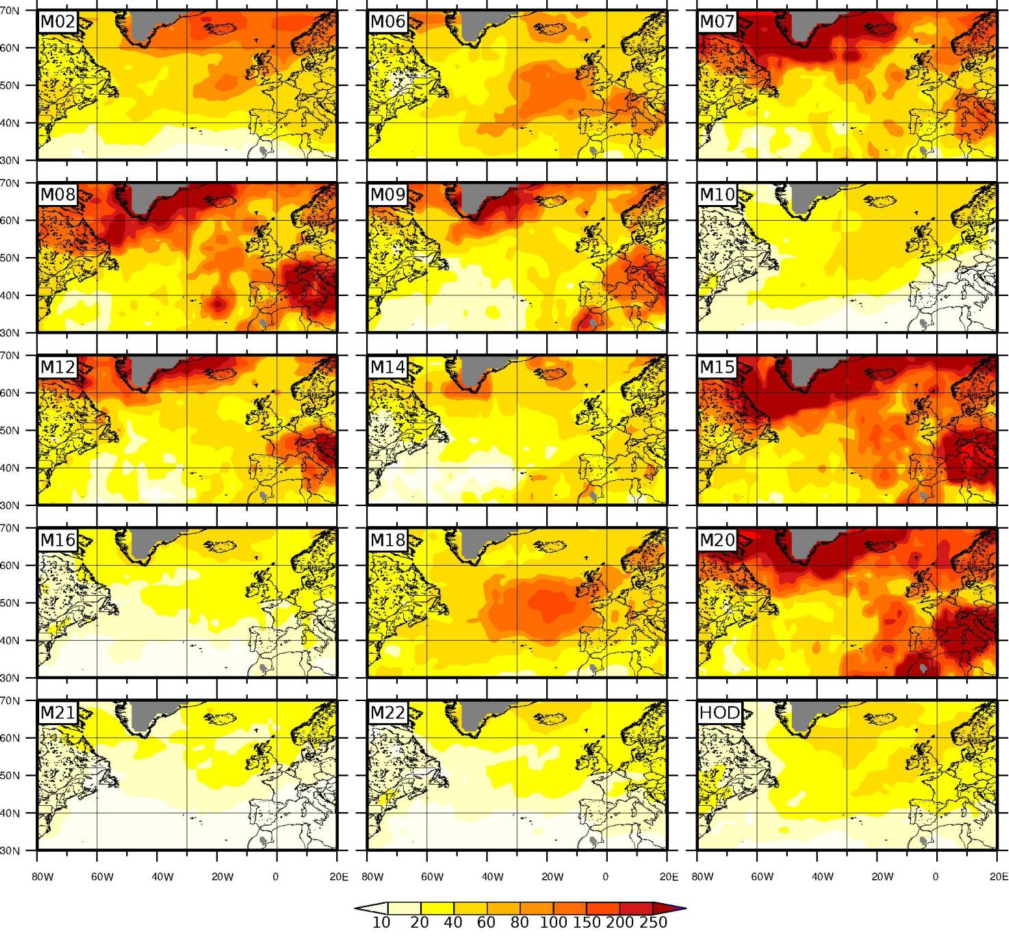
Fig. 3
Variance of DJF cyclone passages (s y )2 for each of the 15 methods (M02–M22, HOD) derived from ERA-Interim (1979–2010).
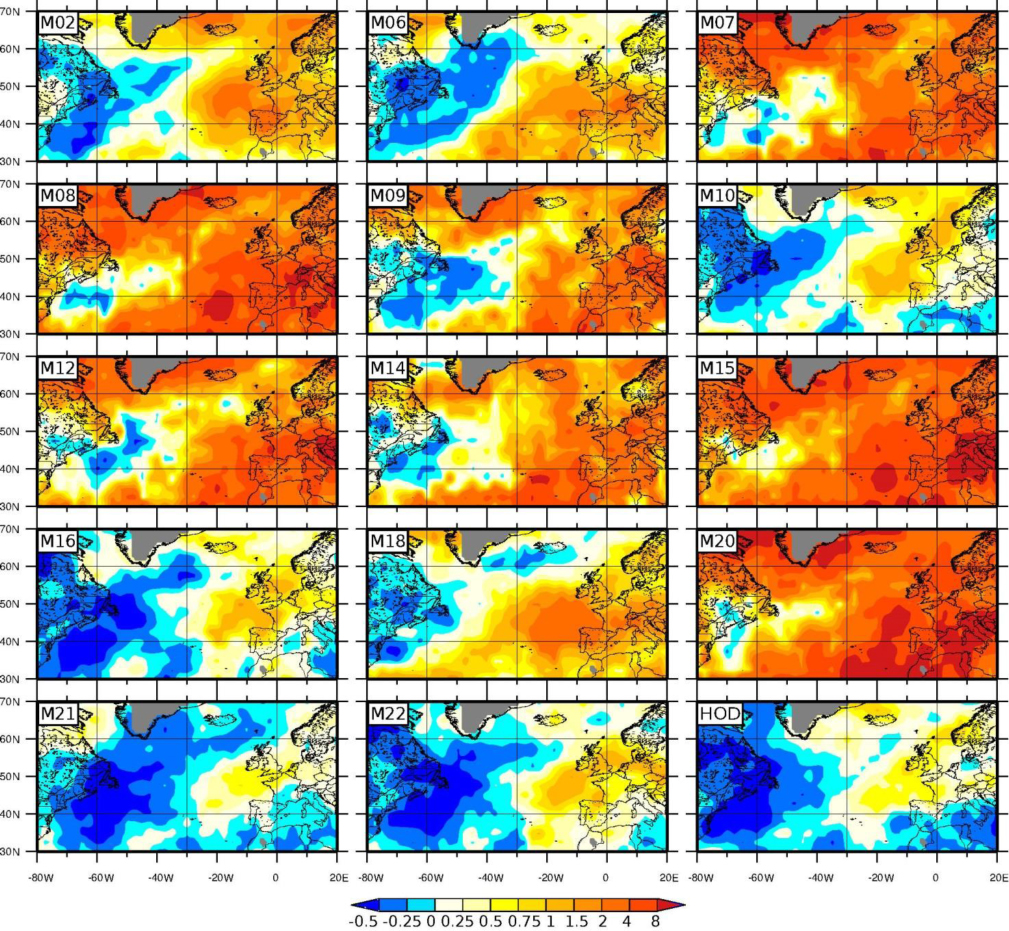
Fig. 4
Dispersion statistic φ for each of the 15 methods (M02–M22, HOD) derived from ERA-Interim (1979–2010).
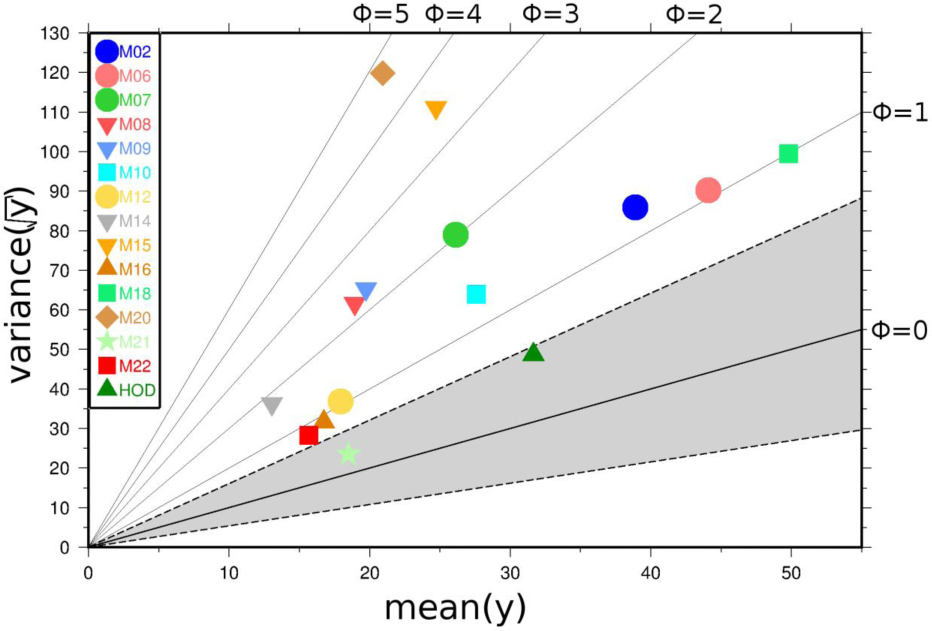
Fig. 5
Variance (y-axis) and mean of cyclone track counts per winter (x-axis) for the grid point 55°N, 5°W for each method (M02–M22, HOD). Isolines of dispersion statistic φ are depicted in black (for values 0–5). The grey area depicts a 95% (bootstrap) confidence interval for the variance, under the assumption of no overdispersion.
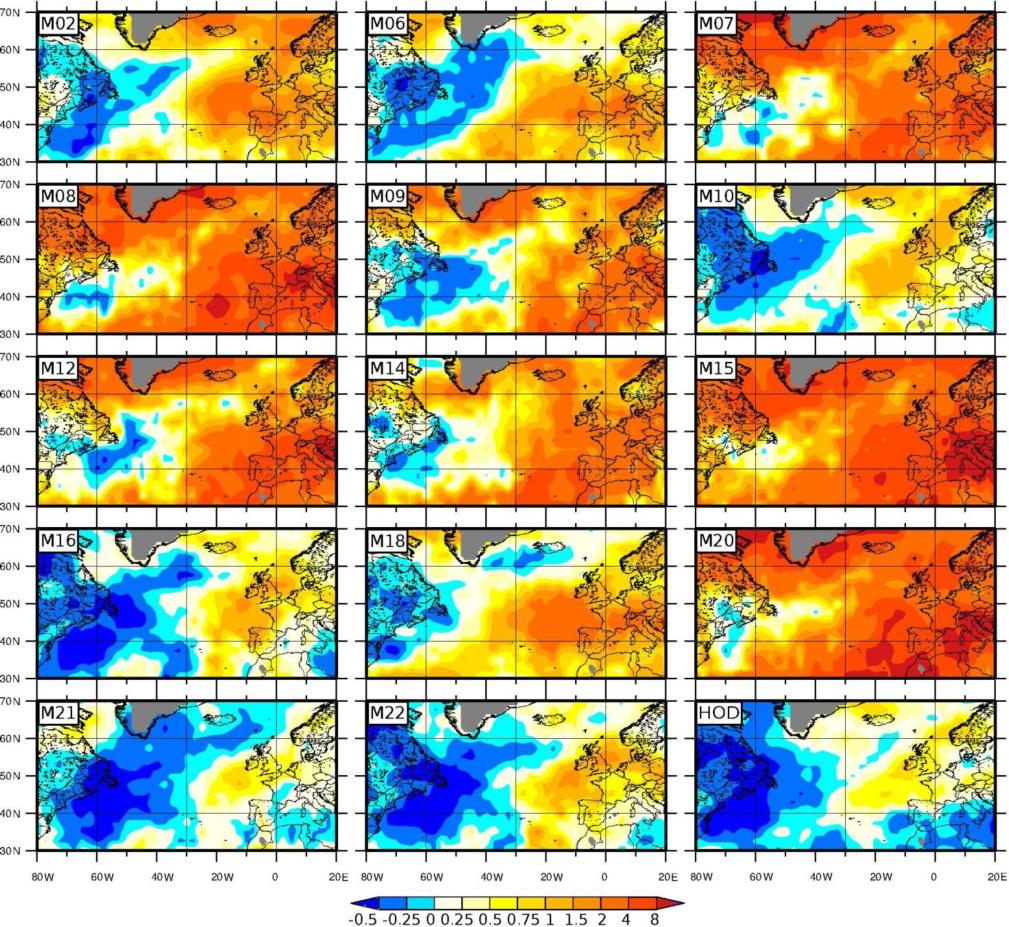
Fig. 6
Estimated dispersion statistic quantified with −1 for each of the 15 methods (M02–M22, HOD) derived from ERA-Interim (1979–2010). Derived from ERA-Interim (1979–2010).
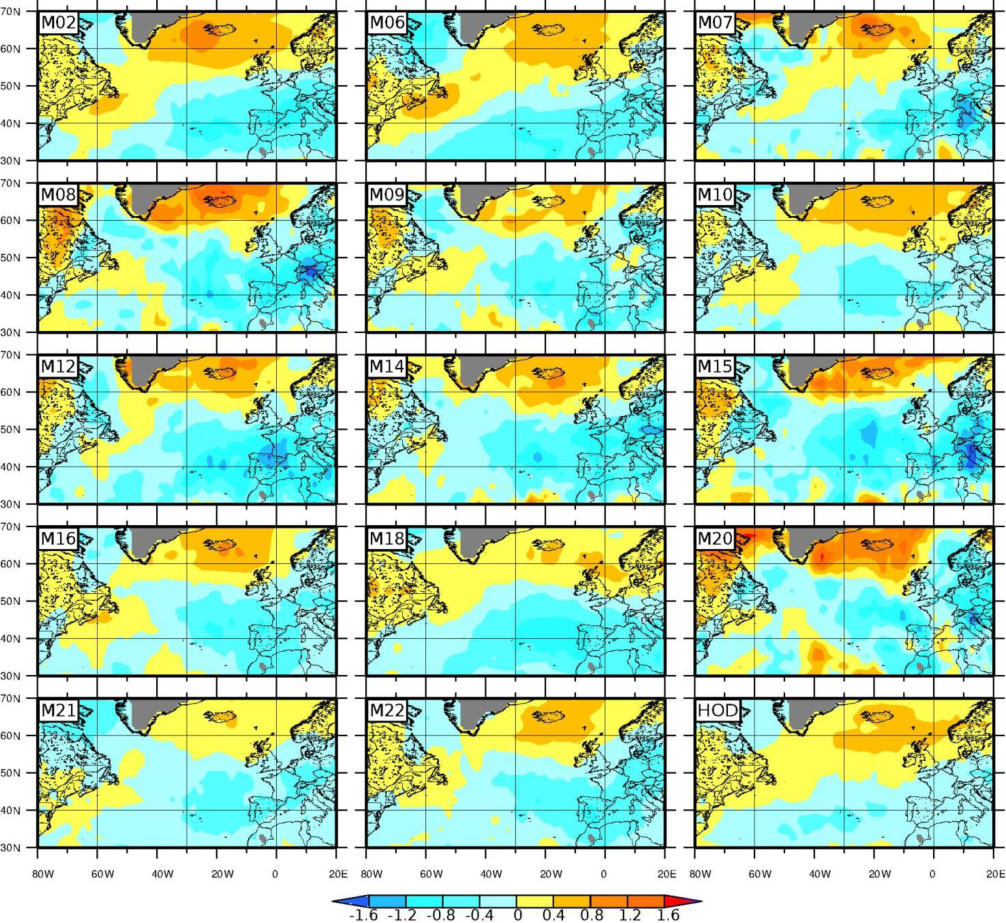
Fig. 7
Regression coefficient β (see EQ.3) for each of the 15 methods (M02–M22, HOD) derived from ERA-Interim (1979–2010).
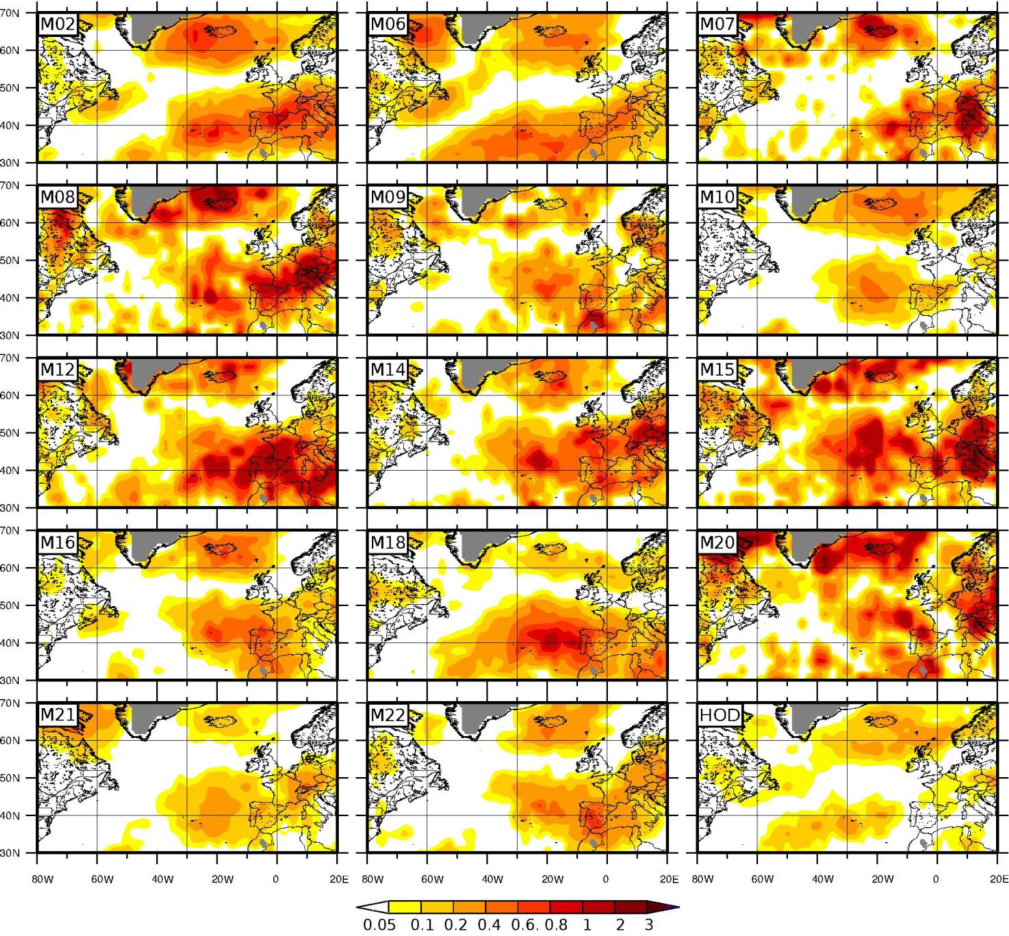
Fig. 8
Effect of North Atlantic Oscillation (NAO) on dispersion following 4β 2(s x )2 for each of the 15 methods (M02–M22, HOD) derived from ERA-Interim (1979–2010).
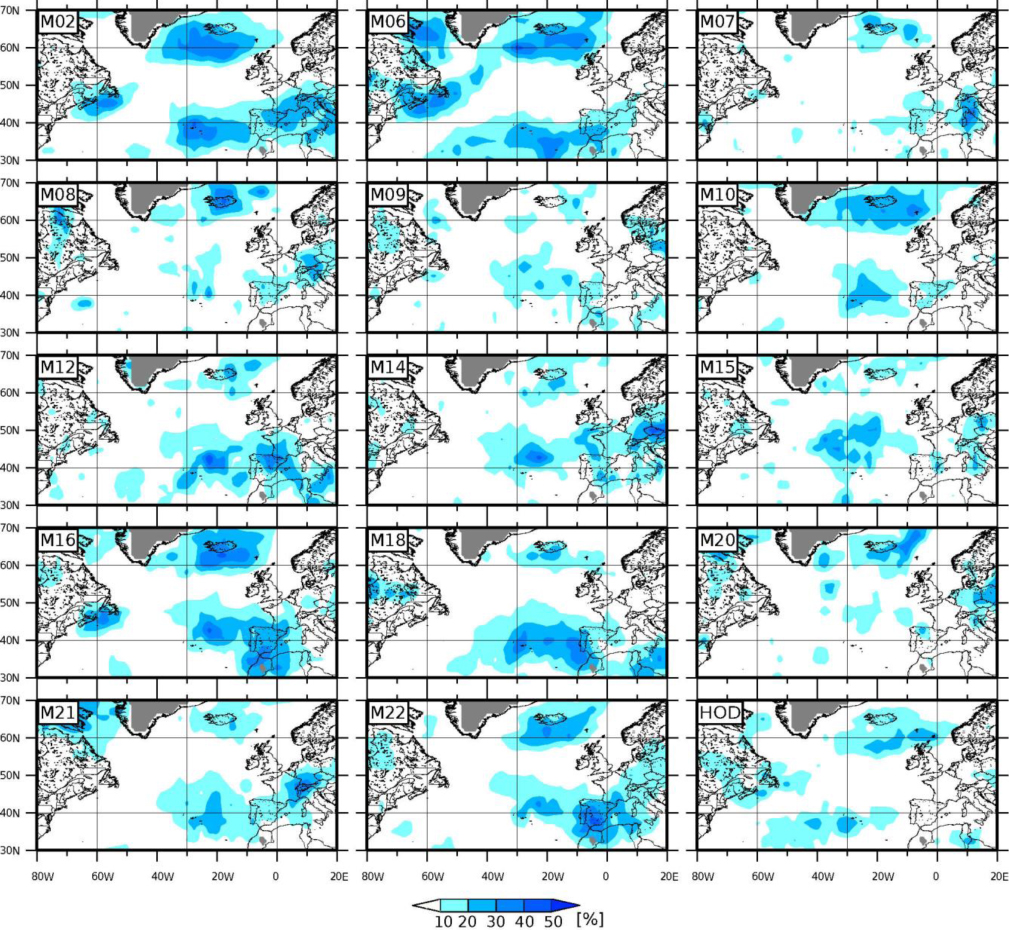
Fig. 9
Relative effect of North Atlantic Oscillation (NAO) on dispersion following for each of the 15 methods (M02–M22, HOD) derived from ERA-Interim (1979–2010).