
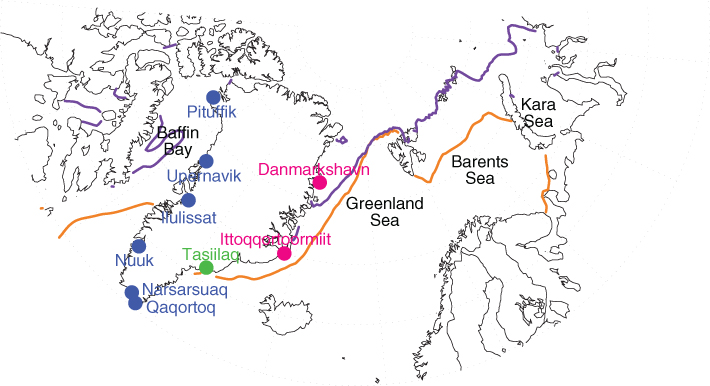
Fig. 1
Location map of Greenland climate stations from the DMI and sea ice extent (SIE) from NSIDC. Orange and purple lines are 50 % sea ice concentration (SIC) based on the HadISST in winter and summer, respectively.
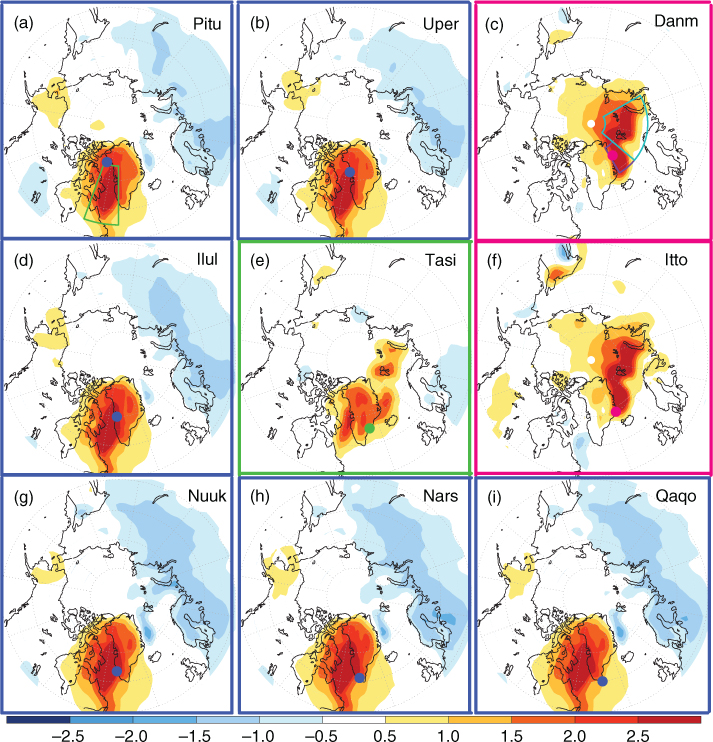
Fig. 2
Horizontal maps of winter surface air temperature at the 2 m level (T2m, °C) regressed on standardised yearly indices of winter Greenland station temperatures (GrSTs): (a) Pituffik, (b) Upernavik, (c) Danmarkshavn, (d) Ilulissat, (e) Tasiilaq, (f) Ittoqqortoormiit, (g) Nuuk, (h) Narsarsuaq and (i) Qaqortoq. These Greenland stations show dotted colours that are the same colours in the stations in Fig. 1. T2m area over the west of Greenland (green box in Fig. 2a), east of Greenland (Purple box in Fig. 2c) and Barents Sea (blue box in Fig. 2c) are calculated by 55–75°N, 290–310°W, 70–80°N, 340–360°W, and 70–85°N, 0–70°E, respectively. Colour intervals are indicated on the scale bar (°C).
Table 1. Correlation coefficients matrix winter surface temperature on the station datasets based on the DMI
Pitu0.86*0.86*0.78*0.71*0.72*0.40*−0.050.09Uper0.92*0.82*0.76*0.79*0.54*0.040.14Ilul0.91*0.85*0.87*0.51*0.020.09Nuuk0.95*0.94*0.40*−0.14−0.05Qaqo0.99*0.44*−0.11−0.07Nars0.51*−0.07−0.05Tasi0.55*0.41*Itto0.78*Danm
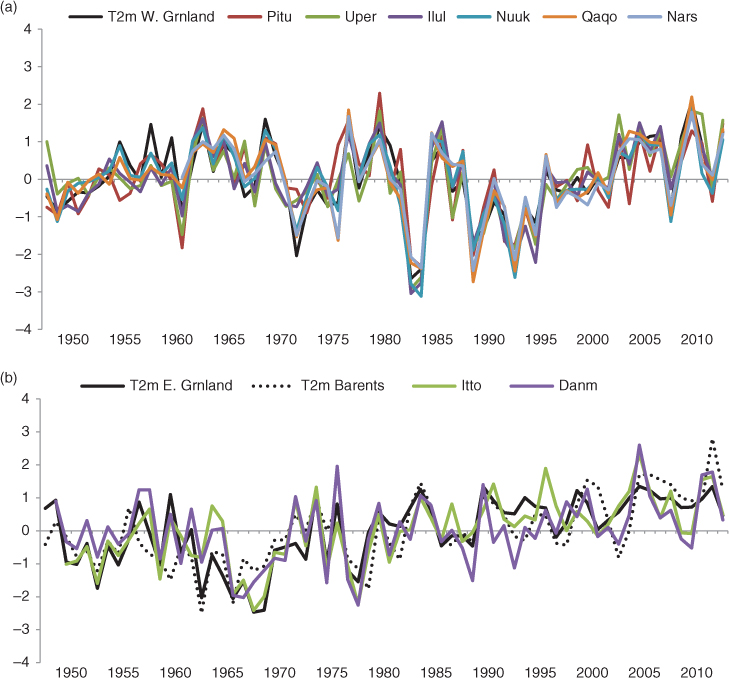
Fig. 3
(a) Standardised time series of winter T2m over Baffin Bay and Davis Strait (green box in Fig. 2a) and winter GrSTs from six stations on the west and south of Greenland (Pituffik, Upernavik, Ilulissat, Nuuk, Qaqortoq and Narsarsuaq). (b) Time series of winter T2m over the Greenland Sea and Barents Sea (purple and blue boxes in Fig. 2c) and winter GrSTs from two stations over the east of Greenland (Ittoqqortoormiit and Danmarkshavn).
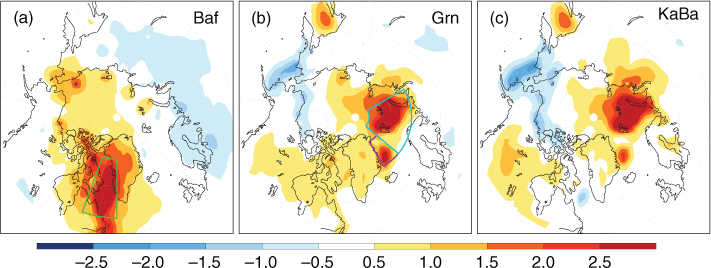
Fig. 4
As in Fig. 2 but winter T2m regressed on an inverted standardised yearly index of winter SIE from 1979 to 2013: (a) Baffin Bay, (b) Greenland Sea and (c) Kara-Barents Seas. The green, purple and blue boxes in 4a and b are the same as in Fig. 2a and c.
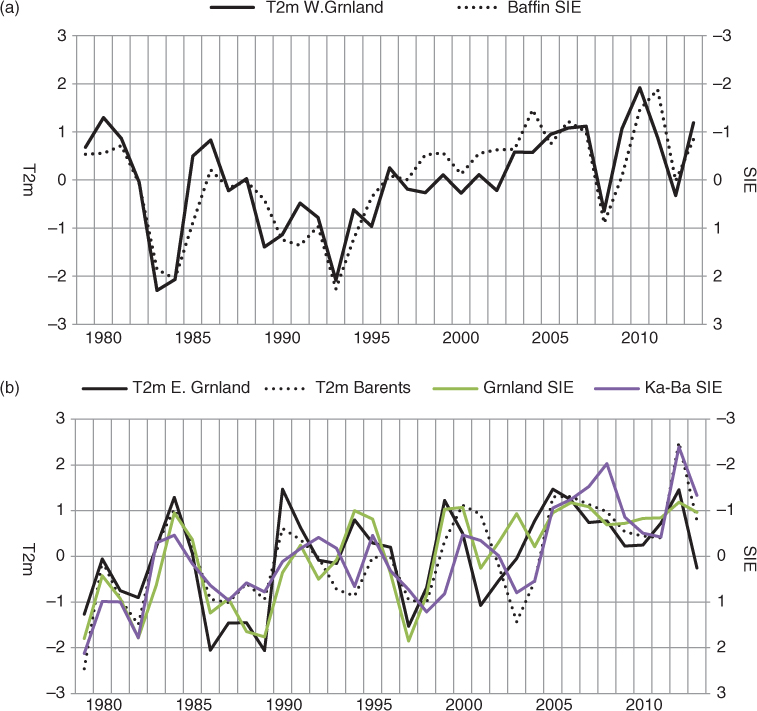
Fig. 5
Standardised times series of winter T2m and (a) SIE in Baffin Bay and (b) SIEs in the Greenland Sea and Kara-Barents Seas from 1979 to 2013. Area-averaged T2m is shown in Fig. 4a (green box) and Fig. 4b (Purple and blue boxes). The SIE axis is reversed.
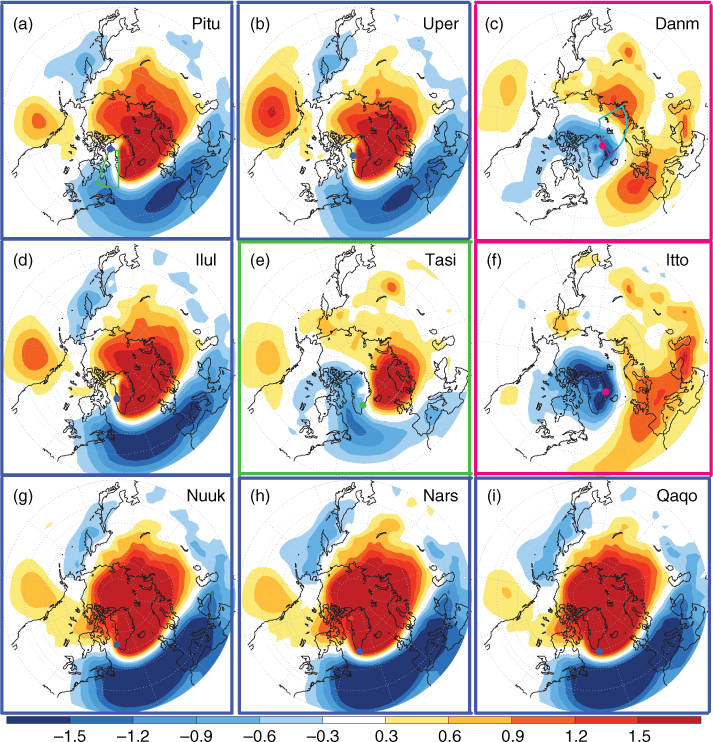
Fig. 6
As in Fig. 2 but for winter mean sea level pressure (SLP, hPa) regressed on winter GrST indices.
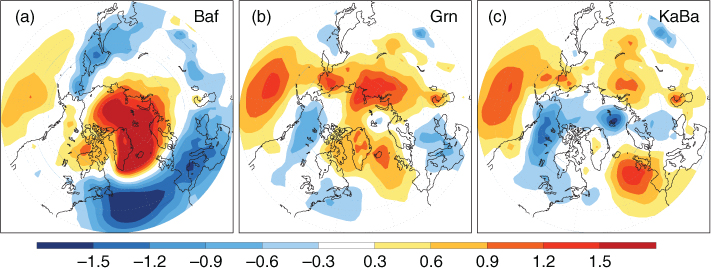
Fig. 7
As in Fig. 4 but for winter SLP regressed on an inverted winter SIE indices.
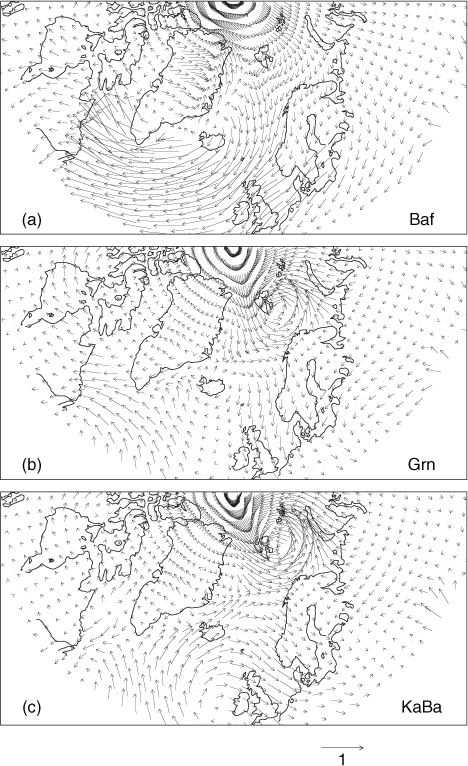
Fig. 8
As in Fig. 4 but for winter surface winds at 10 m (m/s) regressed on an inverted winter SIE indices.
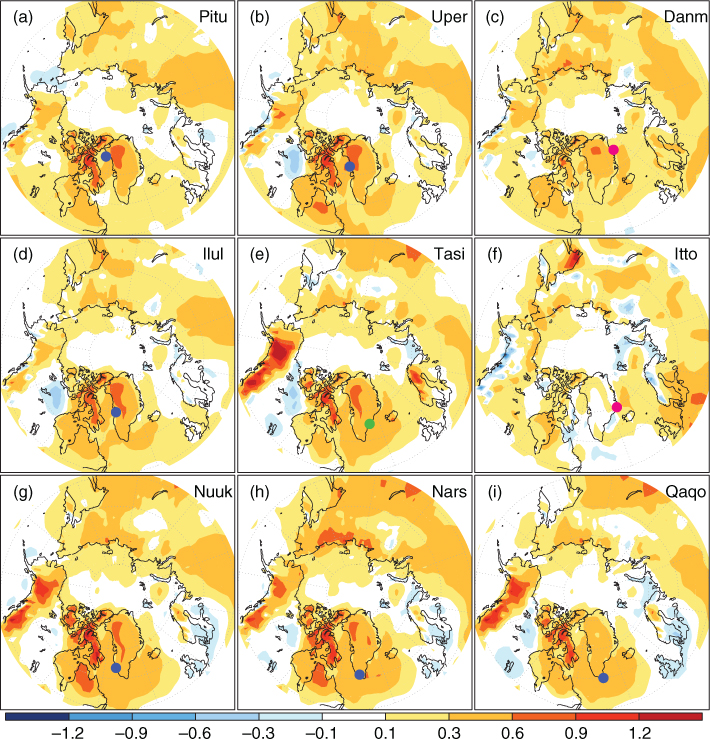
Fig. 9
As in Fig. 2 but summer T2m regressed on summer GrST indices.
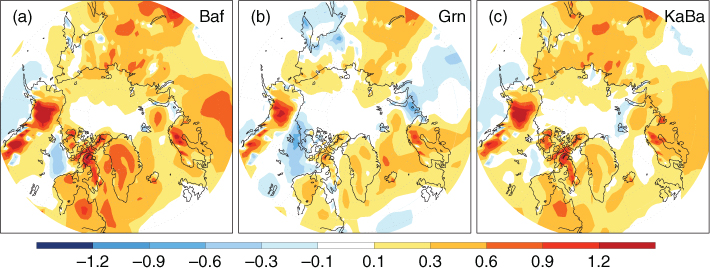
Fig. 10
As in Fig. 4 but summer T2m regressed on an inverted summer SIE indices.
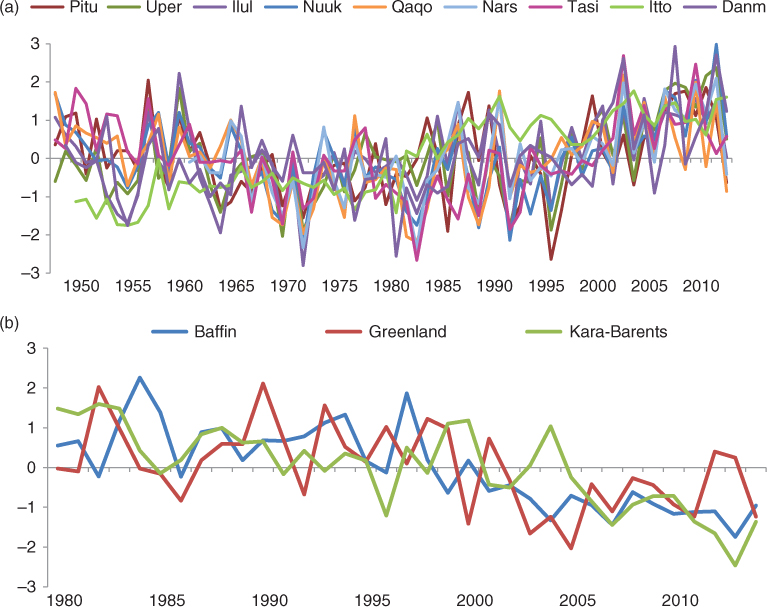
Fig. 11
Standardised time series of (a) summer nine GrSTs surrounding Greenland and (b) summer three SIEs in Baffin Bay, the Greenland Sea and Kara-Barents Seas.
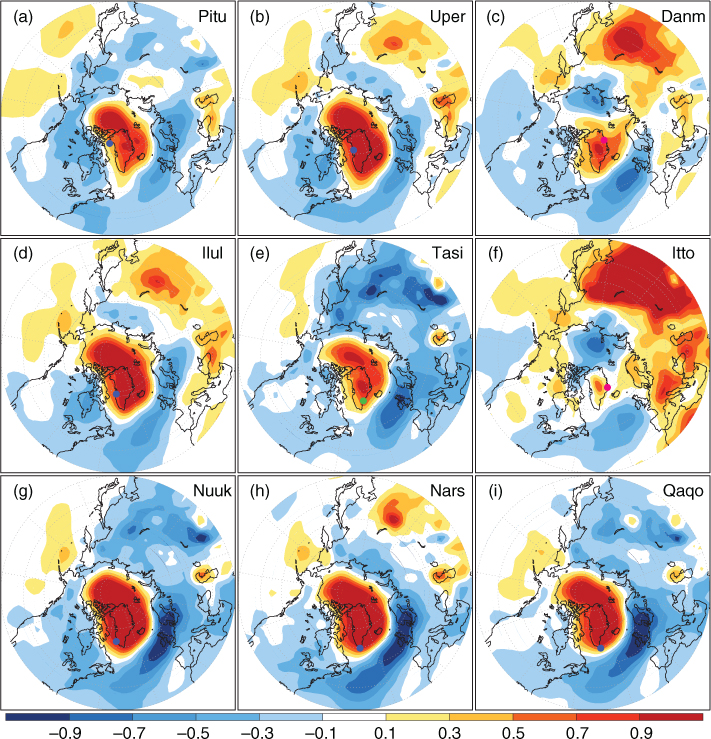
Fig. 12
As in Fig. 2 but summer SLP regressed on summer GrST indices.
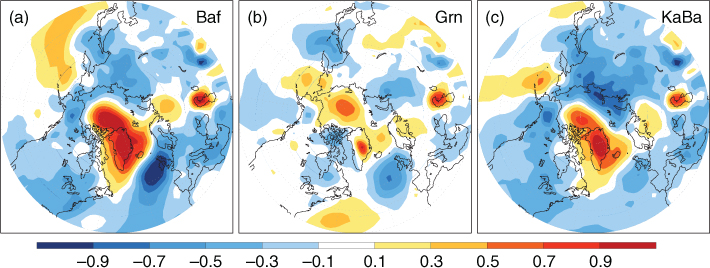
Fig. 13
As in Fig. 4 but for summer SLP regressed on an inverted summer SIE indices.